> ## Documentation Index
> Fetch the complete documentation index at: https://notes.kodekloud.com/llms.txt
> Use this file to discover all available pages before exploring further.
# Demo FIS experiment CloudWatch Dashboard
> This lesson demonstrates using a CloudWatch dashboard to monitor an Auto Scaling Group during a Fault Injection Simulator experiment.
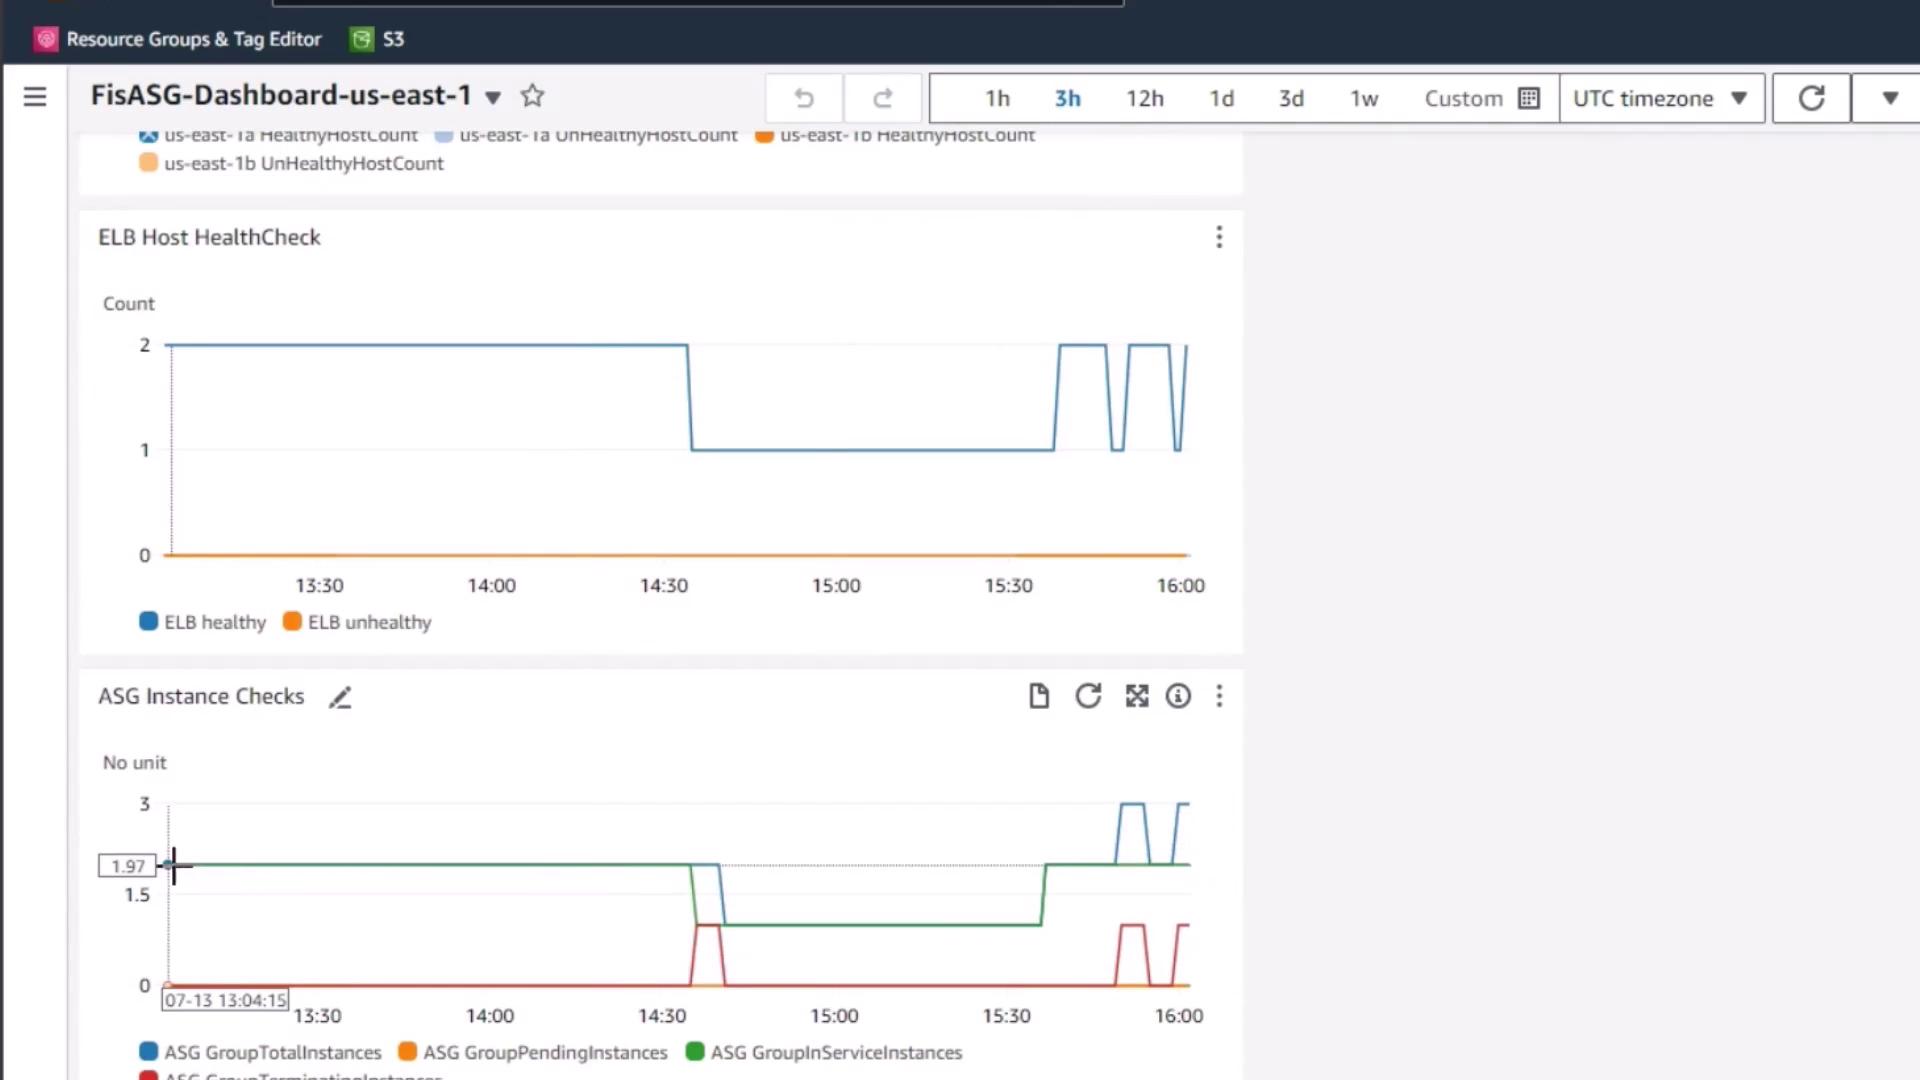
In this lesson, we’ll leverage a pre-configured [Amazon CloudWatch](https://aws.amazon.com/cloudwatch/) dashboard to monitor an [Auto Scaling Group (ASG)](https://docs.aws.amazon.com/autoscaling/ec2/userguide/auto-scaling-groups.html) during a [Fault Injection Simulator (FIS)](https://aws.amazon.com/fis/) experiment. This setup provides real-time insights into ELB health checks and ASG instance status, enabling you to track scaling behavior and resilience under controlled failures.
* An AWS FIS experiment configured to terminate or impair EC2 instances
* An ASG with `minCapacity` set to a desired level
* A CloudWatch dashboard pre-populated with the relevant widgets
## Dashboard Widgets Overview
| Widget Name | Metrics Displayed | Purpose |
| -------------------- | ---------------------------------------- | ------------------------------------------ |
| ELB Host HealthCheck | Healthy vs. unhealthy instances | Monitors ELB health check results |
| ASG Instance Checks | Total, pending, and in-service instances | Tracks scaling events and lifecycle status |
## How to Interpret the Charts
1. **ELB Host HealthCheck**
* **Baseline**: Starts with 2 healthy instances.
* **During FIS**: One instance is terminated → healthy count drops to 1.
* **Recovery**: ASG’s `minCapacity=2` triggers a replacement → healthy count returns to 2.
2. **ASG Instance Checks**
* **Pending**: Instances being initialized after launch.
* **InService**: Fully operational, serving traffic.
* The graph pattern mirrors the ELB health trend, reflecting when the ASG spins up replacement instances.
If you terminate multiple instances at once or set a high desired capacity, the ASG may launch many replacements simultaneously. Monitor the **ASG Instance Checks** widget to avoid unexpected resource costs.
## Conclusion
By correlating the ELB Host HealthCheck and ASG Instance Checks charts, you gain a clear, real-time view of how FIS-induced failures impact instance health and auto scaling. This dashboard becomes a powerful tool for validating the resiliency and fault tolerance of your AWS infrastructure.
## References
* [Amazon CloudWatch](https://aws.amazon.com/cloudwatch/)
* [AWS Fault Injection Simulator (FIS)](https://aws.amazon.com/fis/)
* [Auto Scaling Groups](https://docs.aws.amazon.com/autoscaling/ec2/userguide/auto-scaling-groups.html)