> ## Documentation Index
> Fetch the complete documentation index at: https://notes.kodekloud.com/llms.txt
> Use this file to discover all available pages before exploring further.
# Demo Memory Stress on EKS Part 2
> This lesson establishes a steady-state baseline for an Amazon EKS application by collecting metrics from AWS observability tools before a memory-stress experiment.
In this lesson, we’ll establish a steady-state baseline for our Amazon EKS application by collecting metrics from three AWS observability tools. This prepares us to measure the impact of our Fault Injection Service (FIS) memory‐stress experiment.
Establishing a steady-state baseline is crucial before running any chaos experiment. It helps you distinguish normal behavior from fault-induced anomalies.
## Observability Tools and Key Metrics
| Observability Tool | Focus | Key Metrics |
| -------------------------------- | ---------------- | ------------------------------------------------------------------- |
| CloudWatch Container Insights | Cluster-level | CPU & memory utilization, alarms |
| CloudWatch Performance Dashboard | Service-level | Running pods, CPU utilization, memory use |
| CloudWatch RUM | End-user metrics | Largest Contentful Paint (LCP), First Input Delay (FID), UX ratings |
***
## 1. CloudWatch Container Insights
To begin, navigate to the [CloudWatch Container Insights](https://docs.aws.amazon.com/AmazonCloudWatch/latest/monitoring/ContainerInsights.html) dashboard and select your EKS cluster. Here you can view overall CPU and memory utilization, cluster state summaries, and alarm statuses.
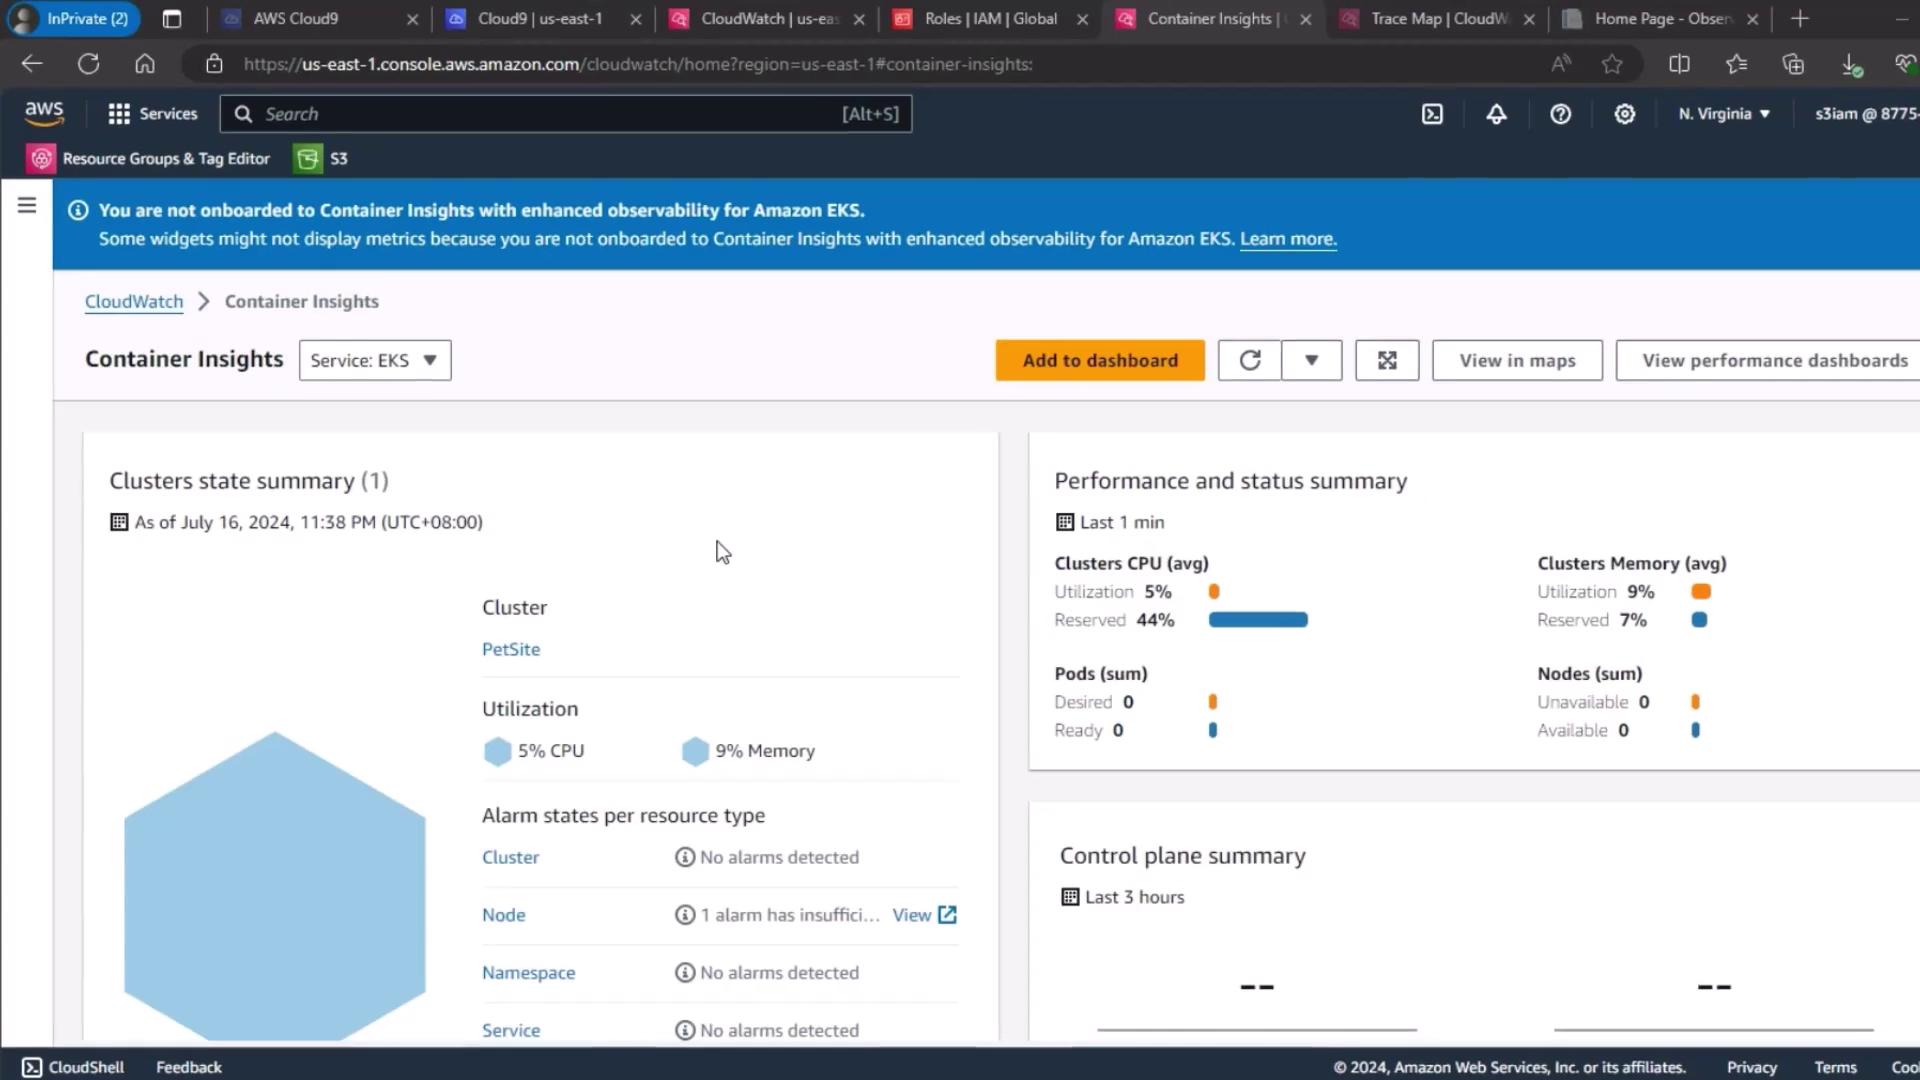
This baseline snapshot reveals how your cluster performs under normal conditions.
***
## 2. Service-Level Performance Dashboard
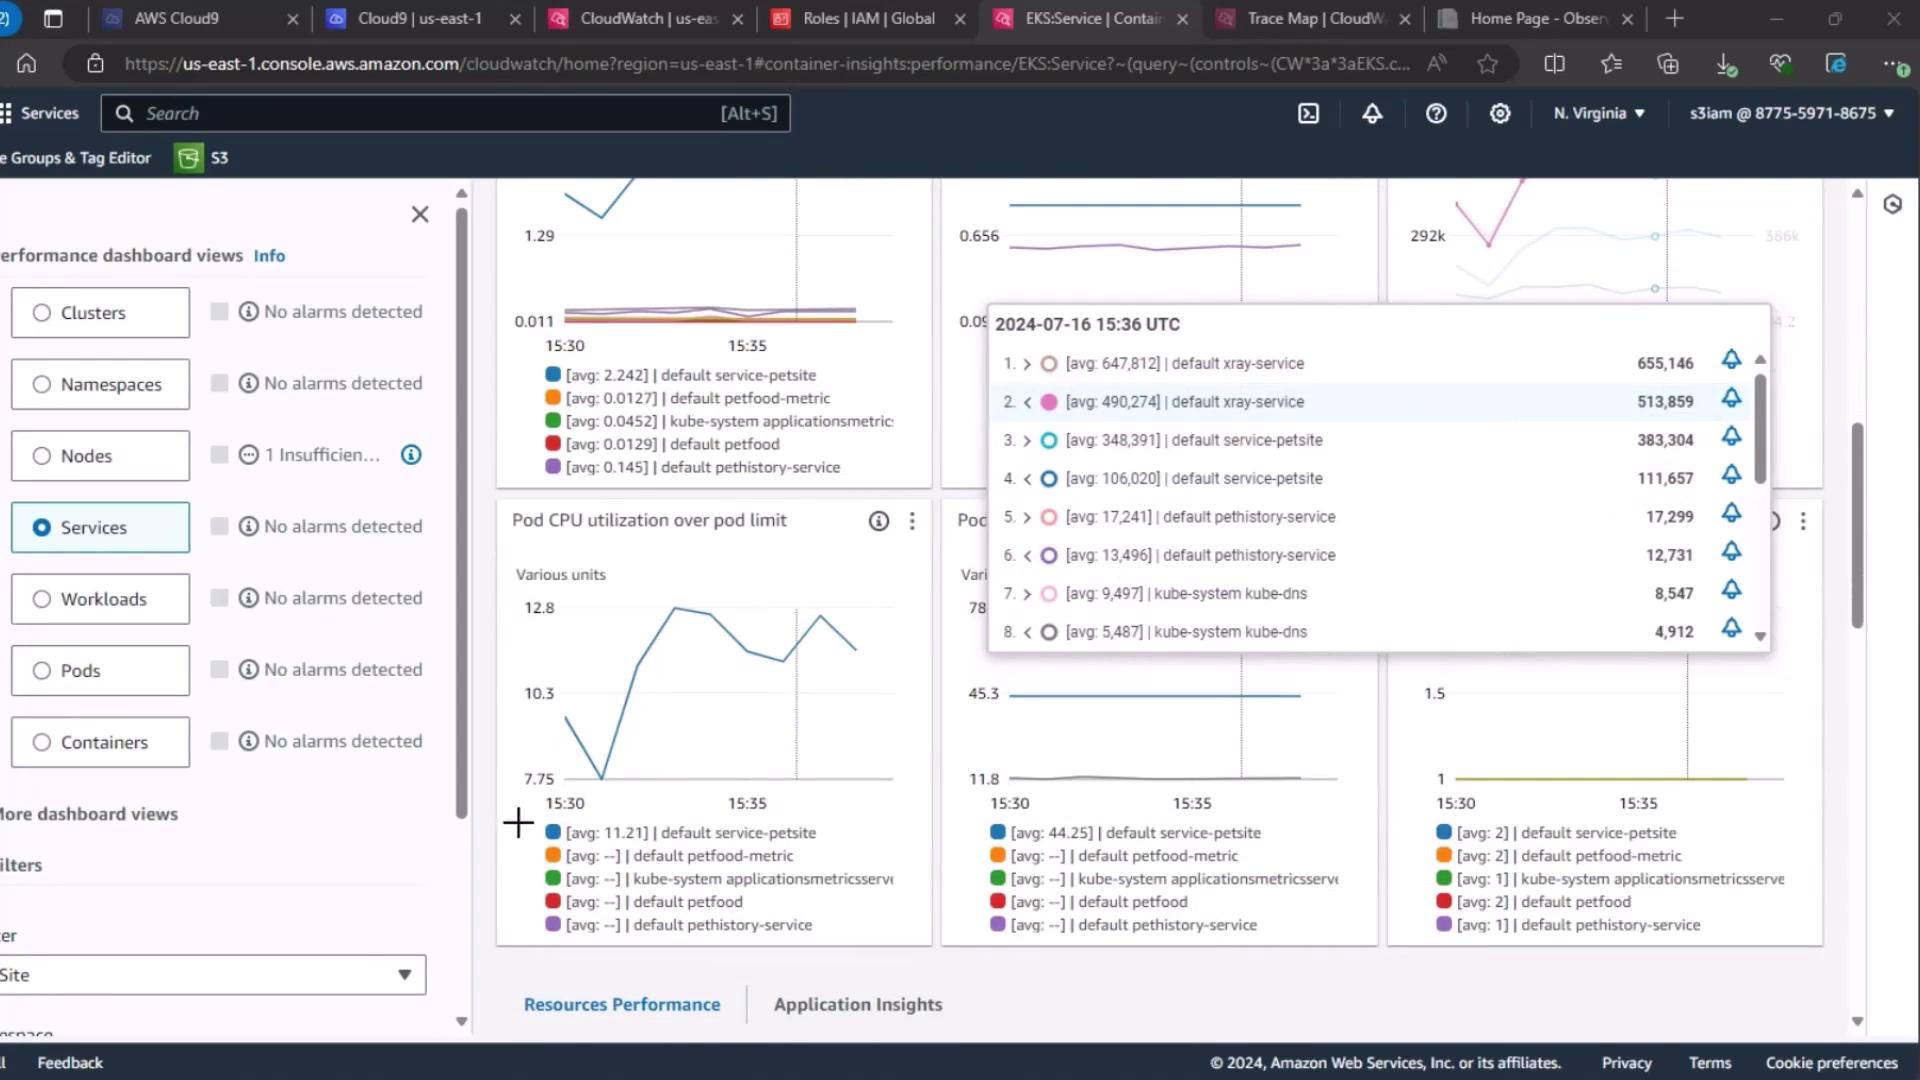
Next, go to the **Services** section under CloudWatch performance dashboards. Wait for the metrics to load, then review:
* Number of running pods
* Pod CPU utilization
* Pod memory utilization
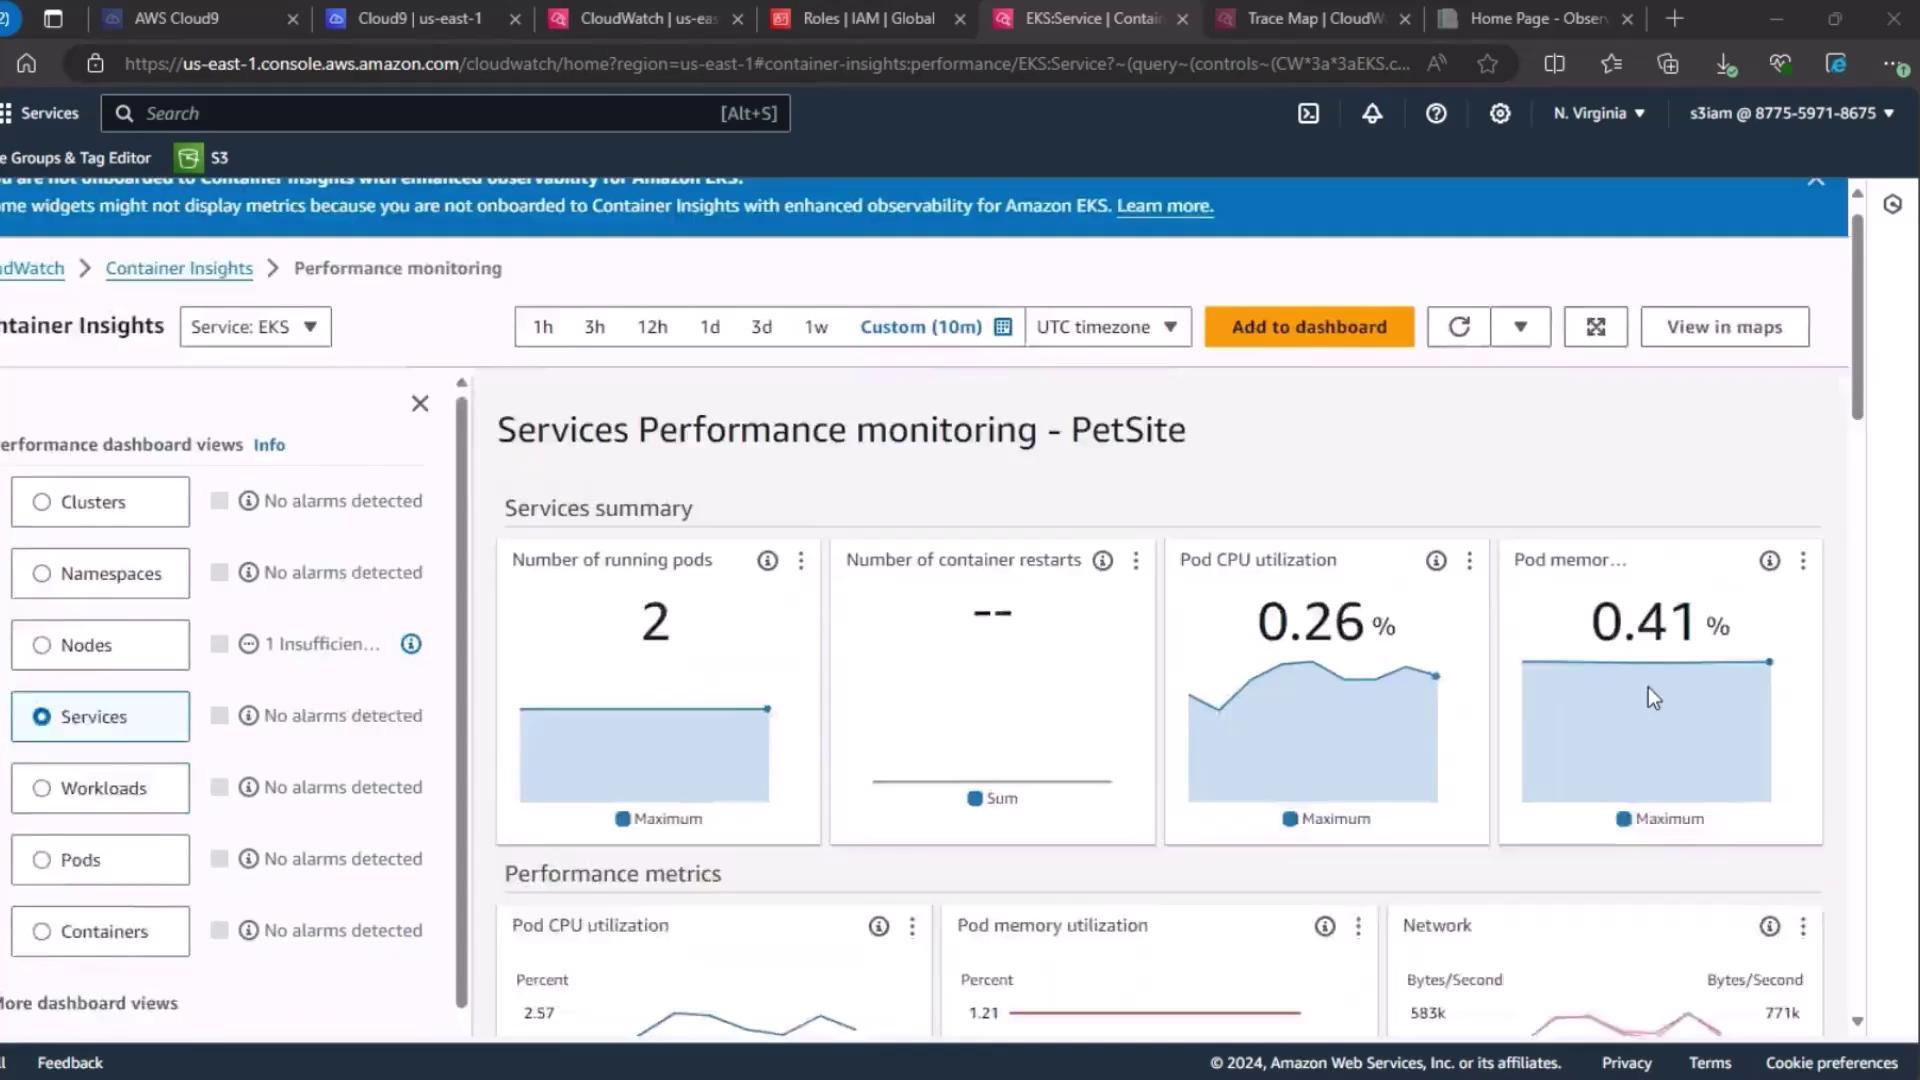
Inspect the time-series graphs to see how these values evolve in real time.
***
## 3. Real User Monitoring (RUM)
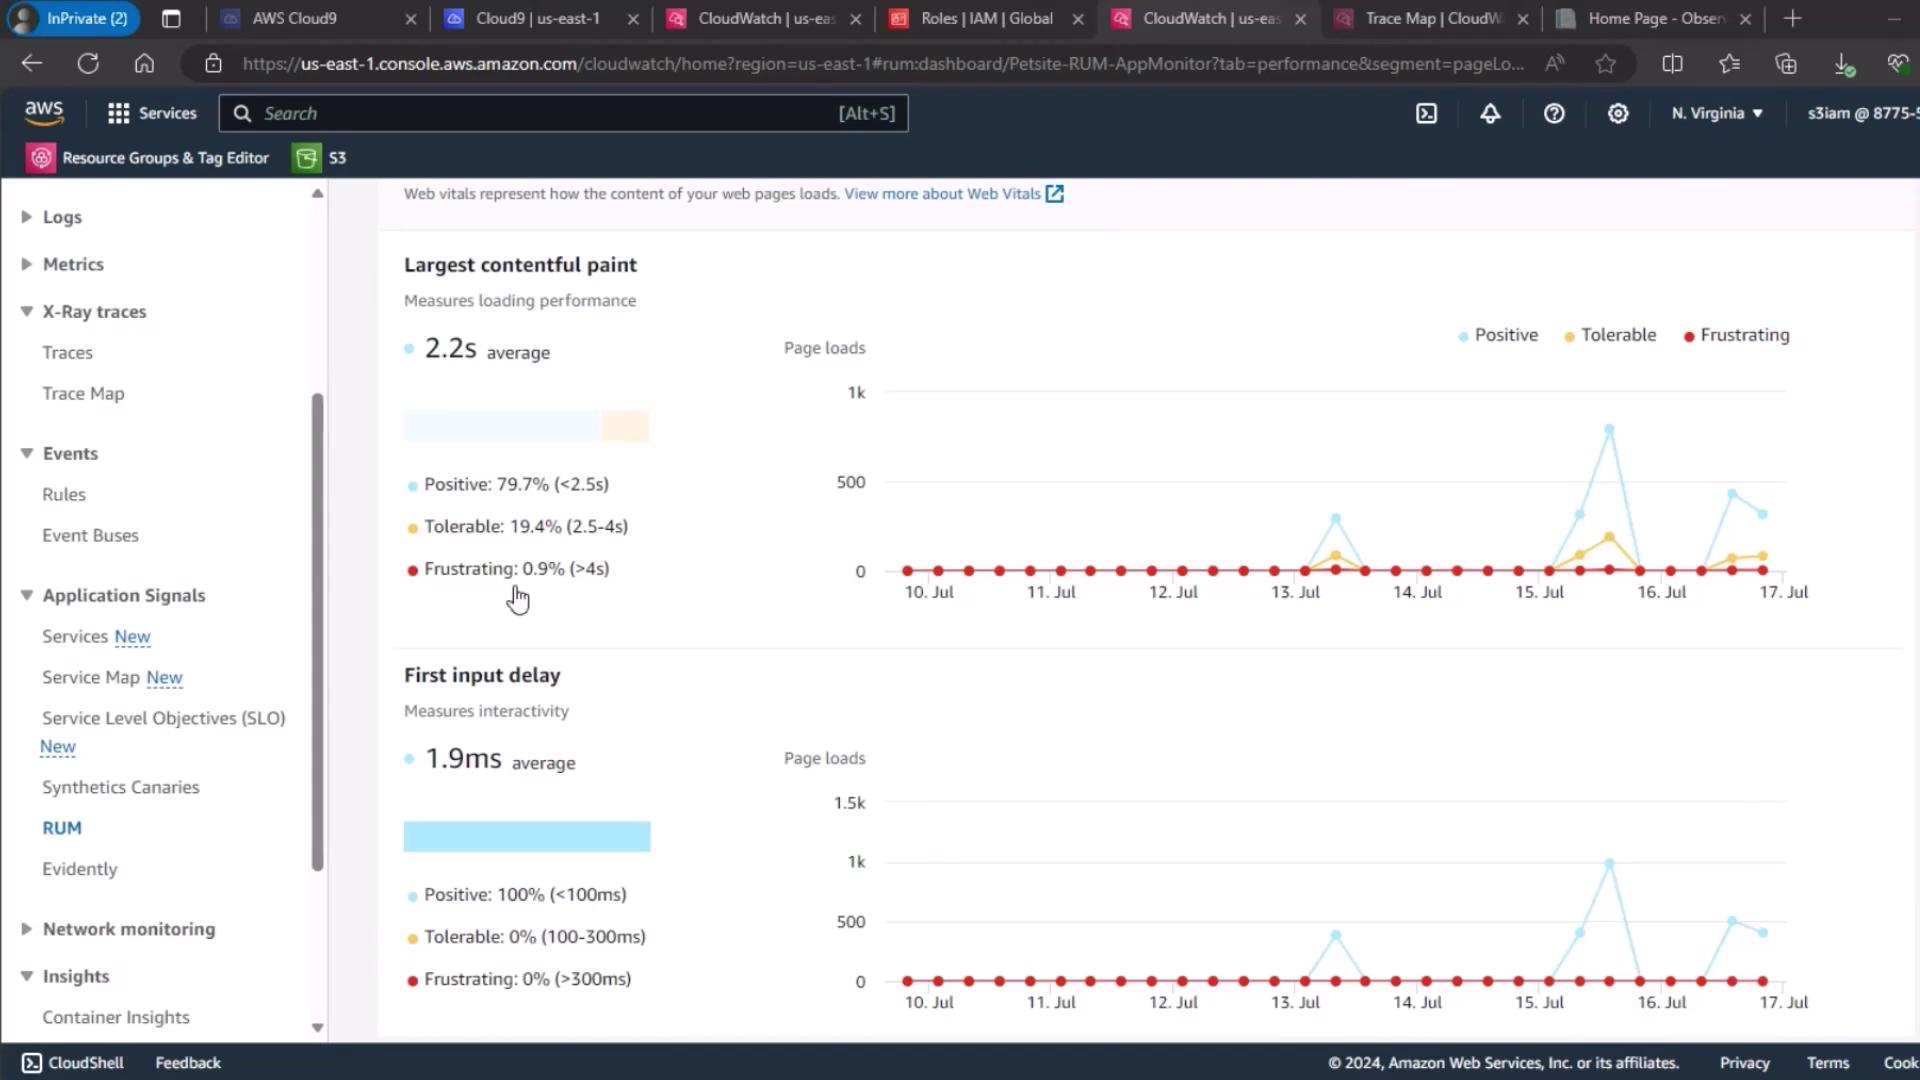
For end-user experience, use [CloudWatch RUM](https://docs.aws.amazon.com/AmazonCloudWatch/latest/monitoring/CloudWatch-RUM.html). Select your PetSite RUM app monitor to view session quality:
* **Positive**
* **Tolerable**
* **Frustrating**
The current “Frustrating” rate is 0.9%, indicating most user sessions are performing well.
***
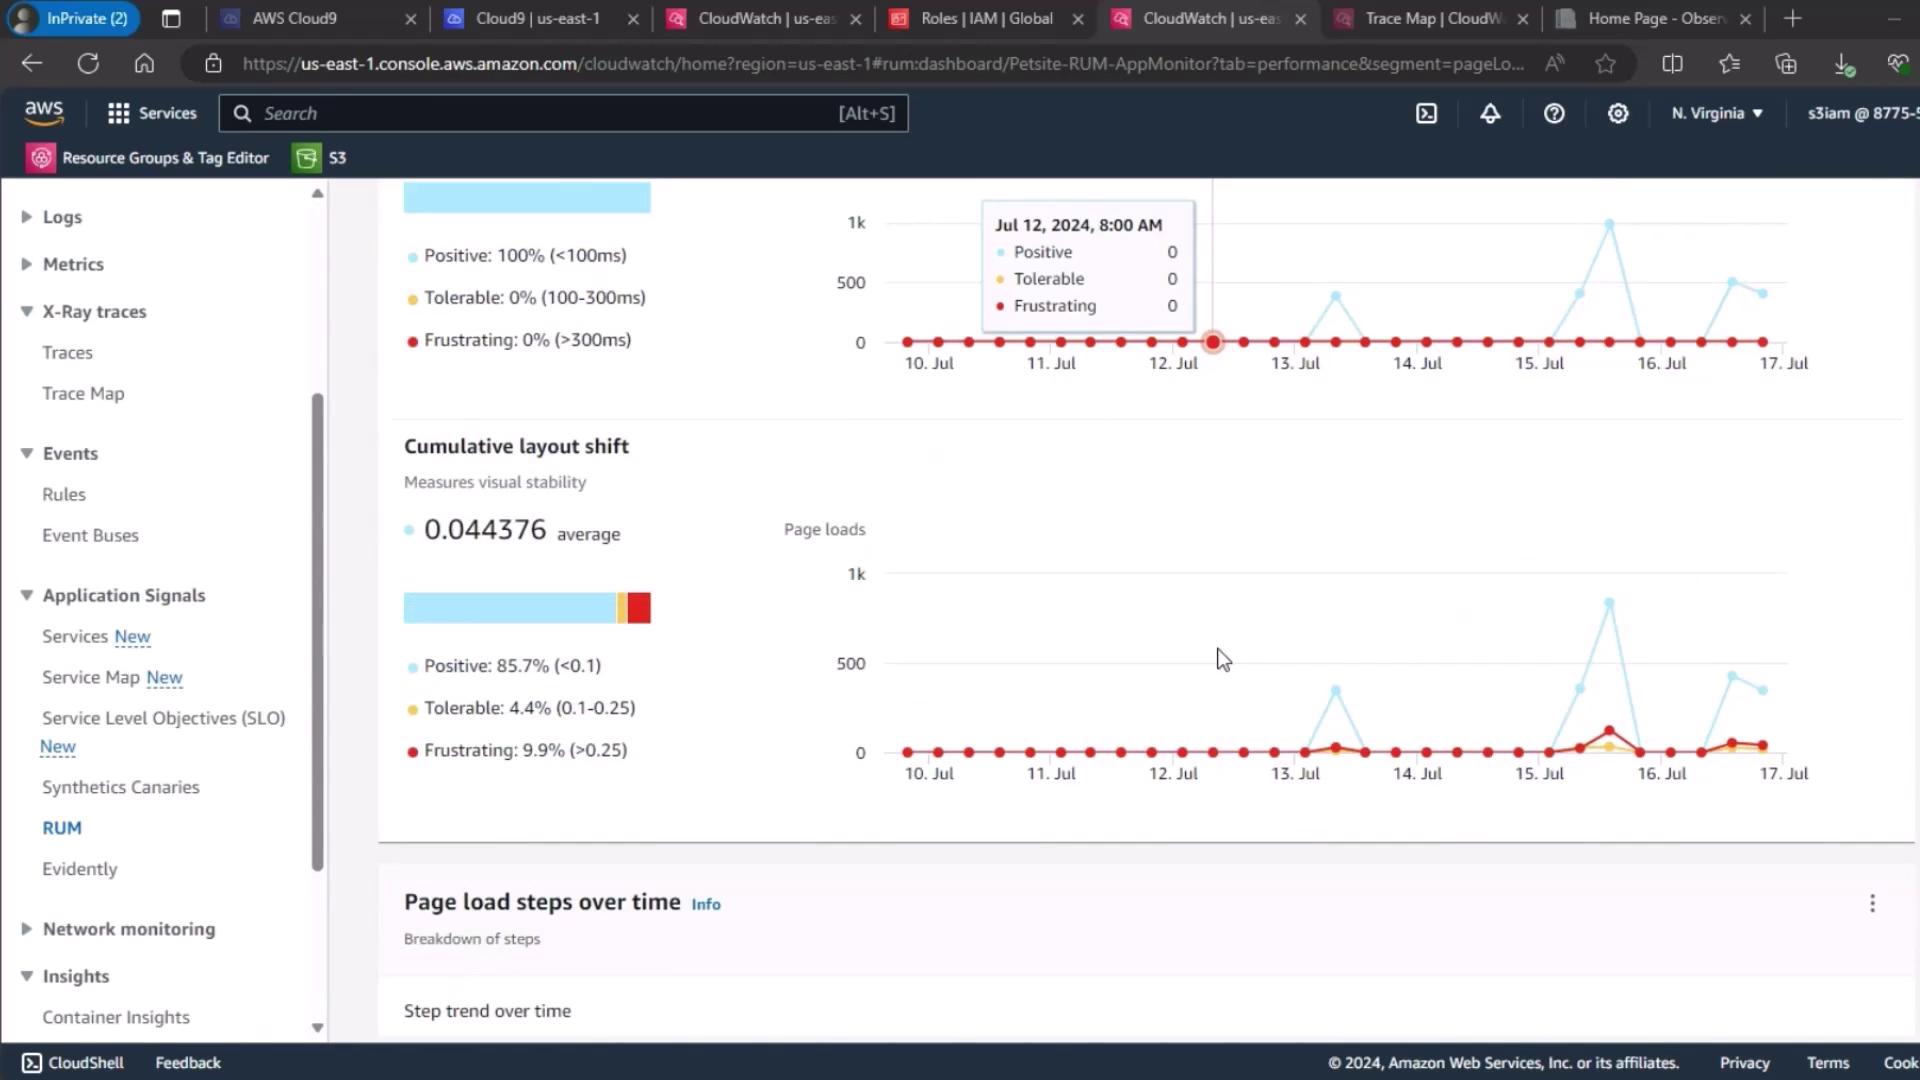
## 4. Page Load Metrics Overview
Finally, review the page load times and Cumulative Layout Shift (CLS) trends to understand the front-end impact before fault injection.
***
## Next Steps
In the next demo, we’ll execute our FIS memory‐stress experiment and revisit these dashboards to observe how injected faults affect cluster health, service performance, and user experience.
## Links and References
* [AWS CloudWatch Container Insights Documentation](https://docs.aws.amazon.com/AmazonCloudWatch/latest/monitoring/ContainerInsights.html)
* [AWS CloudWatch RUM Documentation](https://docs.aws.amazon.com/AmazonCloudWatch/latest/monitoring/CloudWatch-RUM.html)
* [AWS Fault Injection Simulator (FIS)](https://docs.aws.amazon.com/fis/latest/userguide/)
* [Amazon EKS User Guide](https://docs.aws.amazon.com/eks/latest/userguide/)