> ## Documentation Index
> Fetch the complete documentation index at: https://notes.kodekloud.com/llms.txt
> Use this file to discover all available pages before exploring further.
# Demo Recheck After Pod Delete on EKS
> This article demonstrates how Amazon EKS and Kubernetes self-heal after a Pod deletion without impacting end-users.
In this walkthrough, we’ll verify how Amazon EKS and Kubernetes self-heal after a Pod deletion, and confirm there’s no impact on end-users by monitoring the application UI, Real User Monitoring (RUM), and control plane metrics in CloudWatch.
***
## 1. Verify Pod Auto-Replacement
After deleting a Pod, Kubernetes should automatically spin up a new one. Run:
```bash theme={null}
kubectl get pods -n default
```
Expected output:
```bash theme={null}
NAME READY STATUS RESTARTS AGE
petfood-6b56846cbc-85m66 1/1 Running 0 23h
petfood-6b56846cbc-x5t16 1/1 Running 0 23h
petfood-metric-6bd55449d8-6jp97 1/1 Running 0 23h
petfood-metric-6bd55449d8-dbrj8 1/1 Running 0 23h
pethistory-deployment-5f96c67c674-t4mhq 2/2 Running 0 34s
petsite-deployment-6db68bf8-lv6w4 1/1 Running 0 34s
petsite-deployment-6db68bf8-xqs7h 1/1 Running 2 (68m ago) 23h
xray-daemon-jh7ft 1/1 Running 7 (55m ago) 23h
xray-daemon-rtlhh 1/1 Running 8 (55m ago) 23h
```
Kubernetes replaces the deleted `petsite-deployment` Pod within seconds, demonstrating built-in self-healing.
***
## 2. Validate Application Availability & RUM Metrics
Next, confirm the application UI loads without errors and that RUM data in CloudWatch shows no spike in errors or user frustration signals.
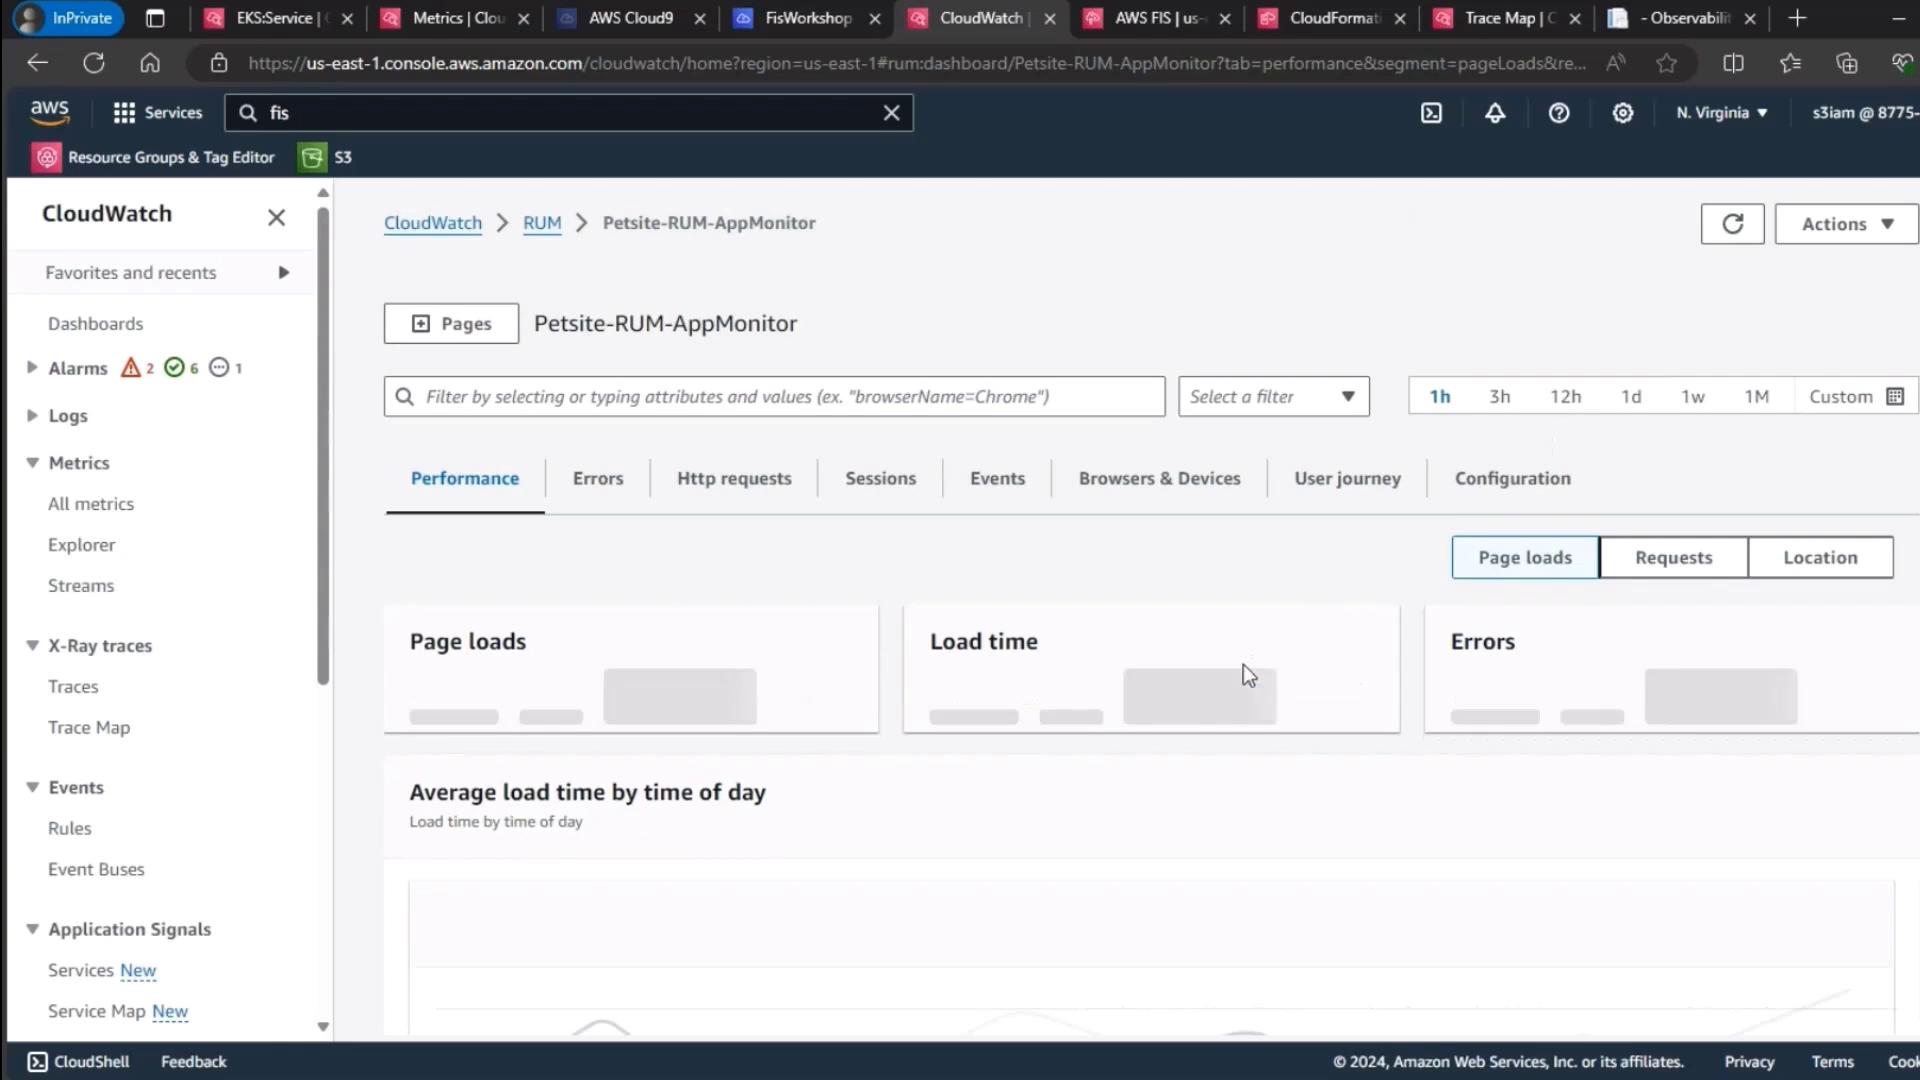
| Metric | Use Case | Observation |
| ---------- | ---------------------- | ------------------ |
| Page Loads | Track user visits | Stable |
| Load Time | Measure responsiveness | Within SLA |
| Errors | Detect failures | No spikes detected |
A manual refresh confirms that user frustration signals remain at baseline:
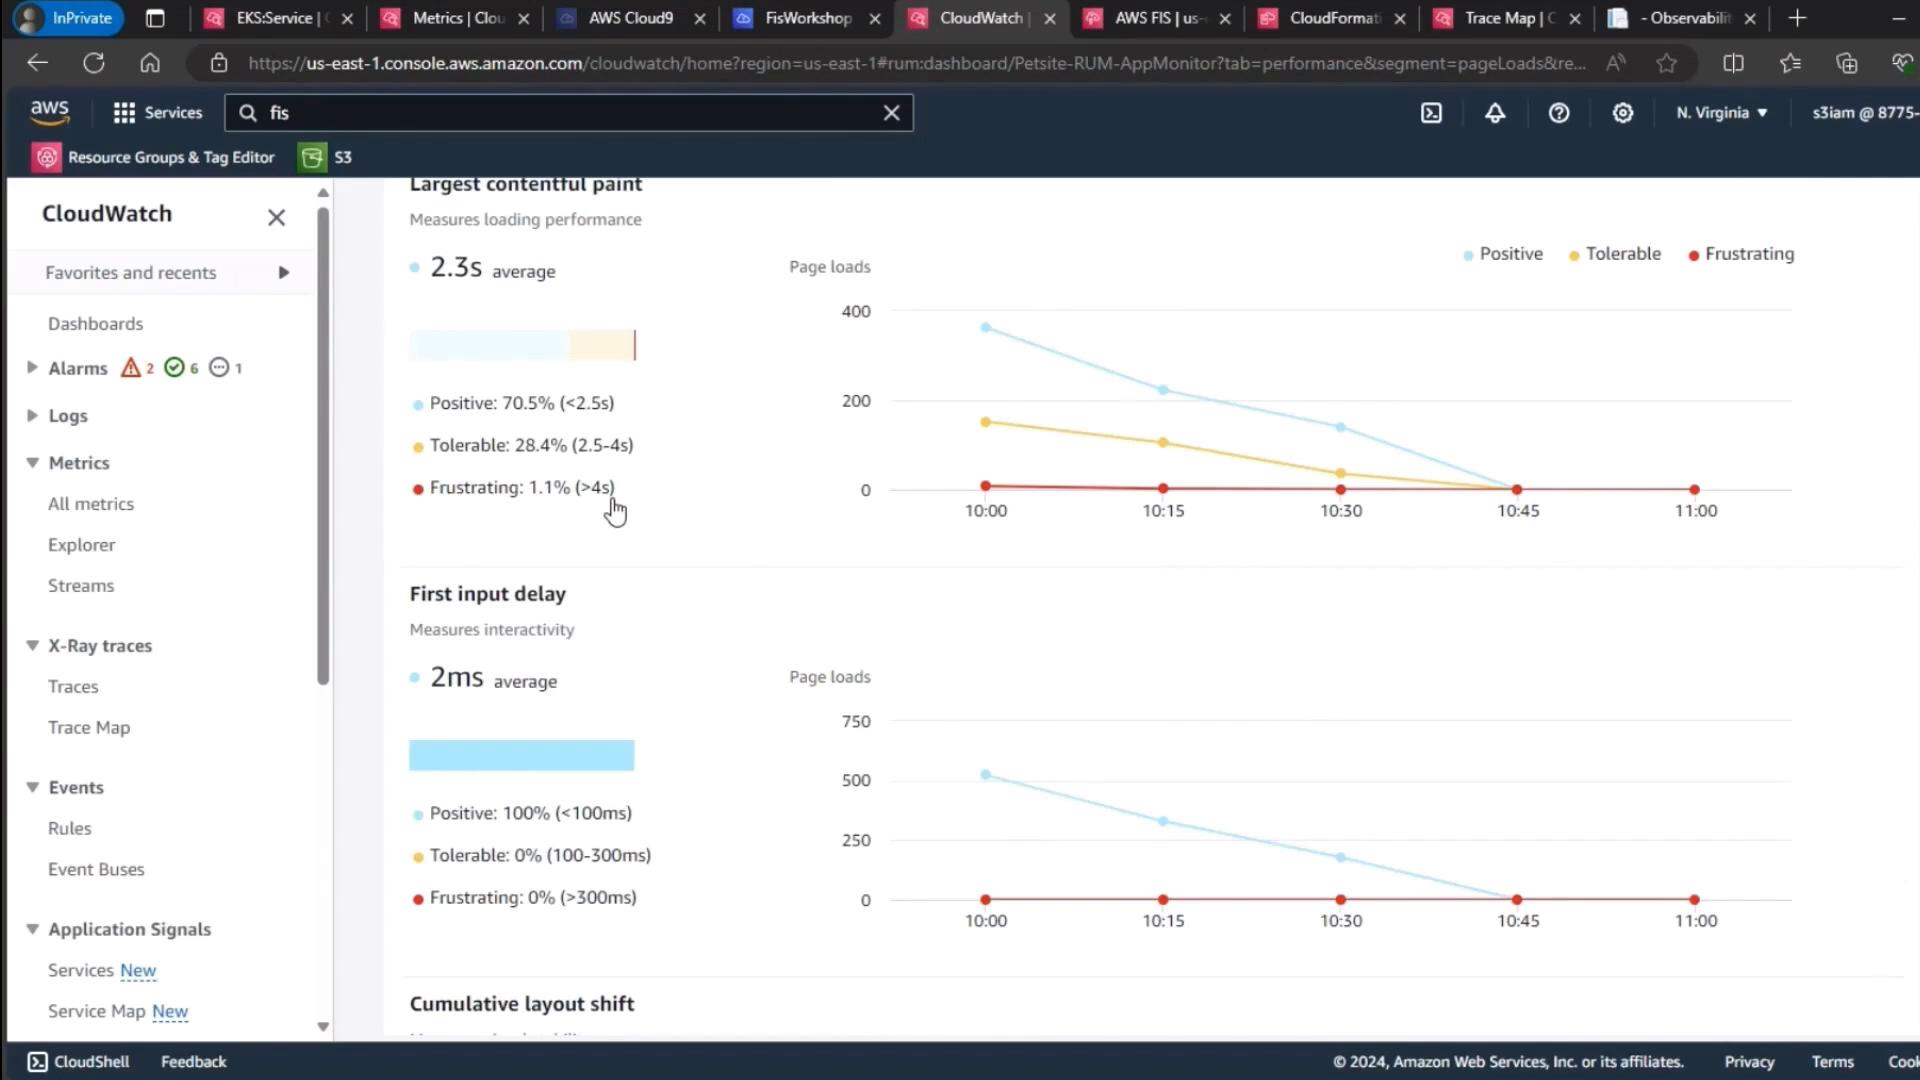
| Performance Metric | Threshold (ms) | Level |
| ------------------------ | -------------: | --------- |
| Largest Contentful Paint | \< 2500 | Positive |
| First Input Delay | \< 100 | Tolerable |
***
## 3. Monitor EKS Control Plane Metrics
Finally, review your EKS cluster’s control plane metrics to ensure resource utilization stayed consistent throughout the experiment.
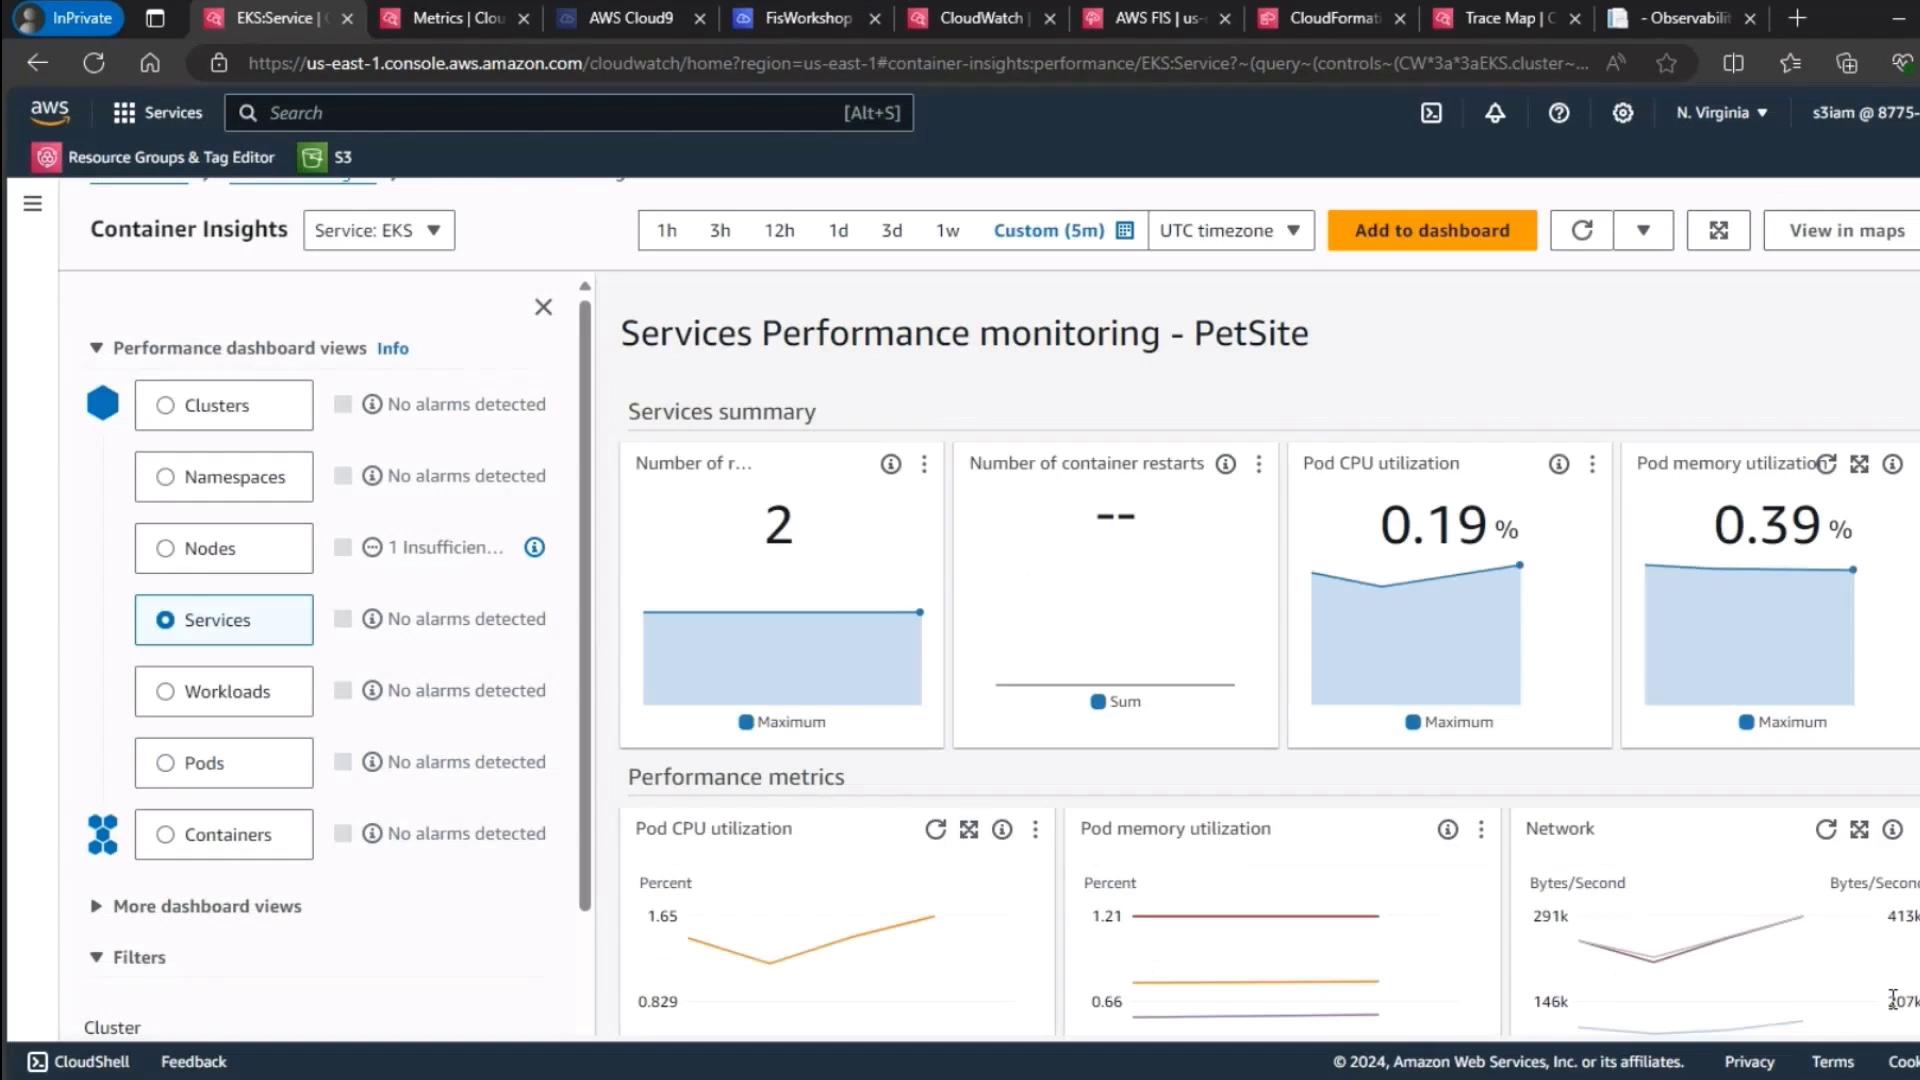
| Metric | Description | Observation |
| ------------------ | ---------------------------------------- | -------------- |
| CPU Utilization | Aggregate Pod CPU usage | Stable (\~30%) |
| Memory Utilization | Aggregate Pod memory usage | Stable (\~40%) |
| Running Pods | Total active Pods in `default` namespace | Consistent |
Stable control plane metrics confirm that pod deletion did not adversely affect cluster health.
***
## Conclusion
This demo highlights Kubernetes’ resilience on Amazon EKS:
* **Self-healing:** Deleted Pods are recreated almost instantly.
* **Zero user impact:** No UI errors or RUM spikes.
* **Stable cluster health:** Control plane metrics remain steady.
***
## Links and References
* [Kubernetes Self-Healing](https://kubernetes.io/docs/concepts/workloads/pods/pod-lifecycle/#pod-health)
* [Amazon EKS Overview](https://docs.aws.amazon.com/eks/latest/userguide/what-is-eks.html)
* [CloudWatch RUM Documentation](https://docs.aws.amazon.com/AmazonCloudWatch/latest/monitoring/CloudWatch-RUM.html)