> ## Documentation Index
> Fetch the complete documentation index at: https://notes.kodekloud.com/llms.txt
> Use this file to discover all available pages before exploring further.
# Demo Steady State Pod Delete on EKS
> This article explains how to establish a steady state for an application on Amazon EKS before conducting a pod deletion experiment.
In this walkthrough, we collect baseline metrics to define the application’s steady state. This is essential before running an AWS Fault Injection Simulator (FIS) experiment to delete an EKS pod.
## 1. Observe Container Insights Performance
Begin by reviewing your Amazon EKS service metrics with CloudWatch Container Insights. Track these core indicators:
| Metric | Description |
| ---------------------- | ----------------------------------- |
| Running pod count | Number of pods currently in service |
| Pod CPU utilization | CPU usage per pod |
| Pod memory utilization | Memory usage per pod |
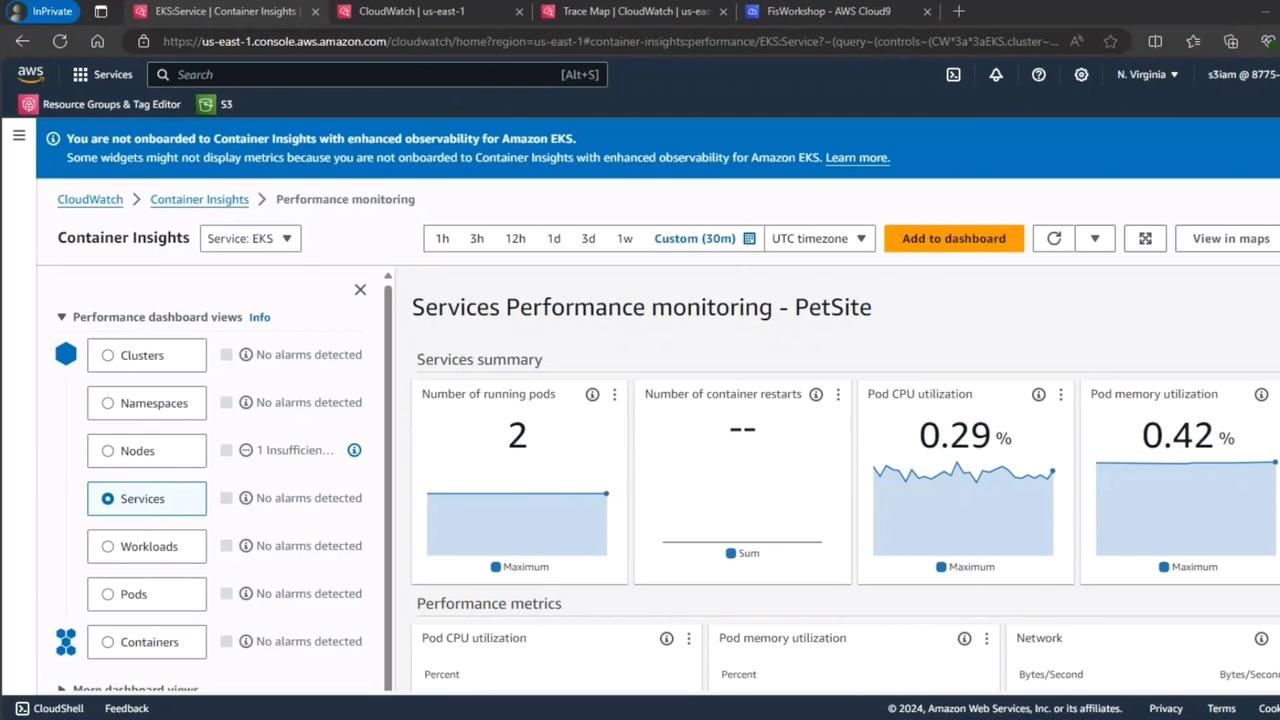
These charts represent the steady state of the `PetSite` service under normal conditions.
## 2. Verify End-User Experience with CloudWatch RUM
Next, validate real user metrics using CloudWatch RUM. This helps you understand page load performance and client-side errors:
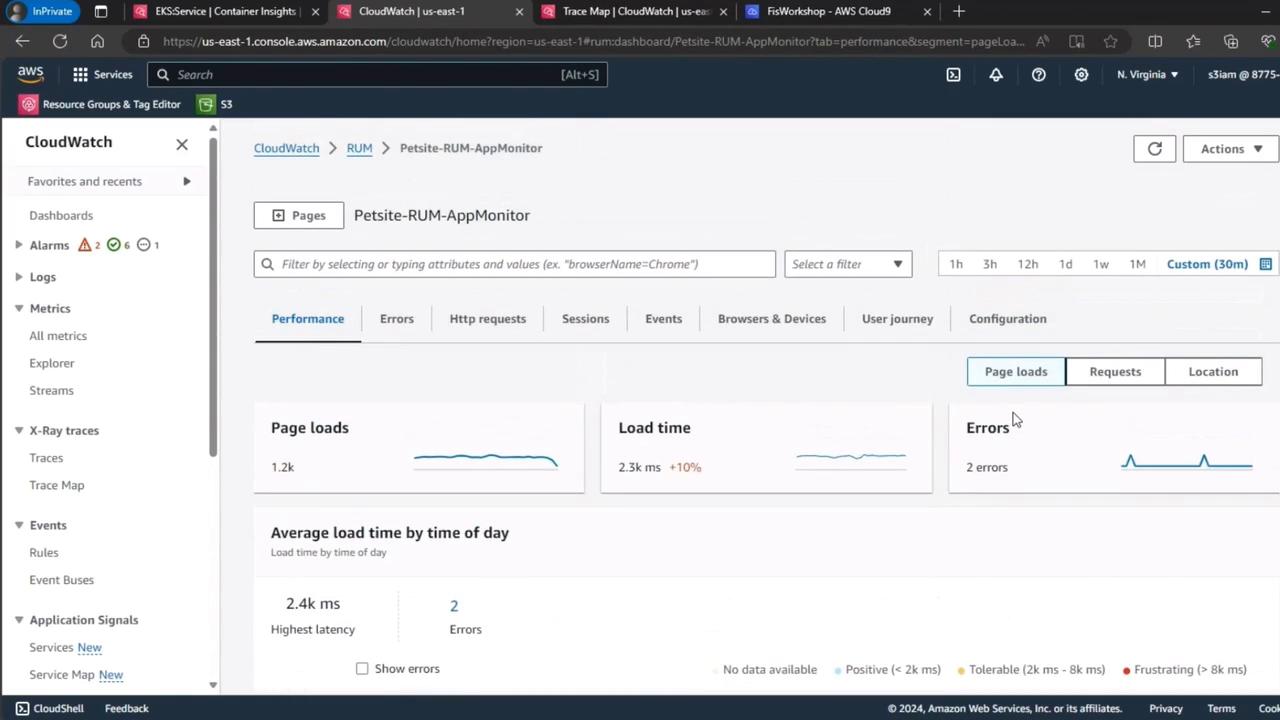
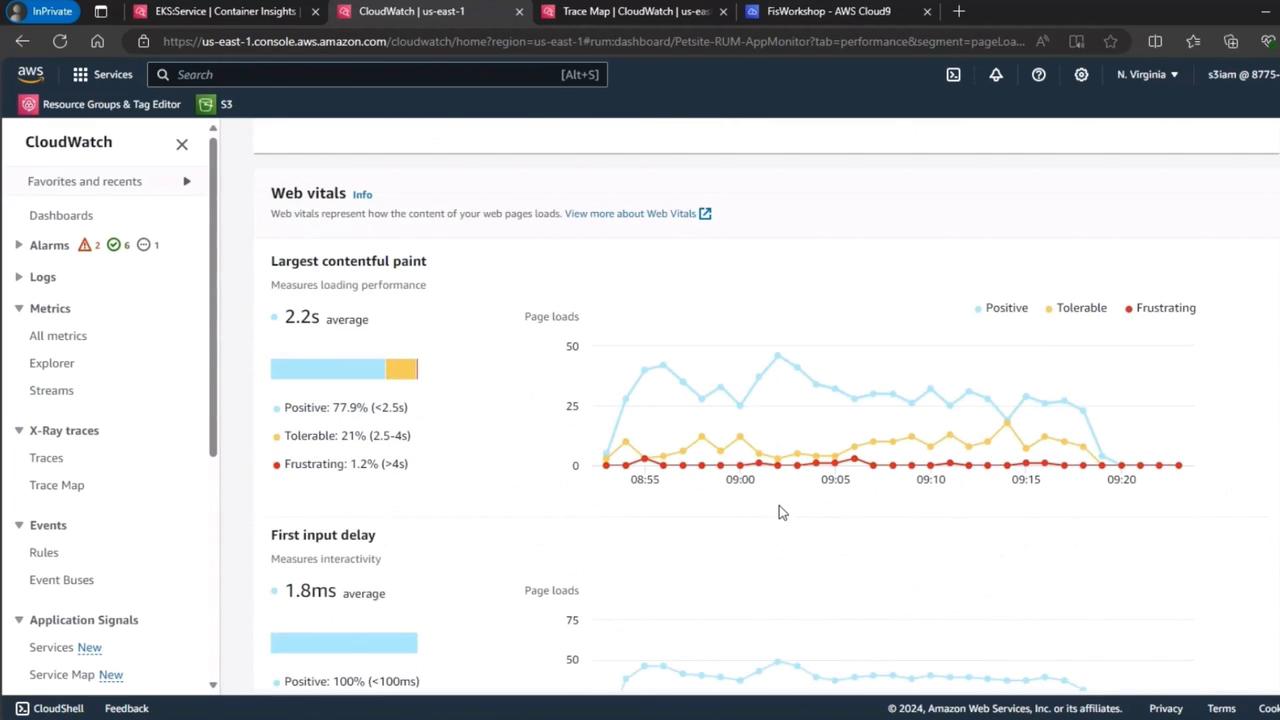
Then, examine key web vitals like Largest Contentful Paint (LCP) and First Input Delay (FID):
## 3. Simulate Load with k6
Generate realistic user traffic using k6 to ensure the baseline reflects production behavior. For example:
```bash theme={null}
k6 run script.js --vus 4 --duration 1h
```
During the test, you might see output like:
```bash theme={null}
running (@48m32.0s), 1/4 VUs, 1783 complete and 3 interrupted iterations
browser X [ 69% ] 4 VUs @48m05.4s/1h4m59s
```
Approximately 1% of virtual users experienced frustration, while the rest saw positive load times.
## 4. Inspect Distributed Tracing with CloudWatch Trace Map
Capture end-to-end request performance for the `petlistadoptions` endpoint on EKS Fargate:
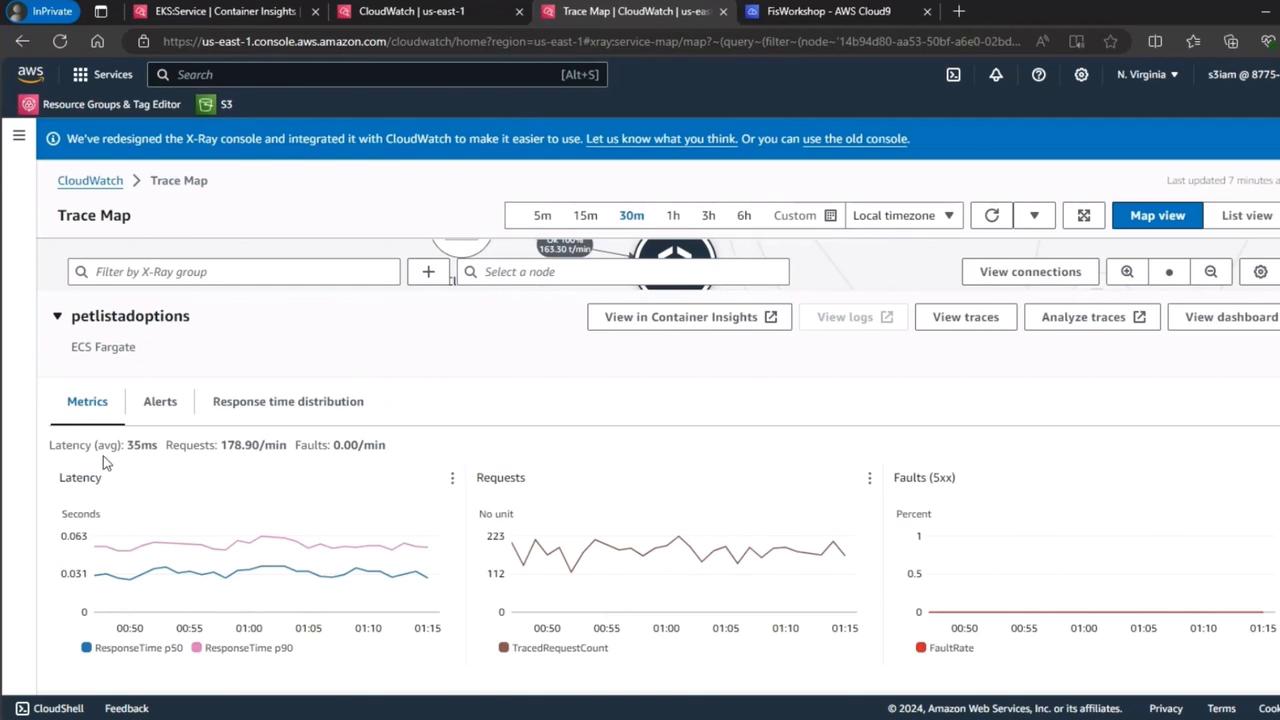
Analyze latency, throughput, and error rates to solidify your steady state baseline.
***
## References
* [AWS Fault Injection Simulator (FIS)](https://aws.amazon.com/fis/)
* [Amazon EKS Documentation](https://docs.aws.amazon.com/eks/)
* [CloudWatch Container Insights Overview](https://docs.aws.amazon.com/AmazonCloudWatch/latest/monitoring/ContainerInsights.html)