> ## Documentation Index
> Fetch the complete documentation index at: https://notes.kodekloud.com/llms.txt
> Use this file to discover all available pages before exploring further.
# Demo Fargate After State and Learning and Improvements
> This article discusses simulating user traffic on an AWS Fargate application to analyze performance and resilience under load using monitoring tools.
In this exercise, we simulate real user traffic on an AWS Fargate–powered pet adoption application while a parallel I/O stress test runs. Leveraging AWS CloudWatch Real User Monitoring (RUM) and ECS service metrics, we’ll validate the application’s performance and resilience under load. This aligns with Chaos Engineering principles to uncover potential bottlenecks before they impact production.
***
## 1. Generating Adoption Traffic
To emulate real-world user interactions, we’ll place multiple pet adoption orders:
1. Navigate to the pet adoption page.
2. Select pets and complete the adoption form.
3. Refresh the listing to confirm adoption status.
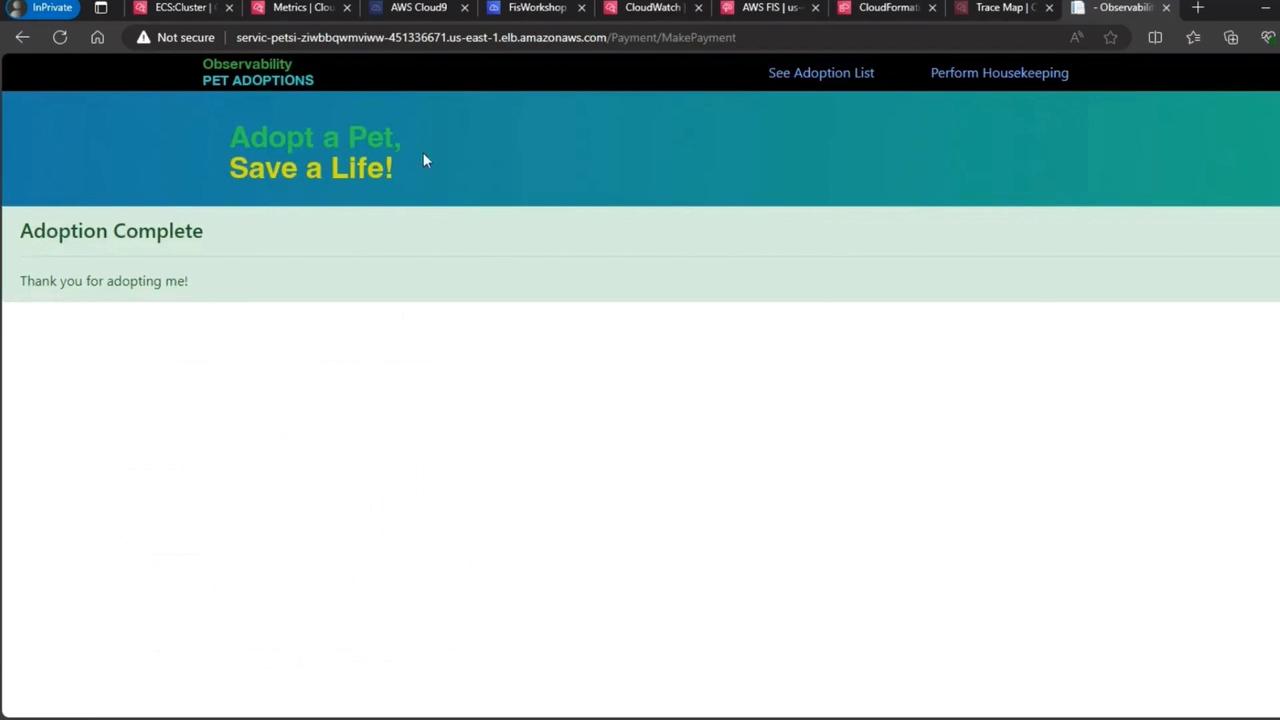
Throughout this process, the UI remained fully responsive, and no errors or delays were observed.
Generating concurrent adoption events helps ensure your application can handle spikes in user requests without degradation.
***
## 2. Monitoring Real User Metrics (RUM)
Next, we’ll inspect the CloudWatch RUM dashboard over the last ten minutes to detect any user frustration signals:
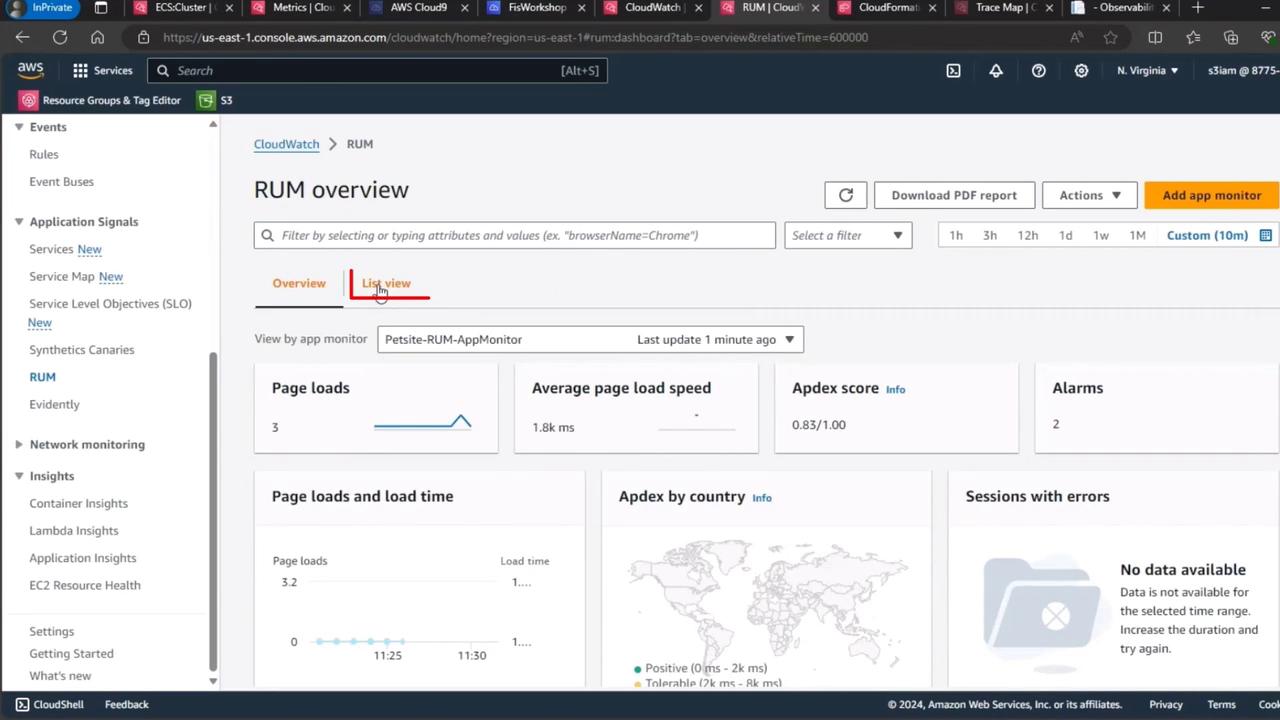
| Metric | Value | Threshold |
| ------------------- | ----- | --------- |
| Page Loads | 1,200 | N/A |
| Avg Page Load (ms) | 320 | \< 500 ms |
| Apdex Score | 0.98 | ≥ 0.85 |
| Frustrated Sessions | 0 | 0 |
An Apdex score above 0.85 and zero frustrated sessions confirm a smooth user experience. For more details, see the [CloudWatch RUM User Guide](https://docs.aws.amazon.com/AmazonCloudWatch/latest/monitoring/CloudWatch-RUM.html).
***
## 3. Inspecting ECS Service Metrics
Finally, let’s review our ECS service dashboard for the `pay-for-adoption` task to observe CPU, memory, and network activity during the I/O stress period:

| Metric | Baseline (%) | Under Stress (%) | Threshold (%) |
| ------------------ | ------------ | ---------------- | ------------- |
| CPU Utilization | 25 | 18 | \< 80 |
| Memory Utilization | 30 | 22 | \< 75 |
| Network In (MB/s) | 5 | 7 | N/A |
| Network Out (MB/s) | 4 | 6 | N/A |
Keep an eye on sustained CPU and memory drops—they may indicate resource throttling or misconfiguration in your task definition.
***
## Conclusion
Our AWS Fargate service demonstrated robust performance under concurrent I/O stress and real user load. No critical spikes or resource exhaustion occurred, confirming that the application design scales reliably.
## Links and References
* [AWS Fargate Documentation](https://docs.aws.amazon.com/AmazonECS/latest/developerguide/AWS_Fargate.html)
* [CloudWatch RUM User Guide](https://docs.aws.amazon.com/AmazonCloudWatch/latest/monitoring/CloudWatch-RUM.html)
* [Chaos Engineering Best Practices](https://www.gremlin.com/chaos-engineering/)