> ## Documentation Index
> Fetch the complete documentation index at: https://notes.kodekloud.com/llms.txt
> Use this file to discover all available pages before exploring further.
# Establishing Steady State Metrics Using Cloudwatch RUMX Ray
> This article discusses using AWS tools to establish performance baselines for web applications before introducing faults.
After generating load against both the website and its containerized services, it’s essential to capture your baseline performance before introducing faults. AWS offers a suite of observability tools—CloudWatch RUM, Container Insights, and X-Ray—that together provide a complete view of front-end and back-end health.
## 1. Real User Monitoring (RUM)
CloudWatch RUM collects key browser metrics from actual users, helping you understand page-load performance and interactivity. We’ve enabled RUM on our homepage; let’s examine the dashboards.
Ensure RUM is configured on all critical user flows to gather representative web vitals.
| Metric | Description |
| ------------------------ | ------------------------------------------------------------------ |
| Largest Contentful Paint | Time to render the largest visible element (LCP) |
| First Input Delay | Delay before the page responds to the first user interaction (FID) |
| Page Load Success Rate | Percentage of page loads without errors |
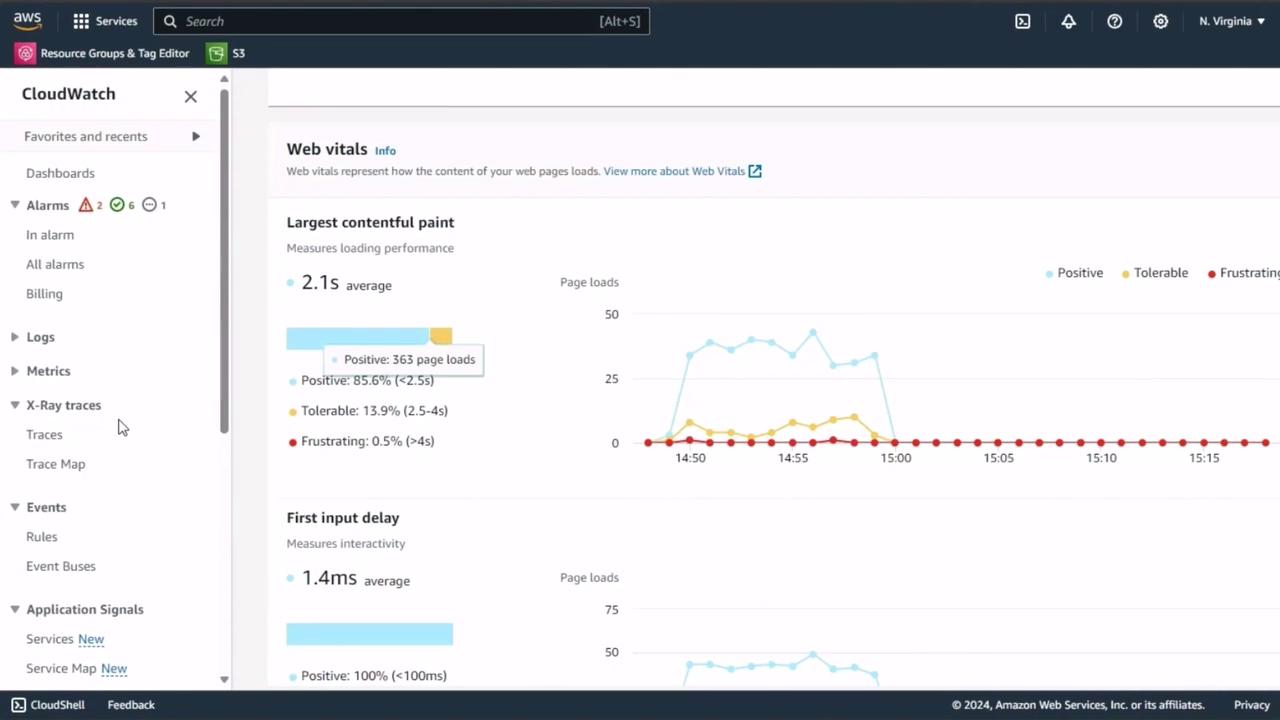
The **Web Vitals** dashboard tracks LCP and FID over time, showing how fast your pages load and respond for real users.
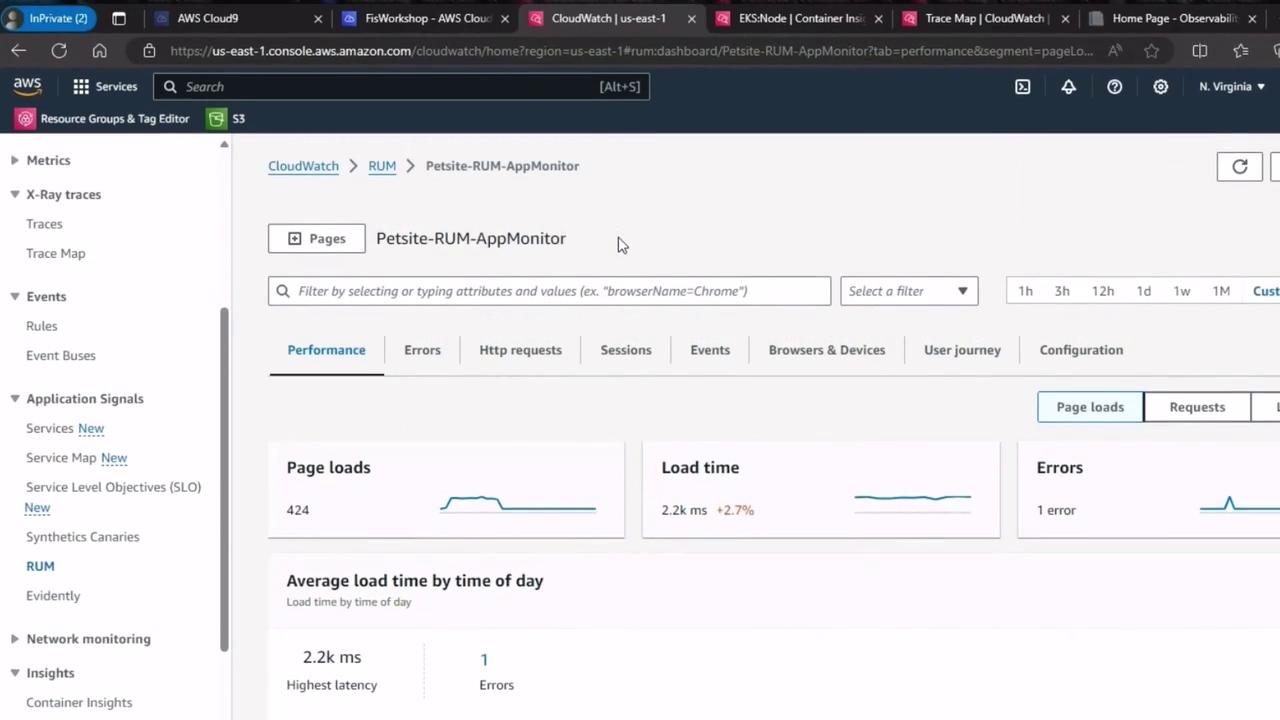
The **Performance Metrics** view details page loads, average load times, and error counts. With a \~85% success rate and minimal slow loads, this serves as our front-end baseline.
## 2. CloudWatch Container Insights for Amazon EKS
Switch to **Container Insights** in the CloudWatch console and select **EKS Performance Monitoring**. You can filter metrics by nodes, namespaces, pods, or containers.
| Component | Key Metrics |
| ---------- | ---------------------------------------- |
| Nodes | CPU utilization, Memory usage, Pod count |
| Namespaces | Request rate, Error rate, Throughput |
| Pods | Latency, Restart count, Health status |
| Containers | CPU/Memory limits, Network I/O |
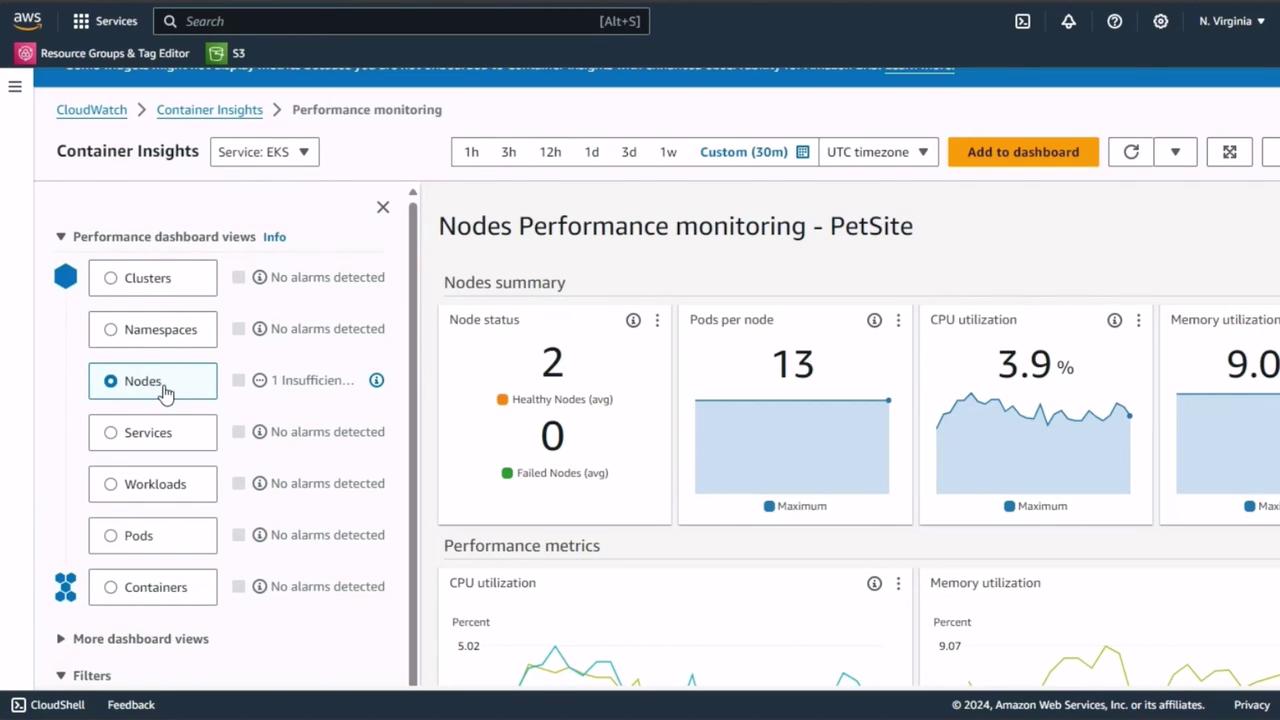
With these metrics, you establish a back-end baseline for cluster health, resource utilization, and workload distribution.
## 3. AWS X-Ray Trace Map
AWS X-Ray offers end-to-end request tracing across services such as EC2, Lambda, and API Gateway. Use the trace map to pinpoint latency hotspots and error sources.
Trace sampling needs to be set appropriately. Over-sampling can increase costs, while under-sampling may hide critical issues.
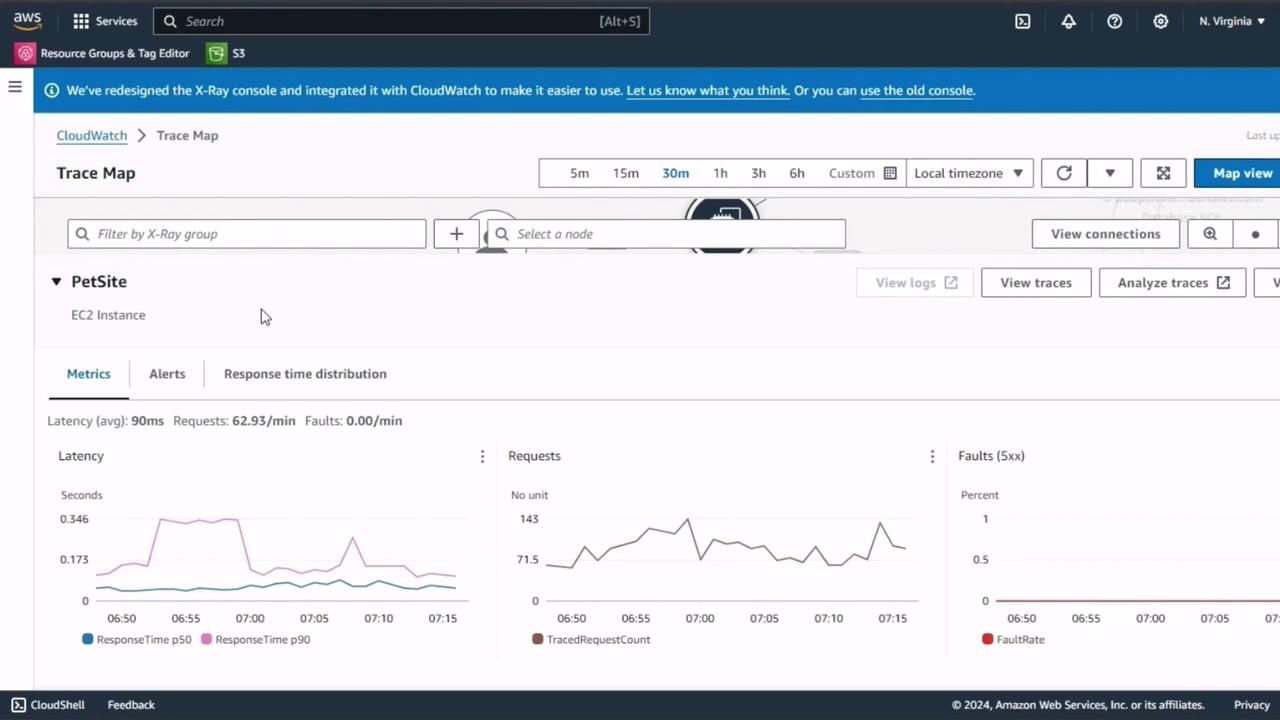
Drill down into individual segments—such as the client calling the PetSite EC2 instance—to view detailed latency, request, and fault counts.
***
By capturing steady-state metrics from CloudWatch RUM, Container Insights, and X-Ray, you’ll have a robust performance baseline. Use these figures to compare against results after injecting faults, ensuring you can accurately gauge the resilience and reliability of your application.
## Links and References
* [AWS CloudWatch RUM](https://docs.aws.amazon.com/AmazonCloudWatch/latest/monitoring/CloudWatch-RUM.html)
* [Container Insights in CloudWatch](https://docs.aws.amazon.com/AmazonCloudWatch/latest/monitoring/ContainerInsights.html)
* [AWS X-Ray Developer Guide](https://docs.aws.amazon.com/xray/latest/devguide/aws-xray.html)
* [Chaos Engineering on AWS](https://aws.amazon.com/chaos-engineering/)