In this tutorial, you’ll learn how to connect Power BI Desktop to an Azure SQL Database, import data, and build a simple report that shows distinct product counts by country/region.Documentation Index
Fetch the complete documentation index at: https://notes.kodekloud.com/llms.txt
Use this file to discover all available pages before exploring further.
Prerequisites
Before you begin, make sure you have the following:| Resource | Purpose | Link/Notes |
|---|---|---|
| Azure SQL Database | Holds your sample data (e.g., AdventureWorks) | Deploy via Azure Portal or Azure CLI |
| Sample Data (AdventureWorks) | Demo dataset for sales and customer info | https://github.com/microsoft/sql-server-samples/tree/master/samples/databases/adventure-works |
| Power BI Desktop | Authoring tool for reports and visualizations | Download from Microsoft Store or Microsoft Download Center |

1. Set Up Your Azure SQL Database
- Provision an Azure SQL Database in the Azure Portal.
- Use the built-in wizard to import the AdventureWorks sample database.
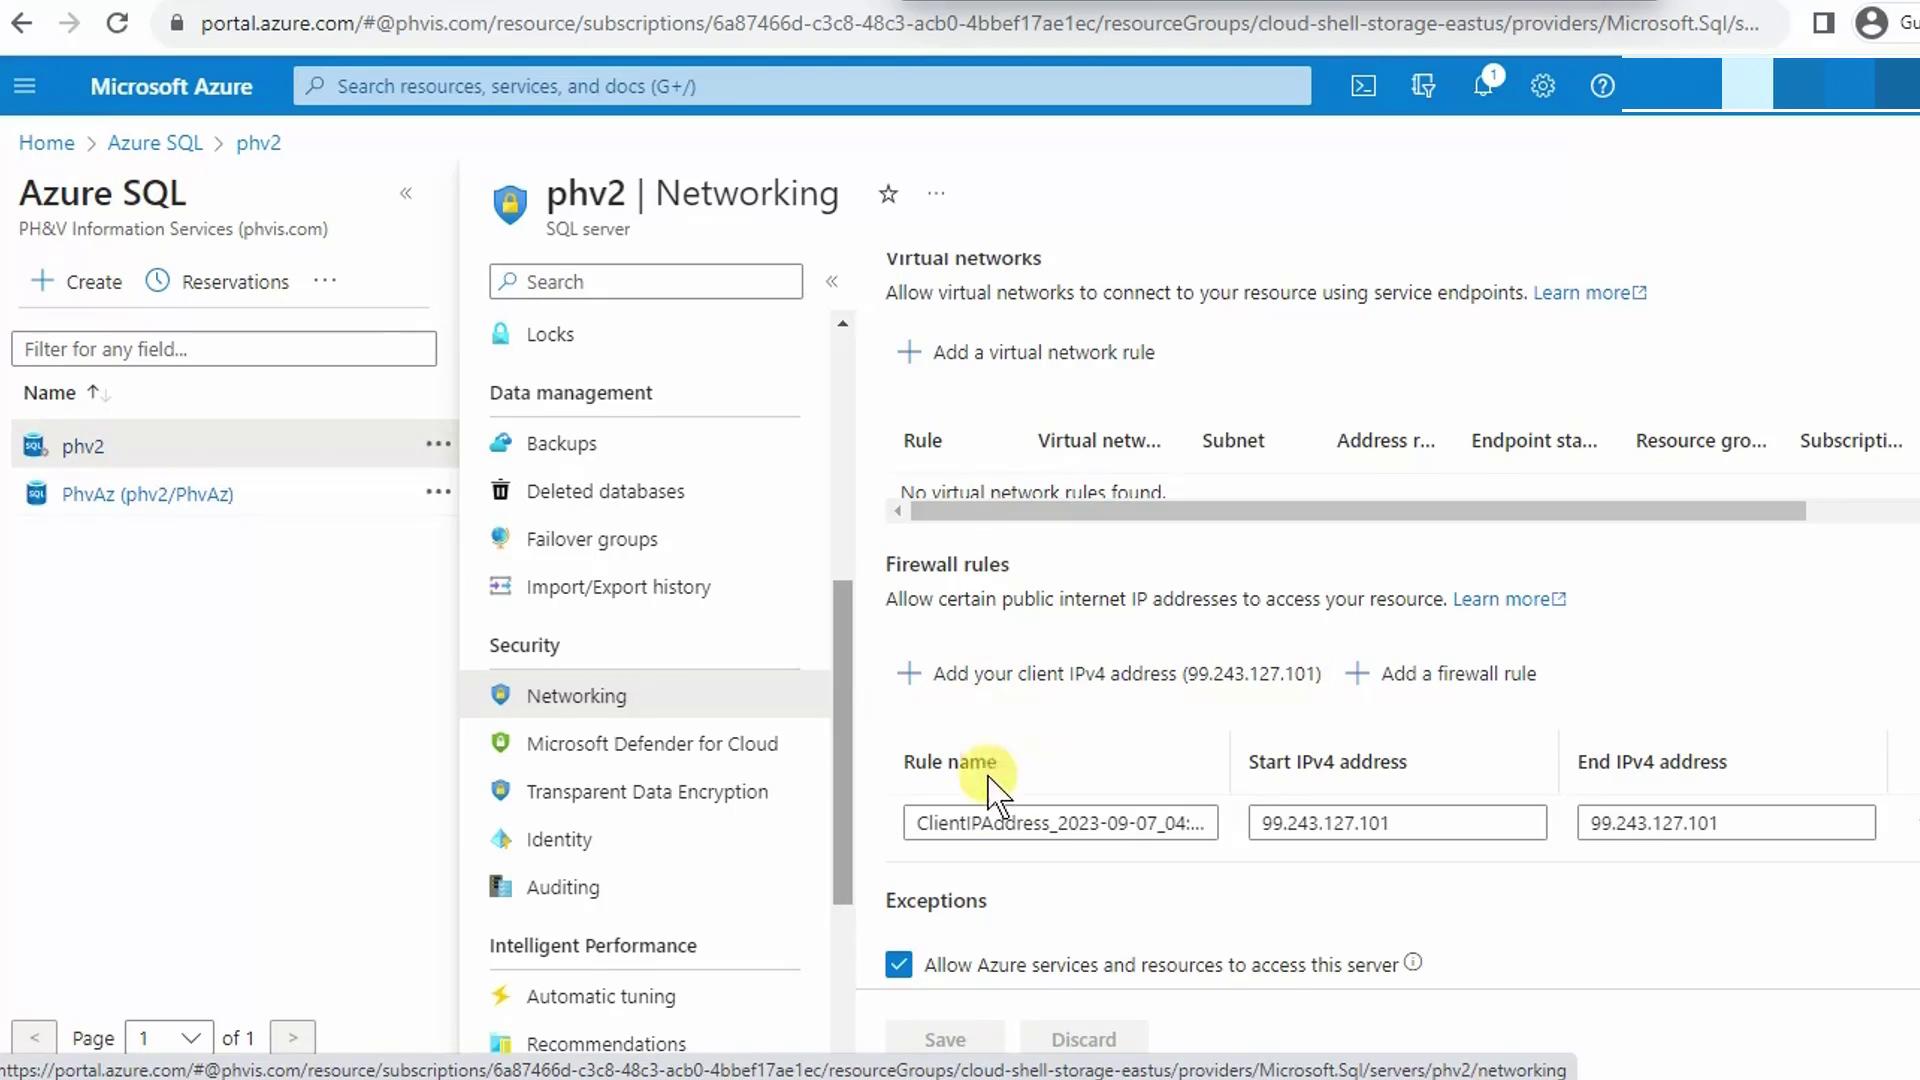
Configure the Server Firewall
Your client IP must be allowed through the SQL Server firewall before Power BI can connect.
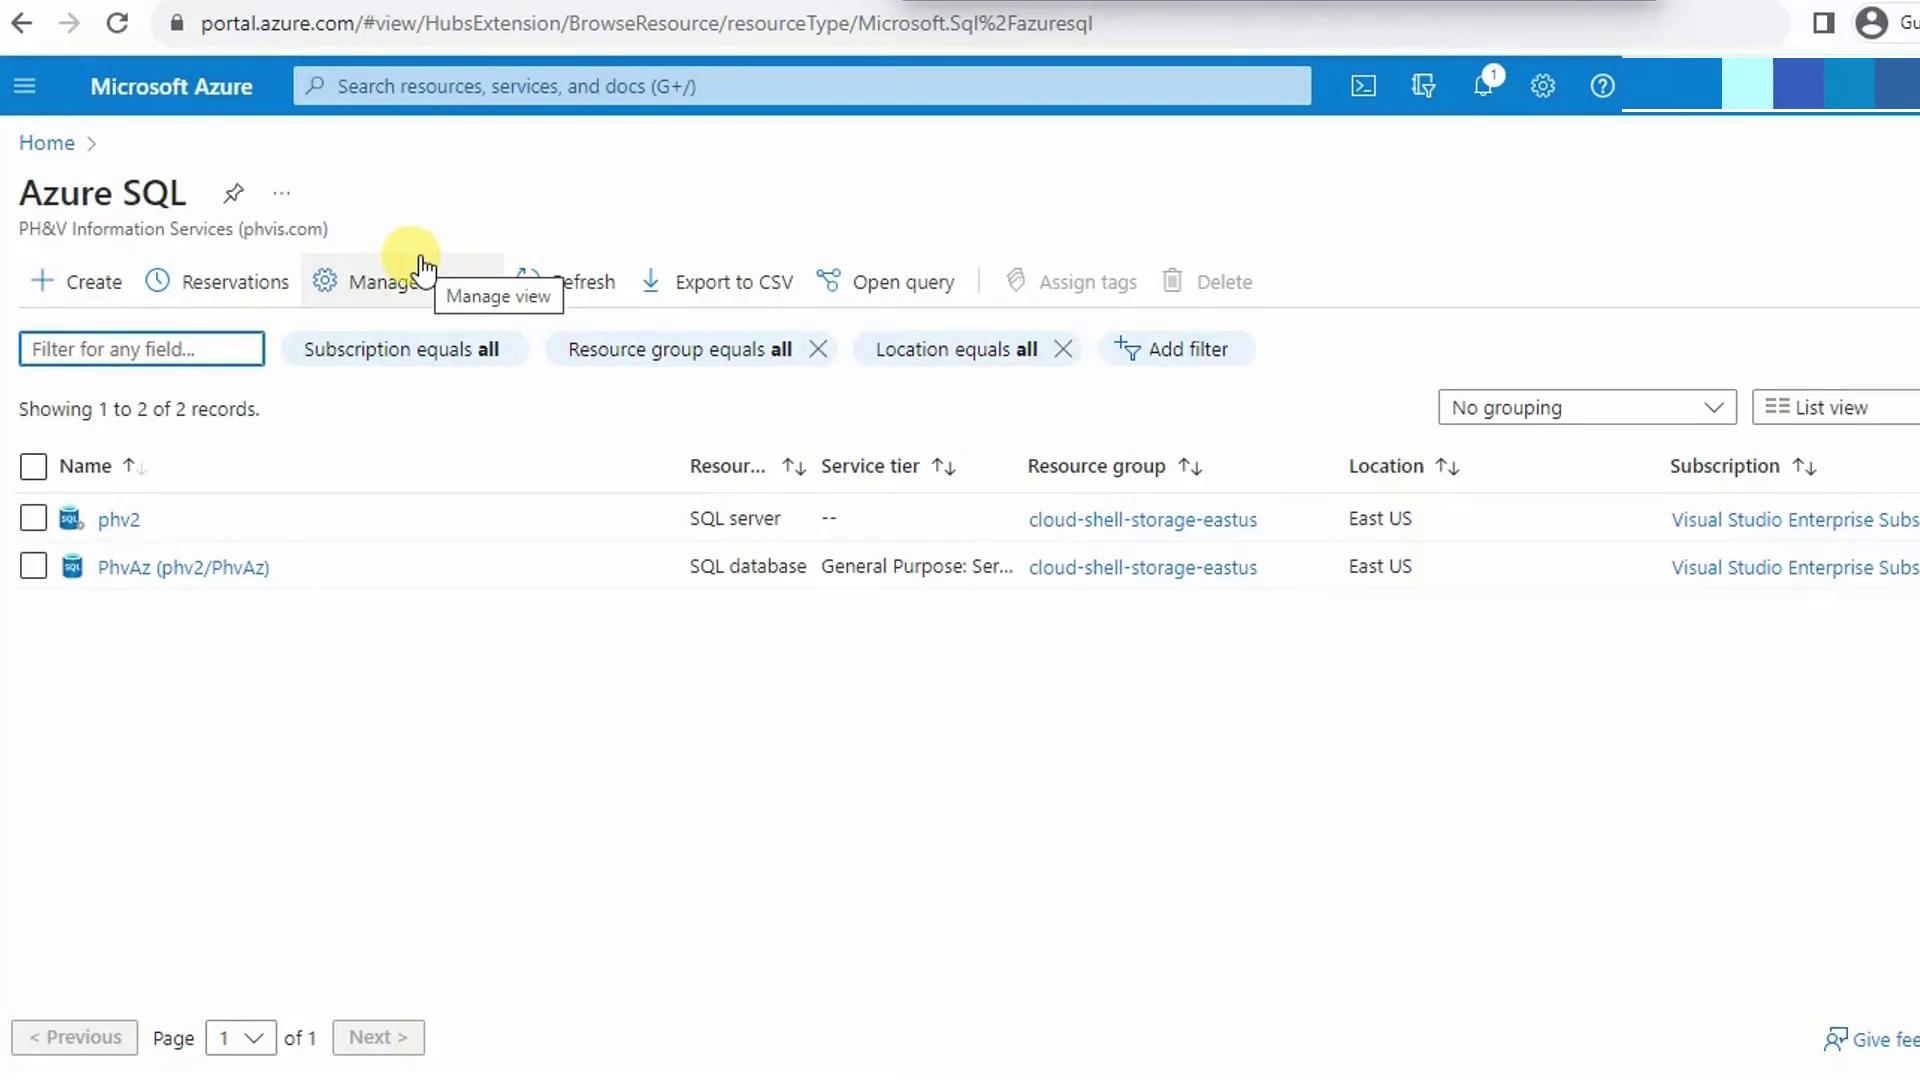
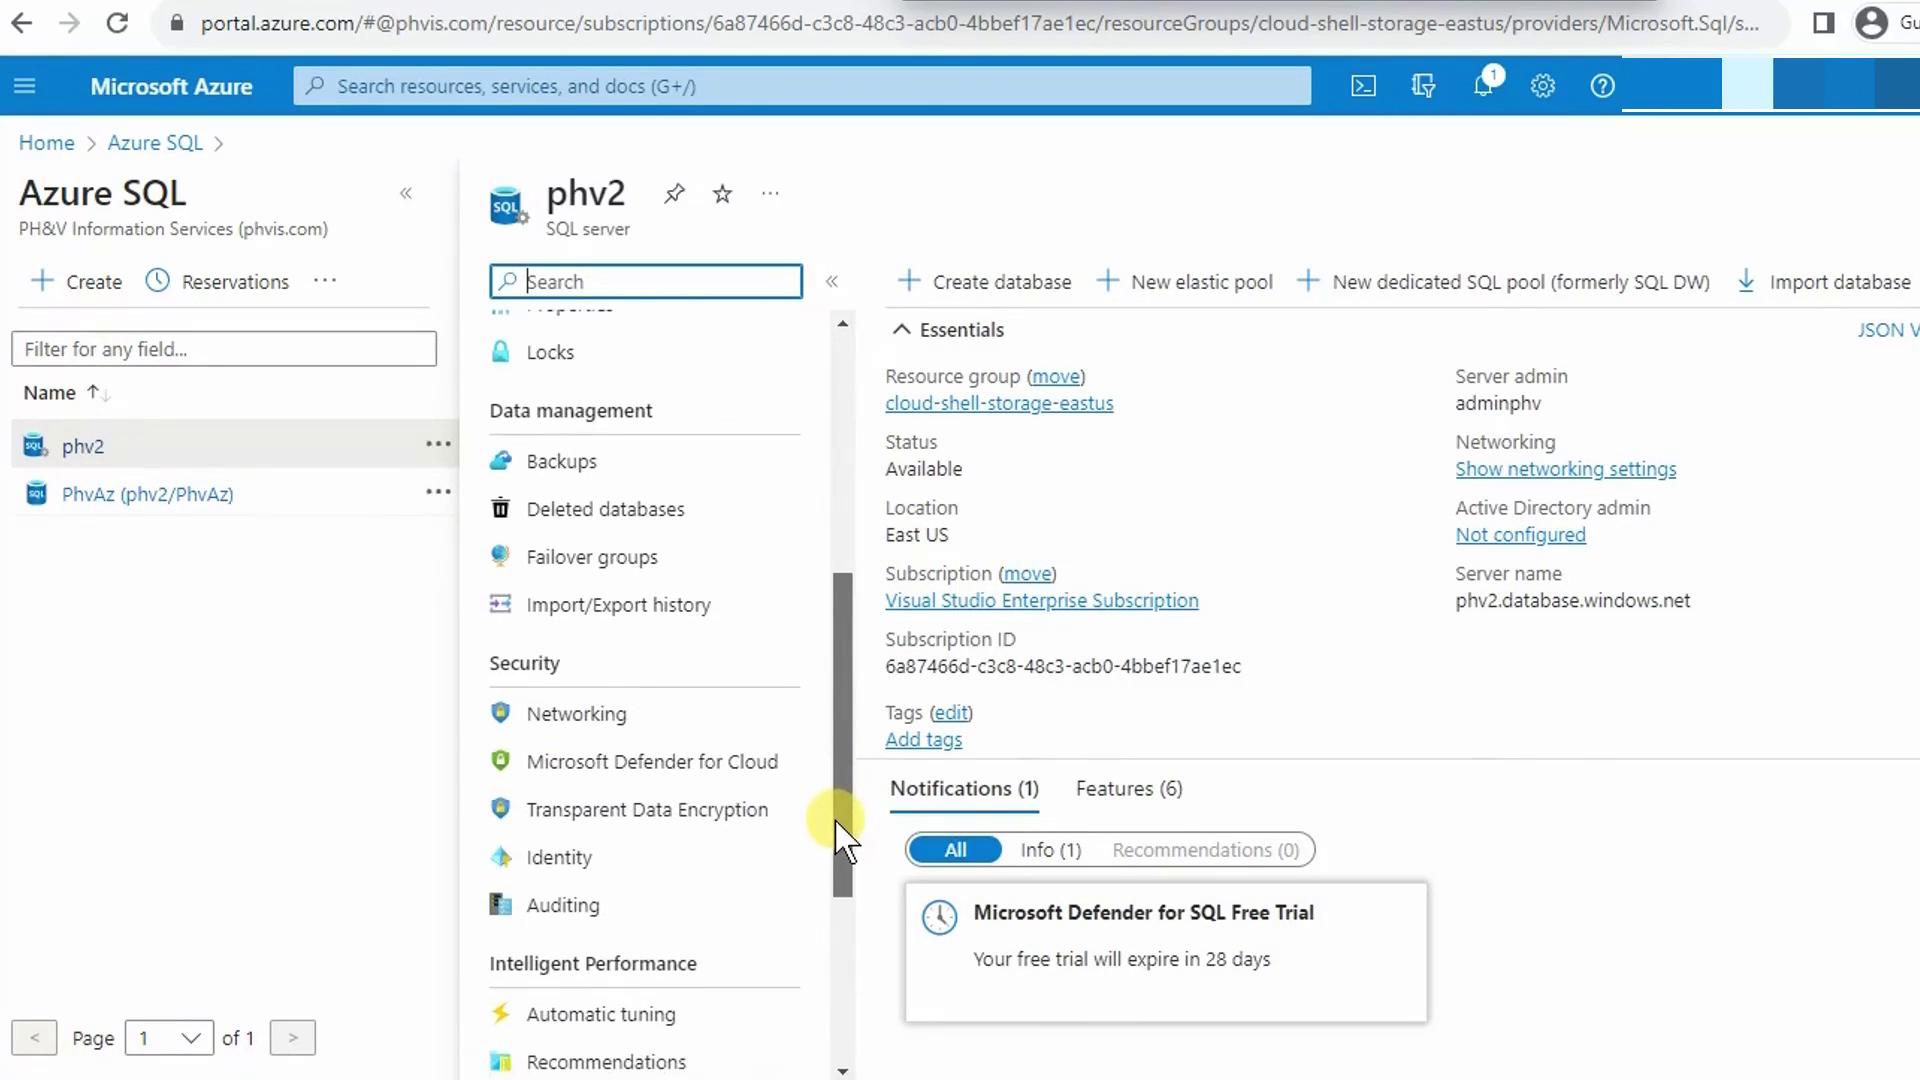
- In the Azure Portal, go to your SQL server.
- Under Networking, click + Add client IP to whitelist your current address.
2. Install Power BI Desktop
Power BI Desktop is free and provides full report-authoring capabilities.If you don’t have it installed already, download Power BI Desktop for Windows or try the Power BI service in your browser.
3. Connect Power BI to Azure SQL Database
- Open Power BI Desktop.
- On the Home ribbon, select Get Data → More….
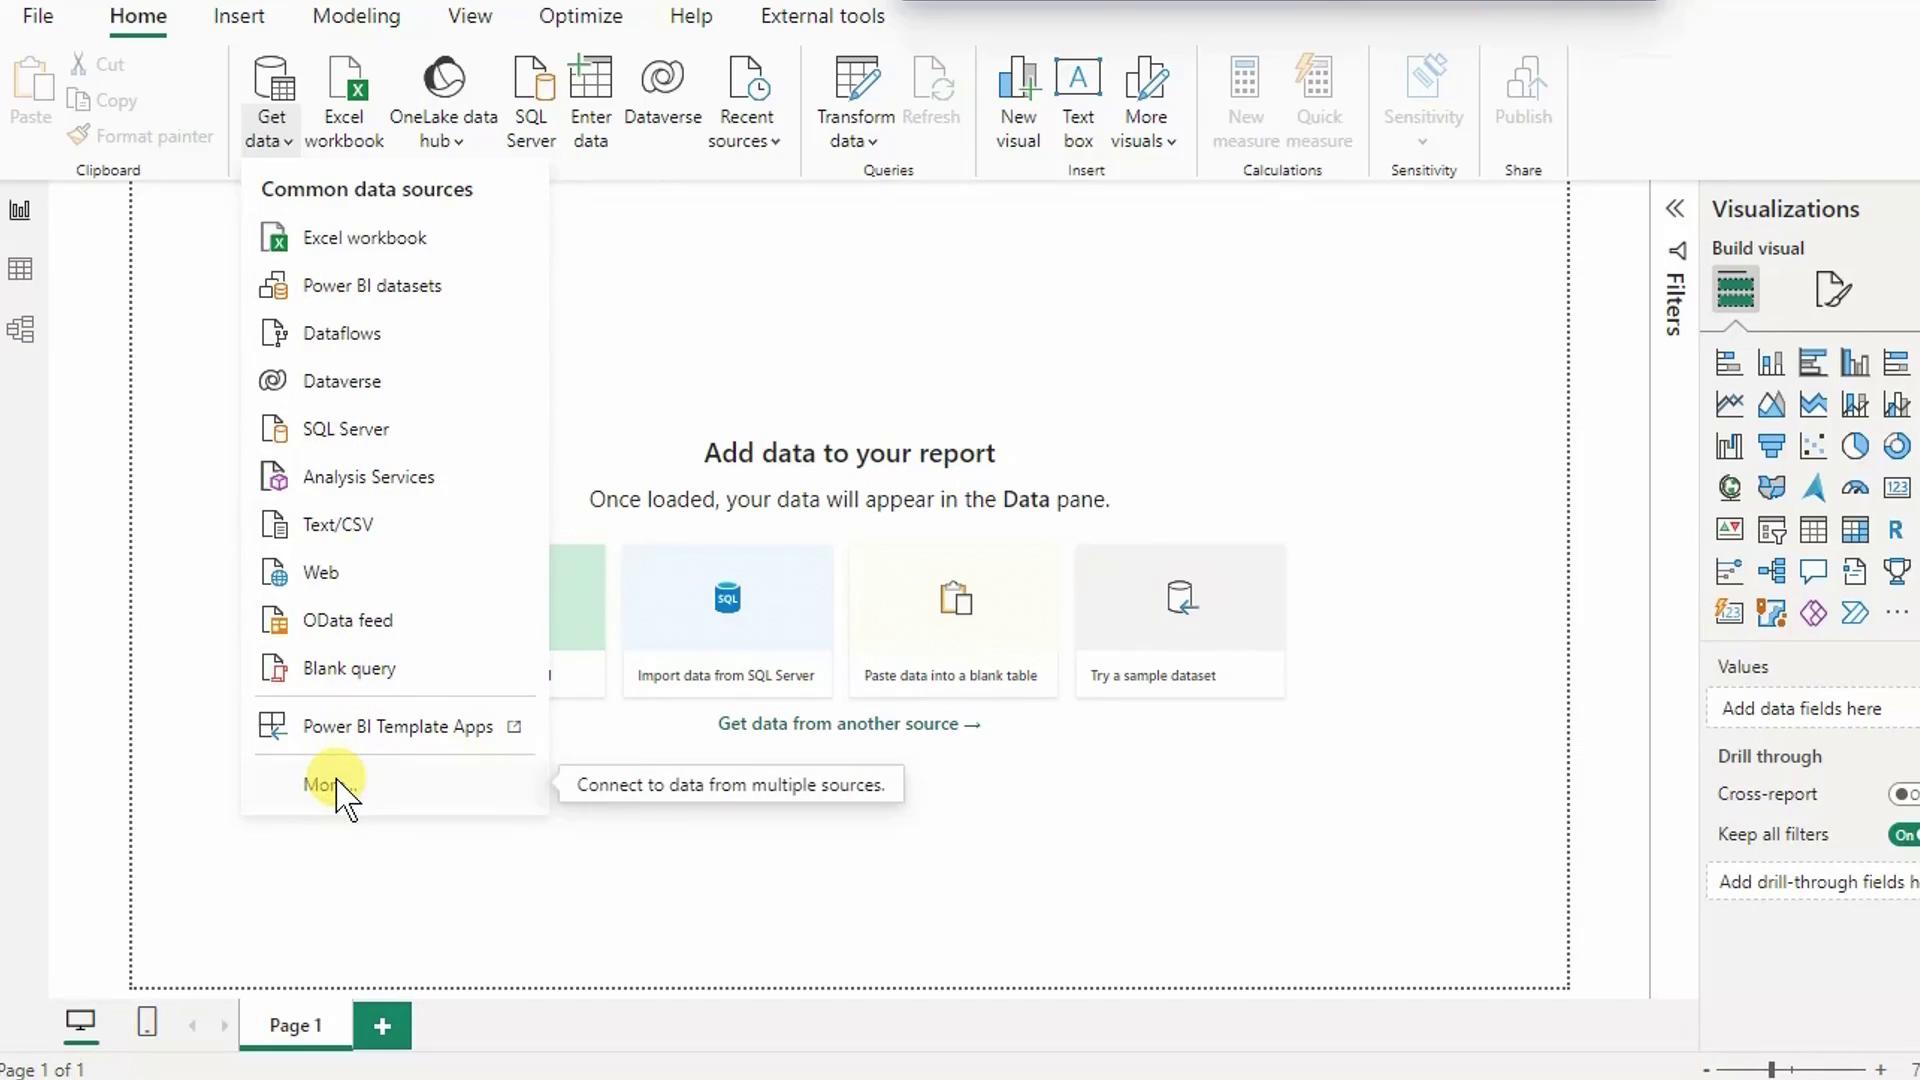
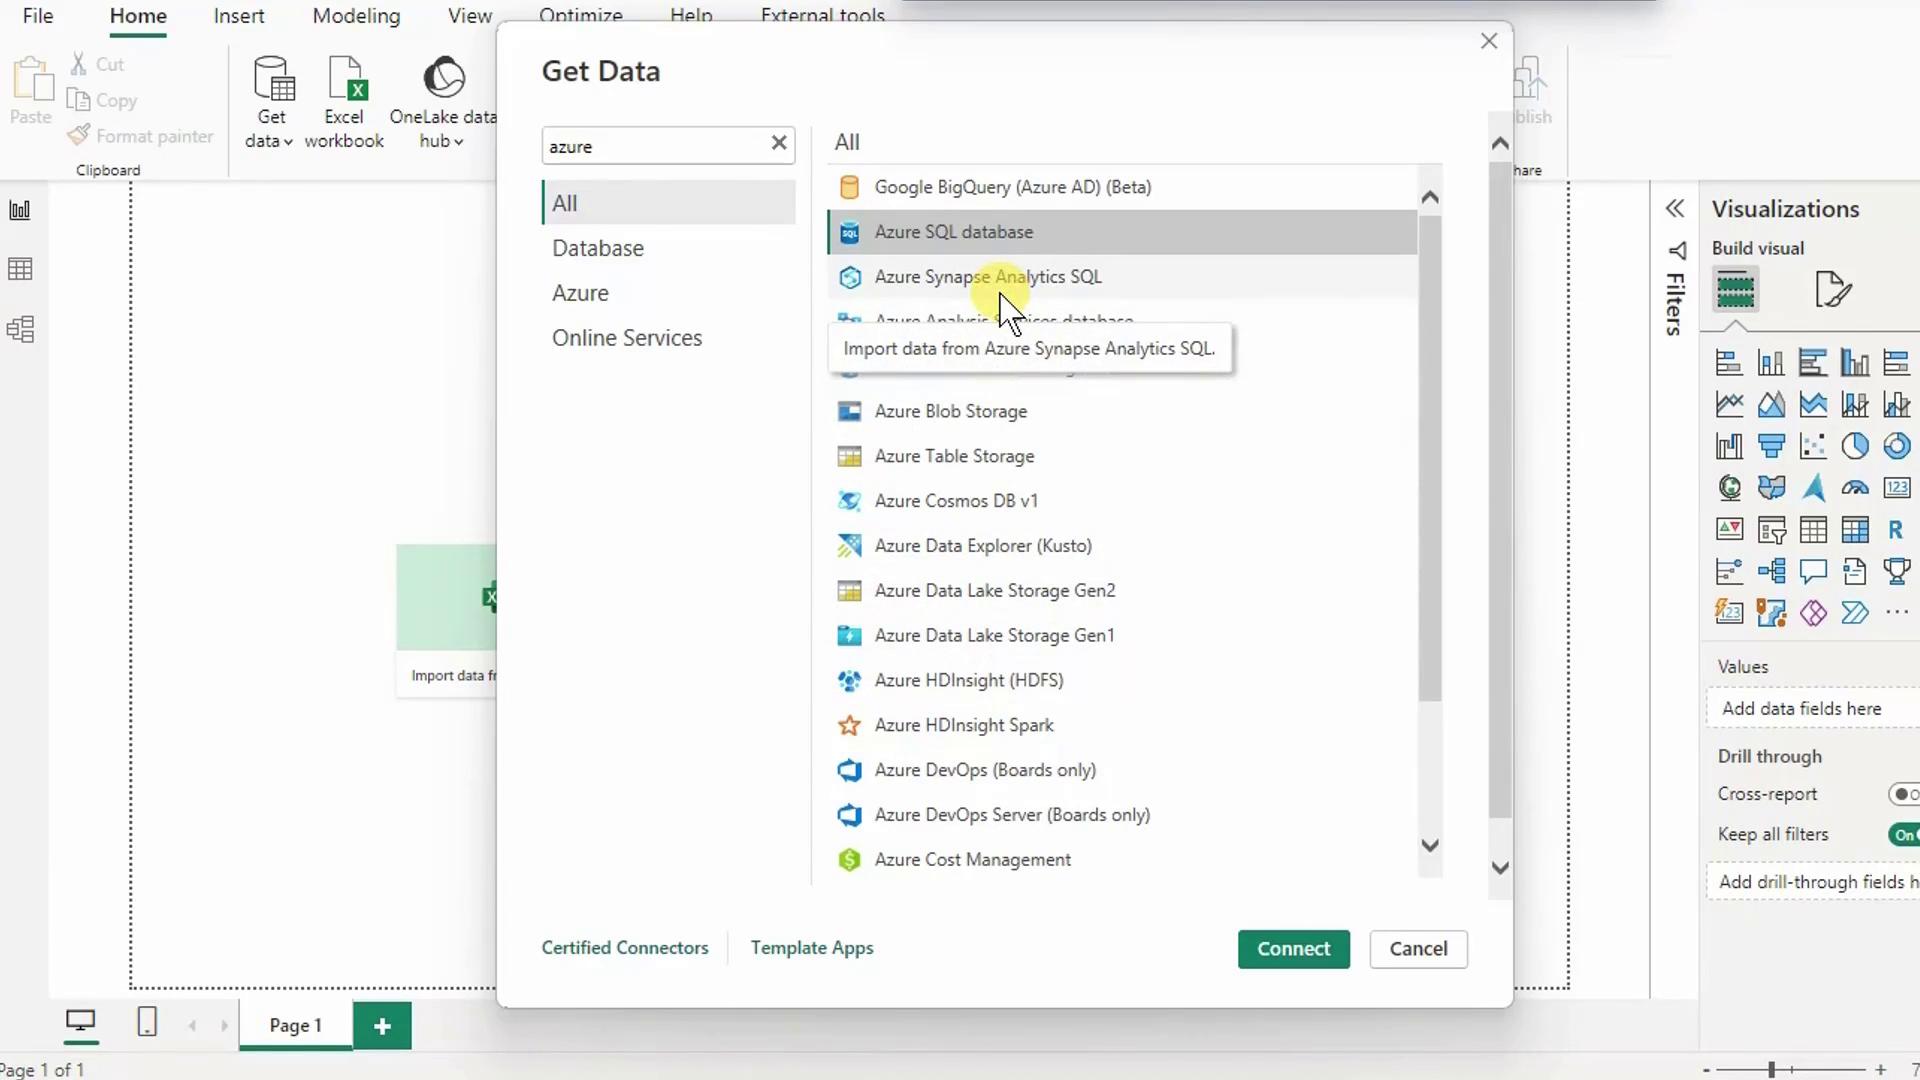
- In the Get Data dialog, search for Azure SQL Database and click Connect.
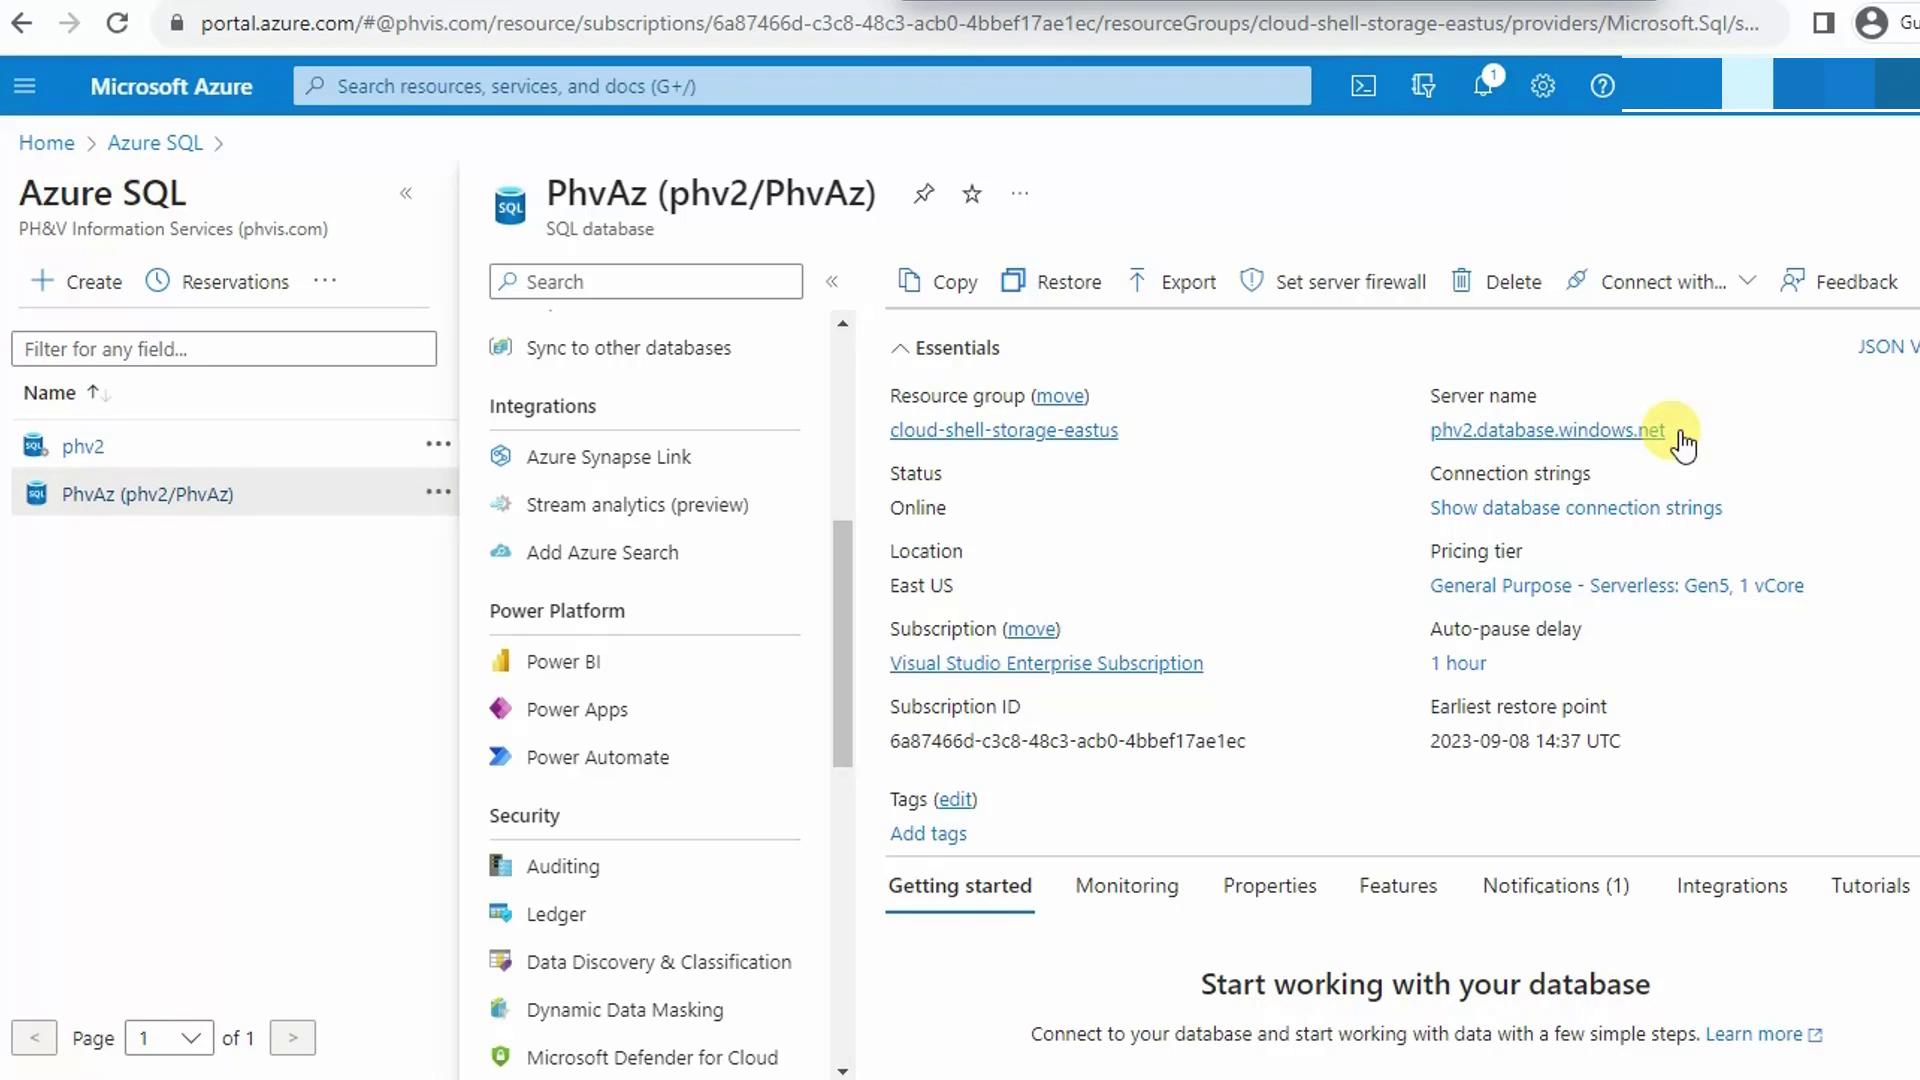
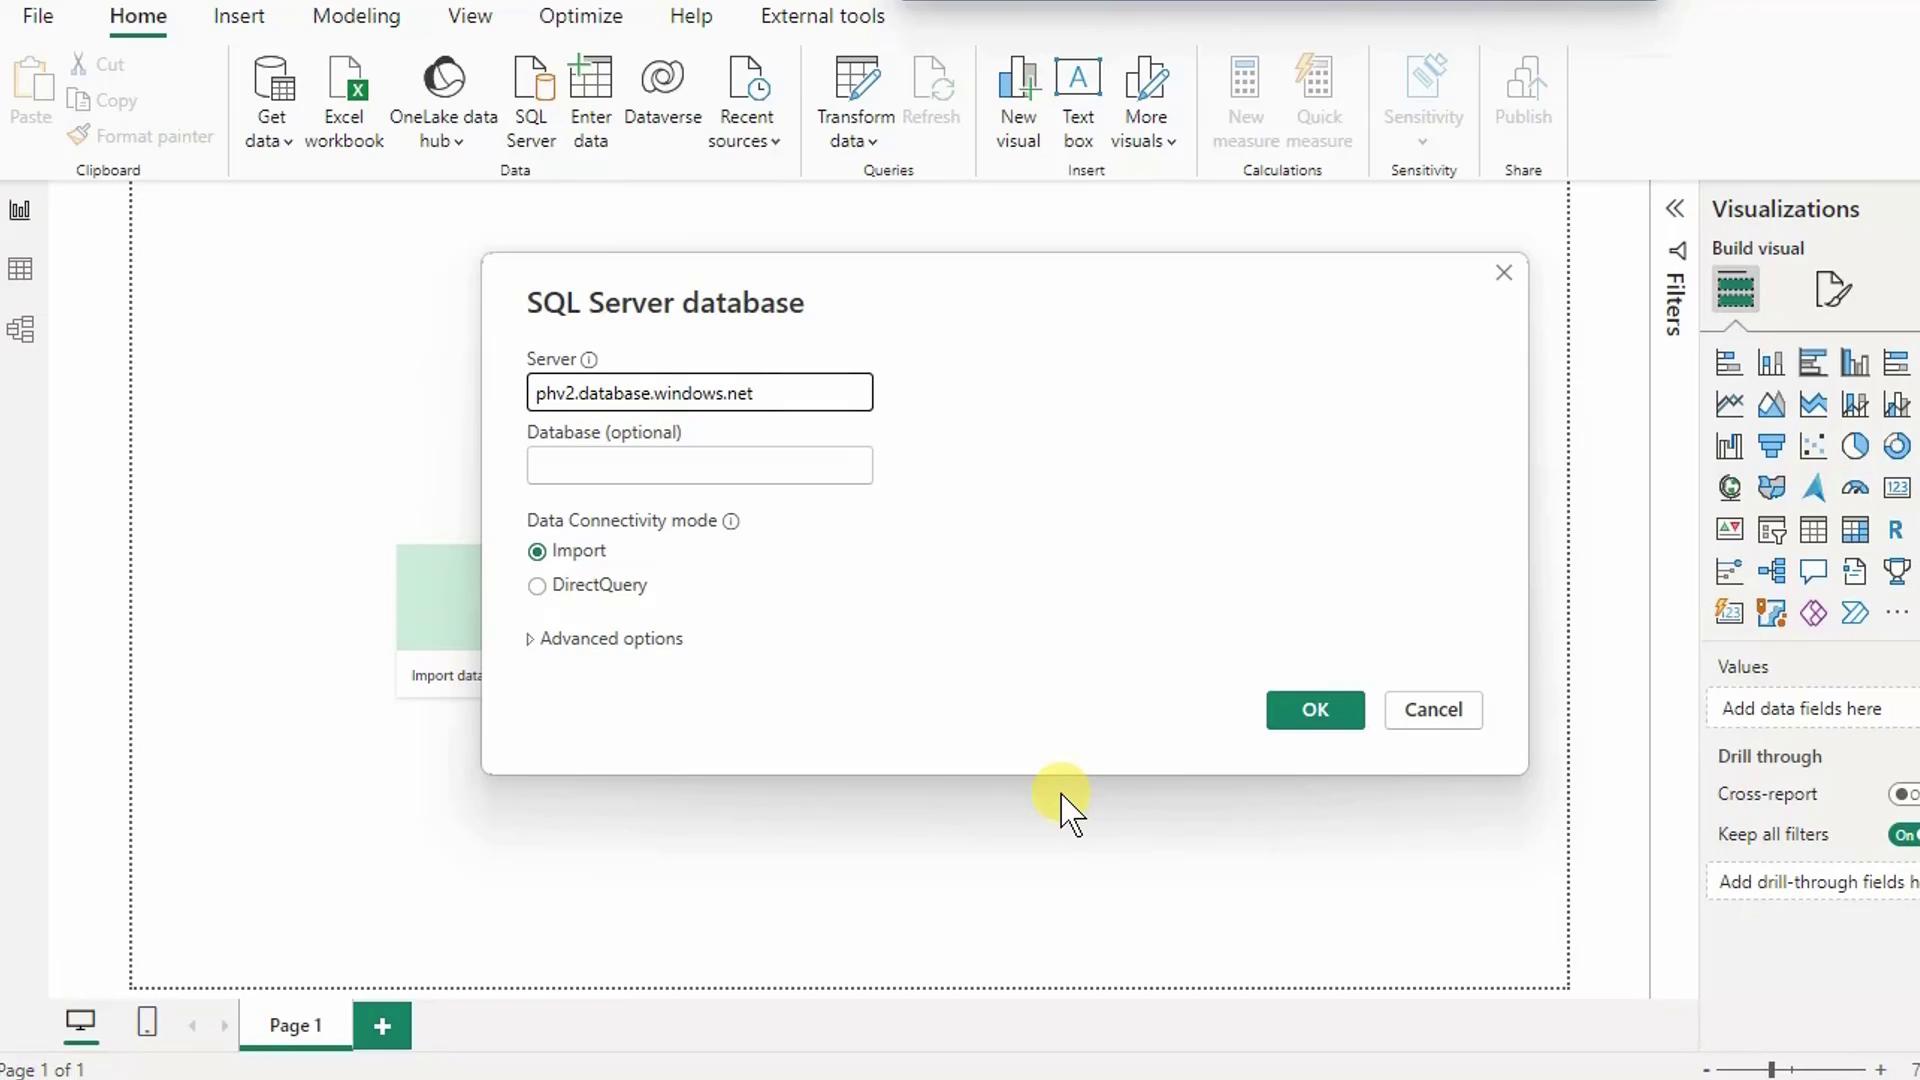
- Paste your Server name, click OK, then choose Database authentication. Enter your SQL admin credentials and click Connect.
4. Select and Load Tables
When the Navigator appears, expand your database (e.g., PHVAZ) and select the following tables:| Table | Purpose |
|---|---|
| SalesLT.Address | Contains country/region information |
| SalesLT.SalesOrderHeader | Links orders to customers and addresses |
| SalesLT.SalesOrderDetail | Includes product IDs and quantities |

- To preview or transform data, click Transform Data (opens Power Query).
- To proceed directly, click Load to import the tables.
5. Verify Auto-Detected Relationships
Switch to Model view (bottom icon in the left pane) to confirm Power BI has created correct joins between your tables.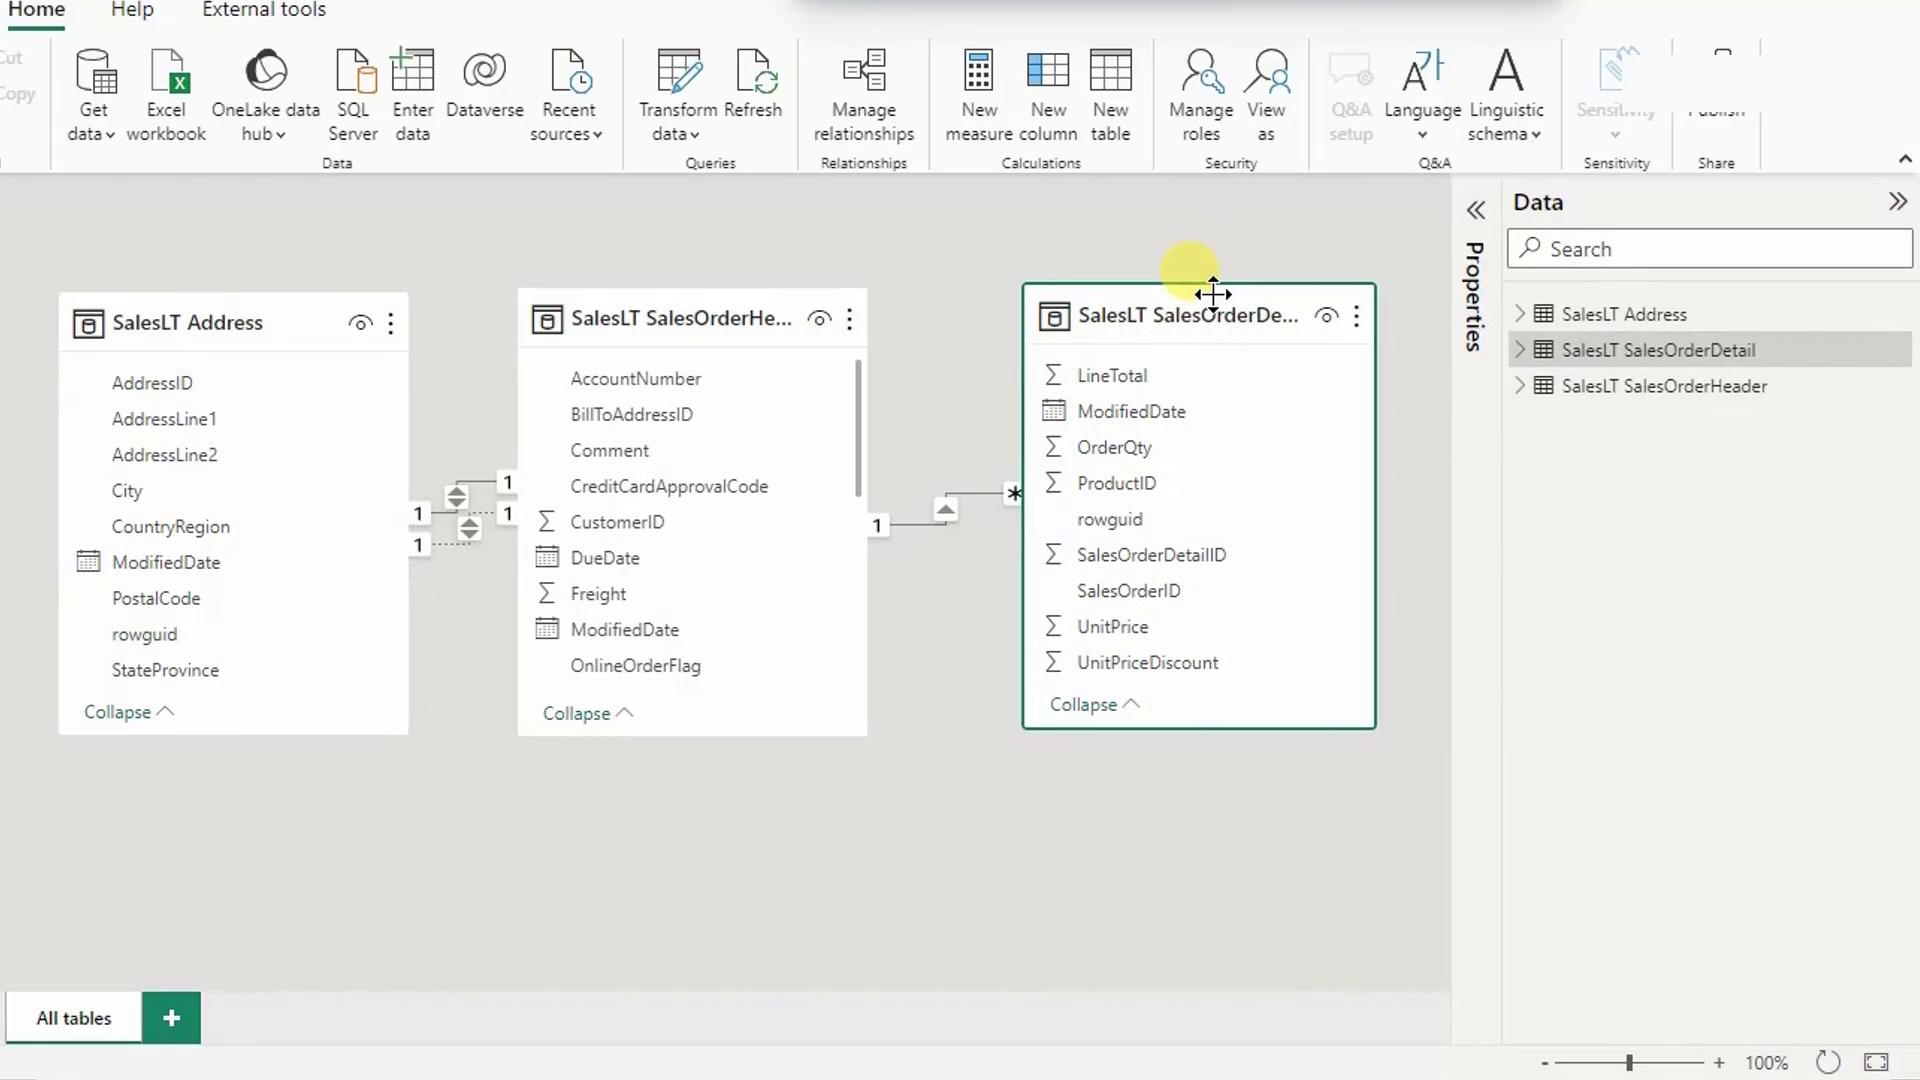
6. Build the Stacked Column Chart
- Switch to Report view (top icon in the left pane).
- From Visualizations, select Stacked column chart and place it on the canvas.
- In Fields, expand SalesLT.Address and check CountryRegion (X-axis).
- Expand SalesLT.SalesOrderDetail, check ProductID, then click the drop-down next to ProductID under Values and select Count (Distinct).
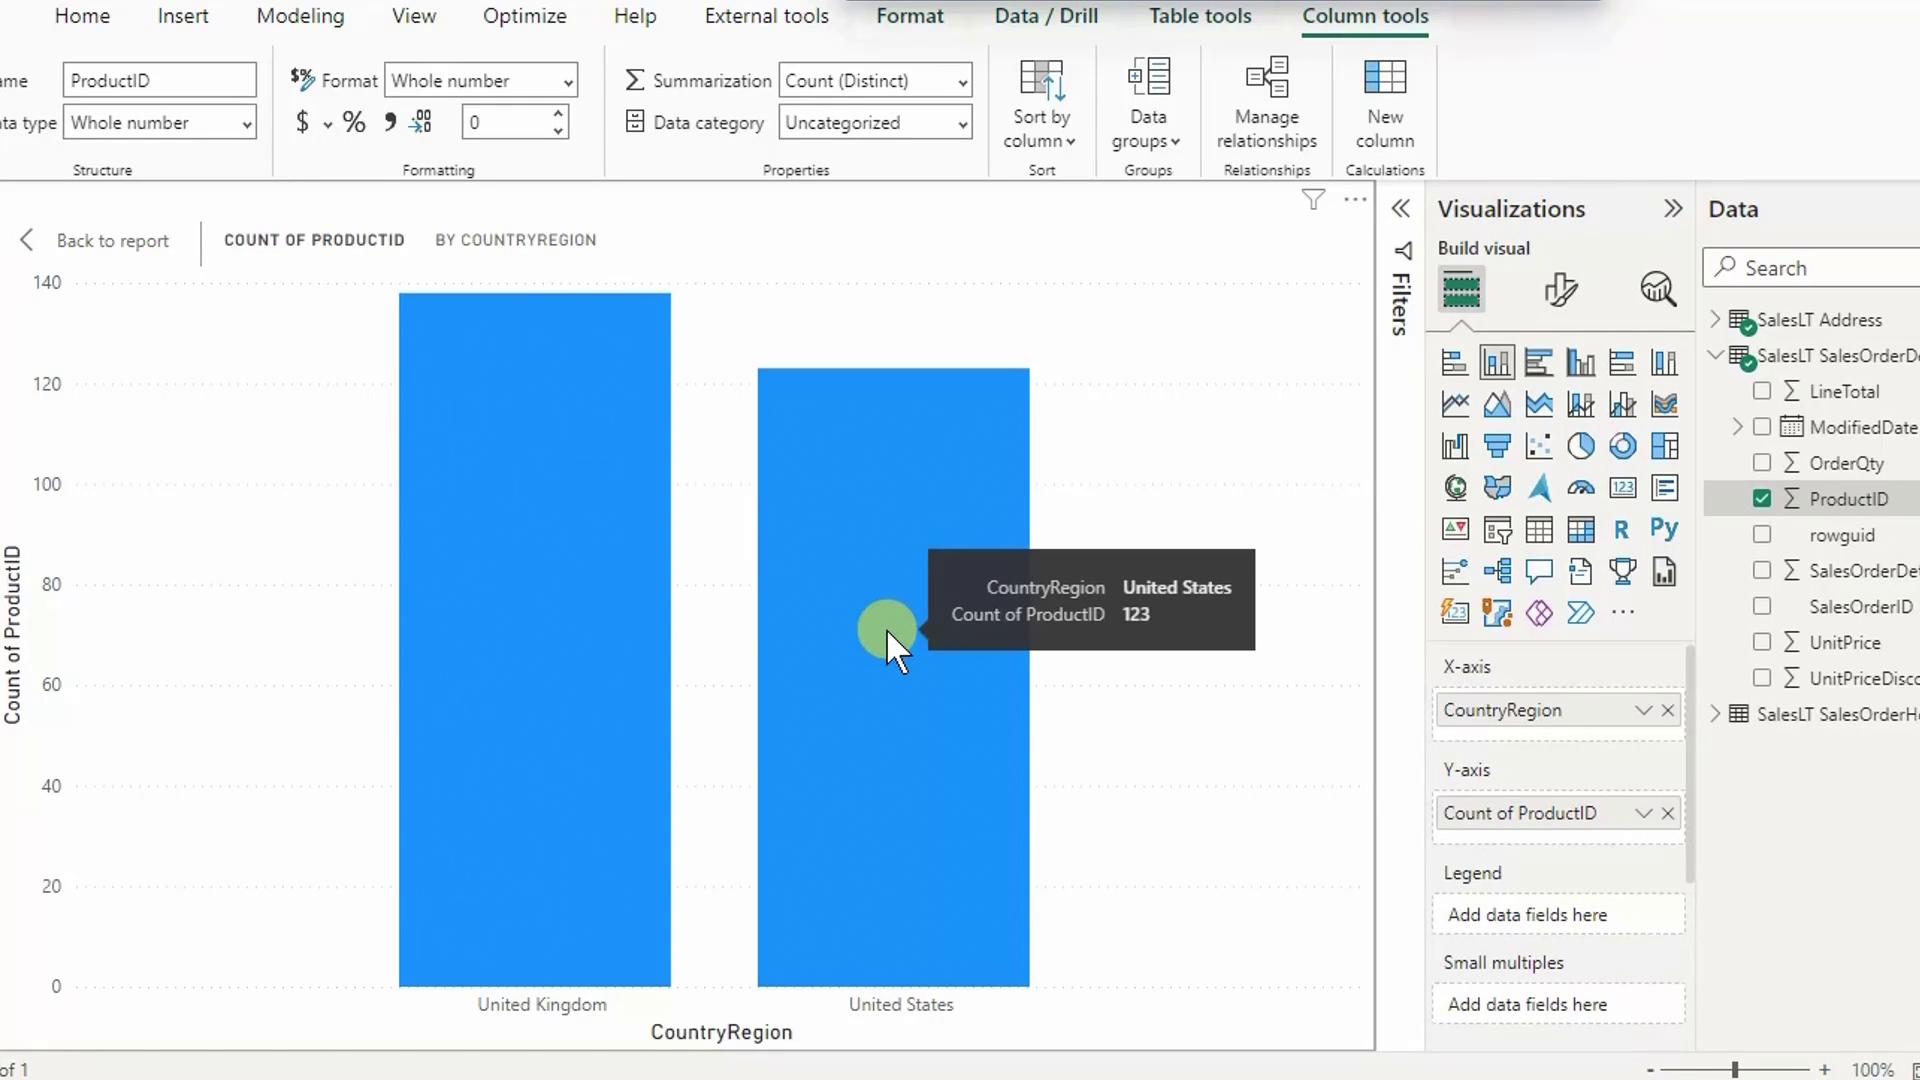
7. Interpret Your Results
- Hover over the United Kingdom column to see Distinct count of ProductID = 138.
- Hover over United States to view 123 distinct products.
Next Steps & References
- Explore Power Query transformations to clean and shape data.
- Visit Power BI documentation for advanced visualizations and DAX calculations.
- Learn more about Azure SQL Database.