> ## Documentation Index
> Fetch the complete documentation index at: https://notes.kodekloud.com/llms.txt
> Use this file to discover all available pages before exploring further.

# Demo Power BI Report

> This tutorial teaches how to connect Power BI Desktop to an Azure SQL Database, import data, and create a report showing product counts by country/region.

In this tutorial, you’ll learn how to connect Power BI Desktop to an Azure SQL Database, import data, and build a simple report that shows distinct product counts by country/region.

## Prerequisites

Before you begin, make sure you have the following:

| Resource                     | Purpose                                       | Link/Notes                                                                                                                                                                                     |
| ---------------------------- | --------------------------------------------- | ---------------------------------------------------------------------------------------------------------------------------------------------------------------------------------------------- |
| Azure SQL Database           | Holds your sample data (e.g., AdventureWorks) | Deploy via Azure Portal or [Azure CLI](https://docs.microsoft.com/azure/azure-sql/)                                                                                                            |
| Sample Data (AdventureWorks) | Demo dataset for sales and customer info      | [https://github.com/microsoft/sql-server-samples/tree/master/samples/databases/adventure-works](https://github.com/microsoft/sql-server-samples/tree/master/samples/databases/adventure-works) |
| Power BI Desktop             | Authoring tool for reports and visualizations | Download from [Microsoft Store](https://powerbi.microsoft.com/desktop/) or [Microsoft Download Center](https://aka.ms/pbidesktop)                                                              |

<Frame>
  ![The image shows the Microsoft Azure portal interface, displaying various Azure services and a list of recent resources with their types and last viewed times.](https://kodekloud.com/kk-media/image/upload/v1752872870/notes-assets/images/DP-900-Microsoft-Azure-Data-Fundamentals-Demo-Power-BI-Report/azure-portal-interface-services-resources.jpg)
</Frame>

***

## 1. Set Up Your Azure SQL Database

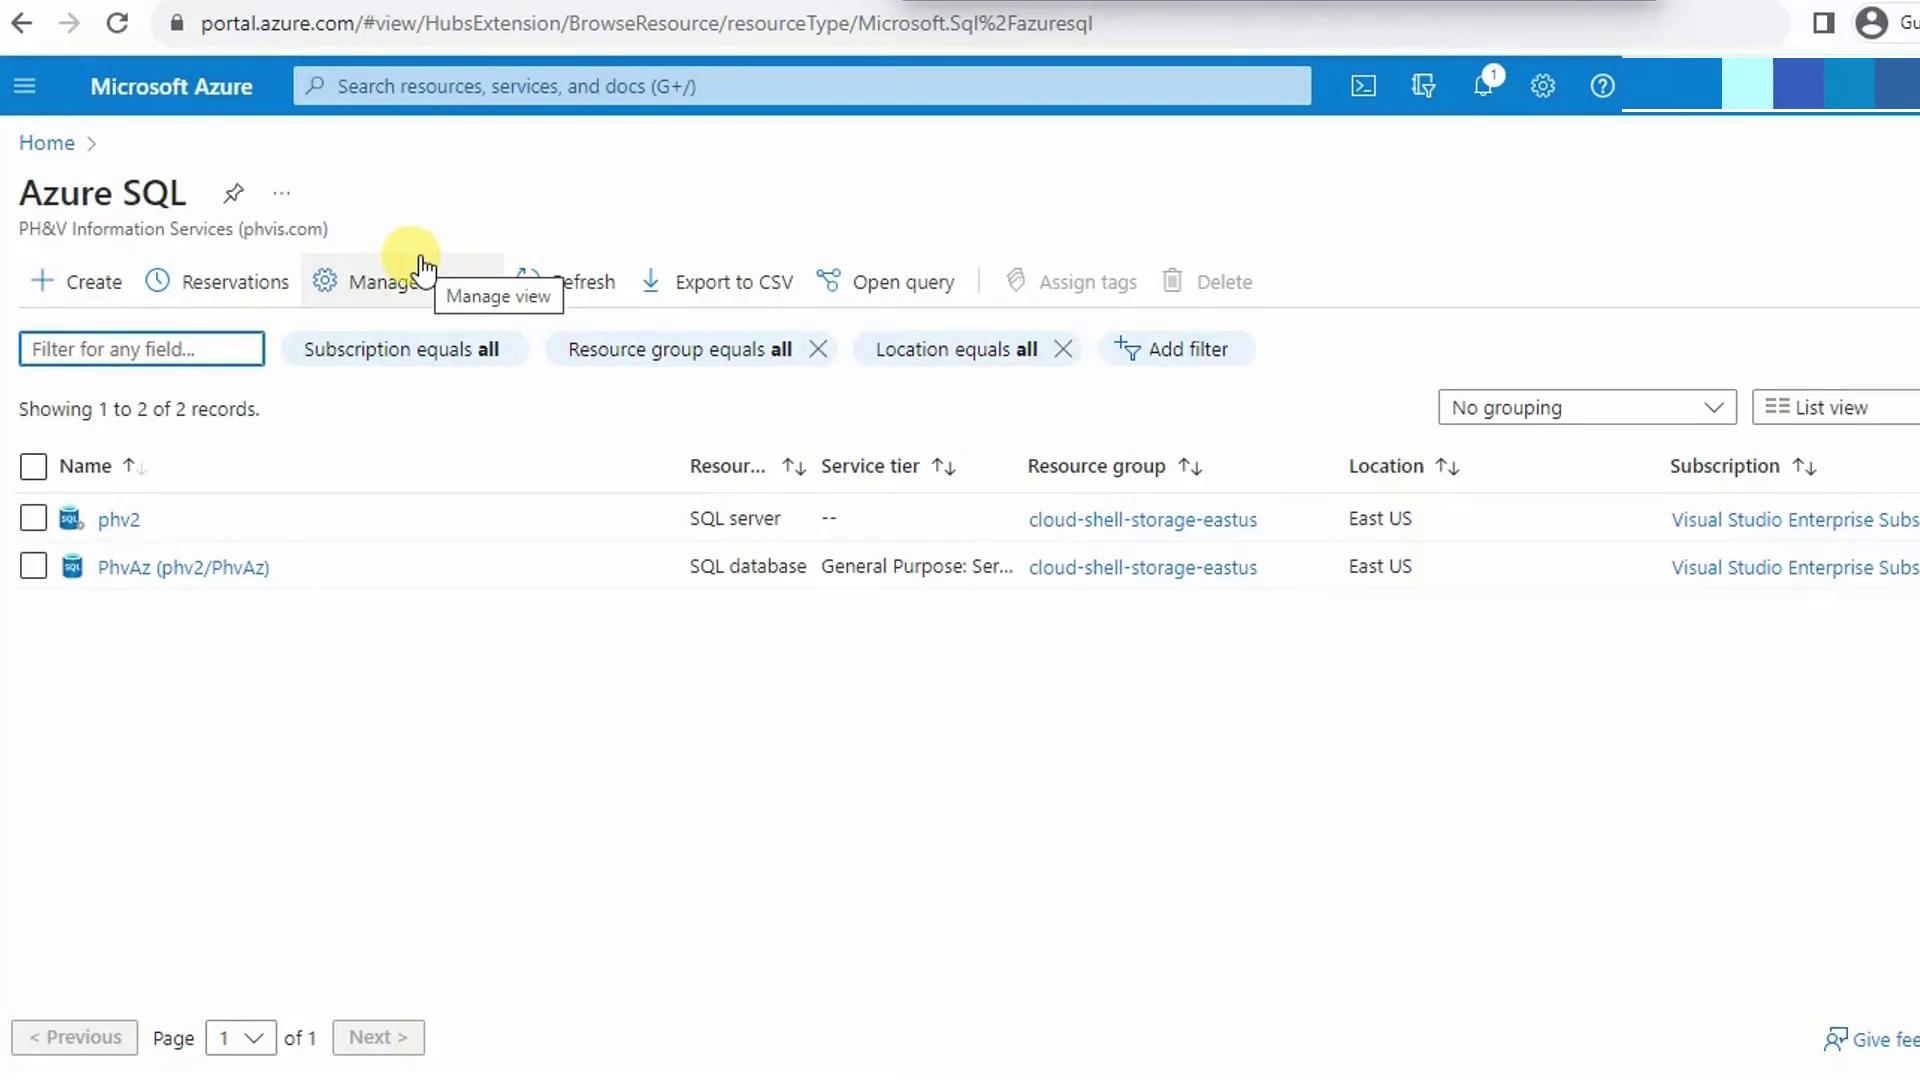
1. Provision an **Azure SQL Database** in the Azure Portal.
2. Use the built-in wizard to import the **AdventureWorks** sample database.
<Frame>
  ![The image shows the Azure SQL management interface on the Microsoft Azure portal, displaying a list of SQL resources with details like name, resource type, and location.](https://kodekloud.com/kk-media/image/upload/v1752872871/notes-assets/images/DP-900-Microsoft-Azure-Data-Fundamentals-Demo-Power-BI-Report/azure-sql-management-interface-portal.jpg)
</Frame>

### Configure the Server Firewall

<Callout icon="triangle-alert" color="#FF6B6B">
  Your client IP must be allowed through the SQL Server firewall before Power BI can connect.

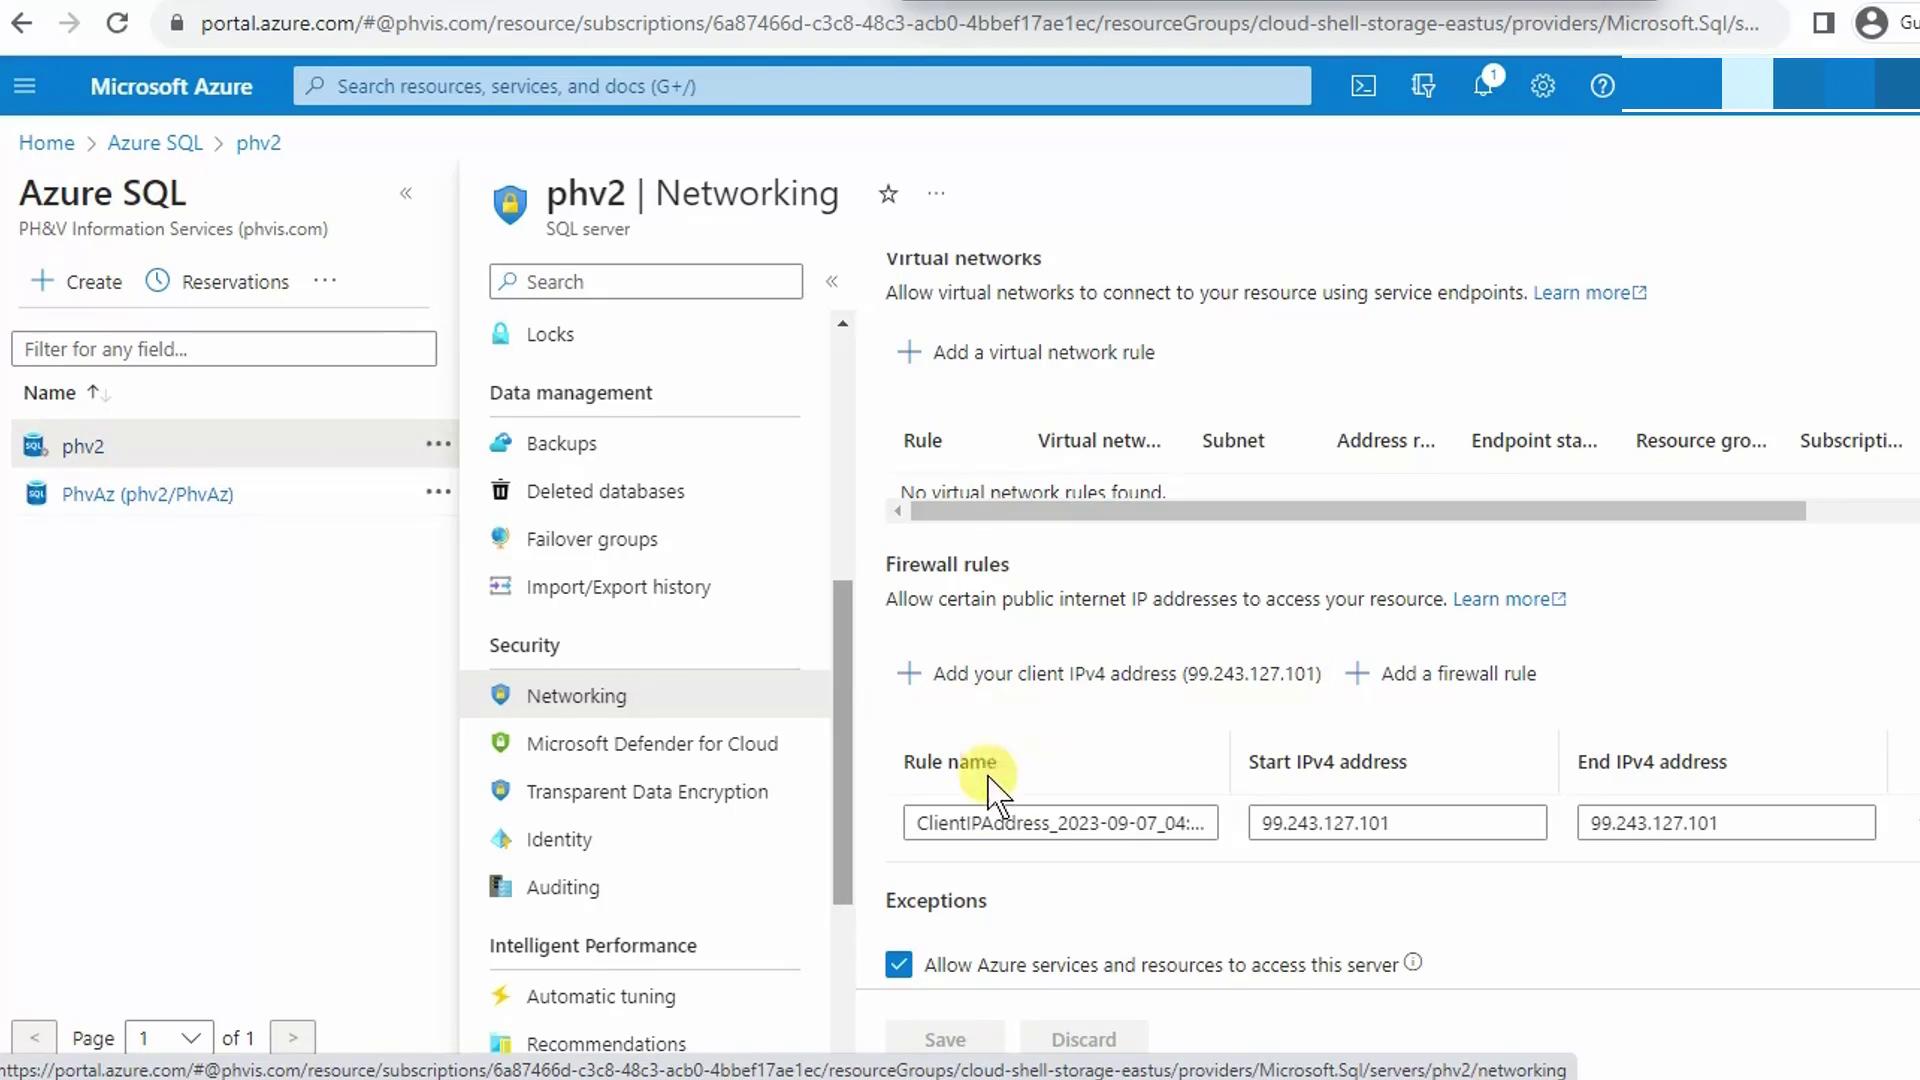
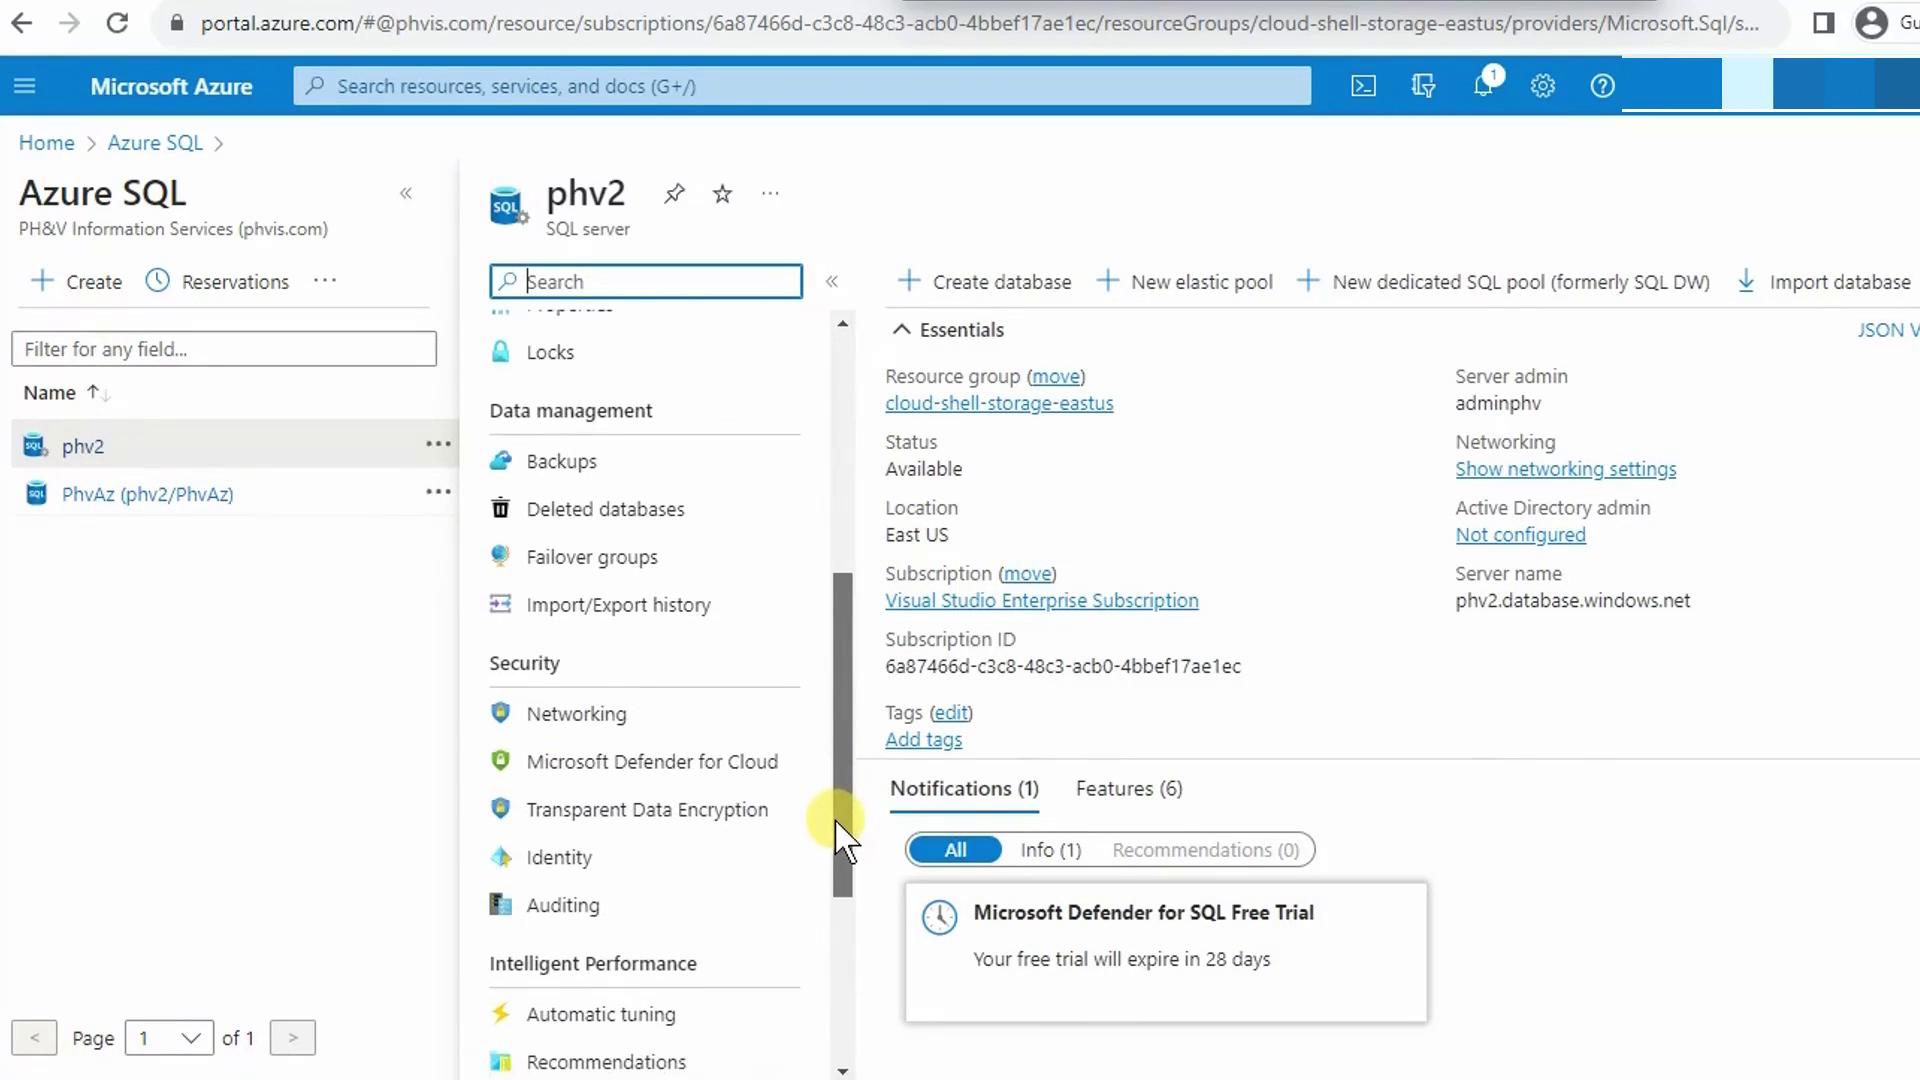
  1. In the Azure Portal, go to your SQL server.
  2. Under **Networking**, click **+ Add client IP** to whitelist your current address.
</Callout>

<Frame>
  ![The image shows the Azure SQL management interface, displaying details of a SQL server named "phv2" with options for data management, security, and performance features. A notification about a Microsoft Defender for SQL free trial is also visible.](https://kodekloud.com/kk-media/image/upload/v1752872872/notes-assets/images/DP-900-Microsoft-Azure-Data-Fundamentals-Demo-Power-BI-Report/azure-sql-management-interface-phv2.jpg)
</Frame>

<Frame>
  ![The image shows the Microsoft Azure portal, specifically the networking settings for an Azure SQL server. It includes options for adding virtual network rules and firewall rules, with a specific IP address being configured.](https://kodekloud.com/kk-media/image/upload/v1752872873/notes-assets/images/DP-900-Microsoft-Azure-Data-Fundamentals-Demo-Power-BI-Report/azure-portal-networking-settings-sql-server.jpg)
</Frame>

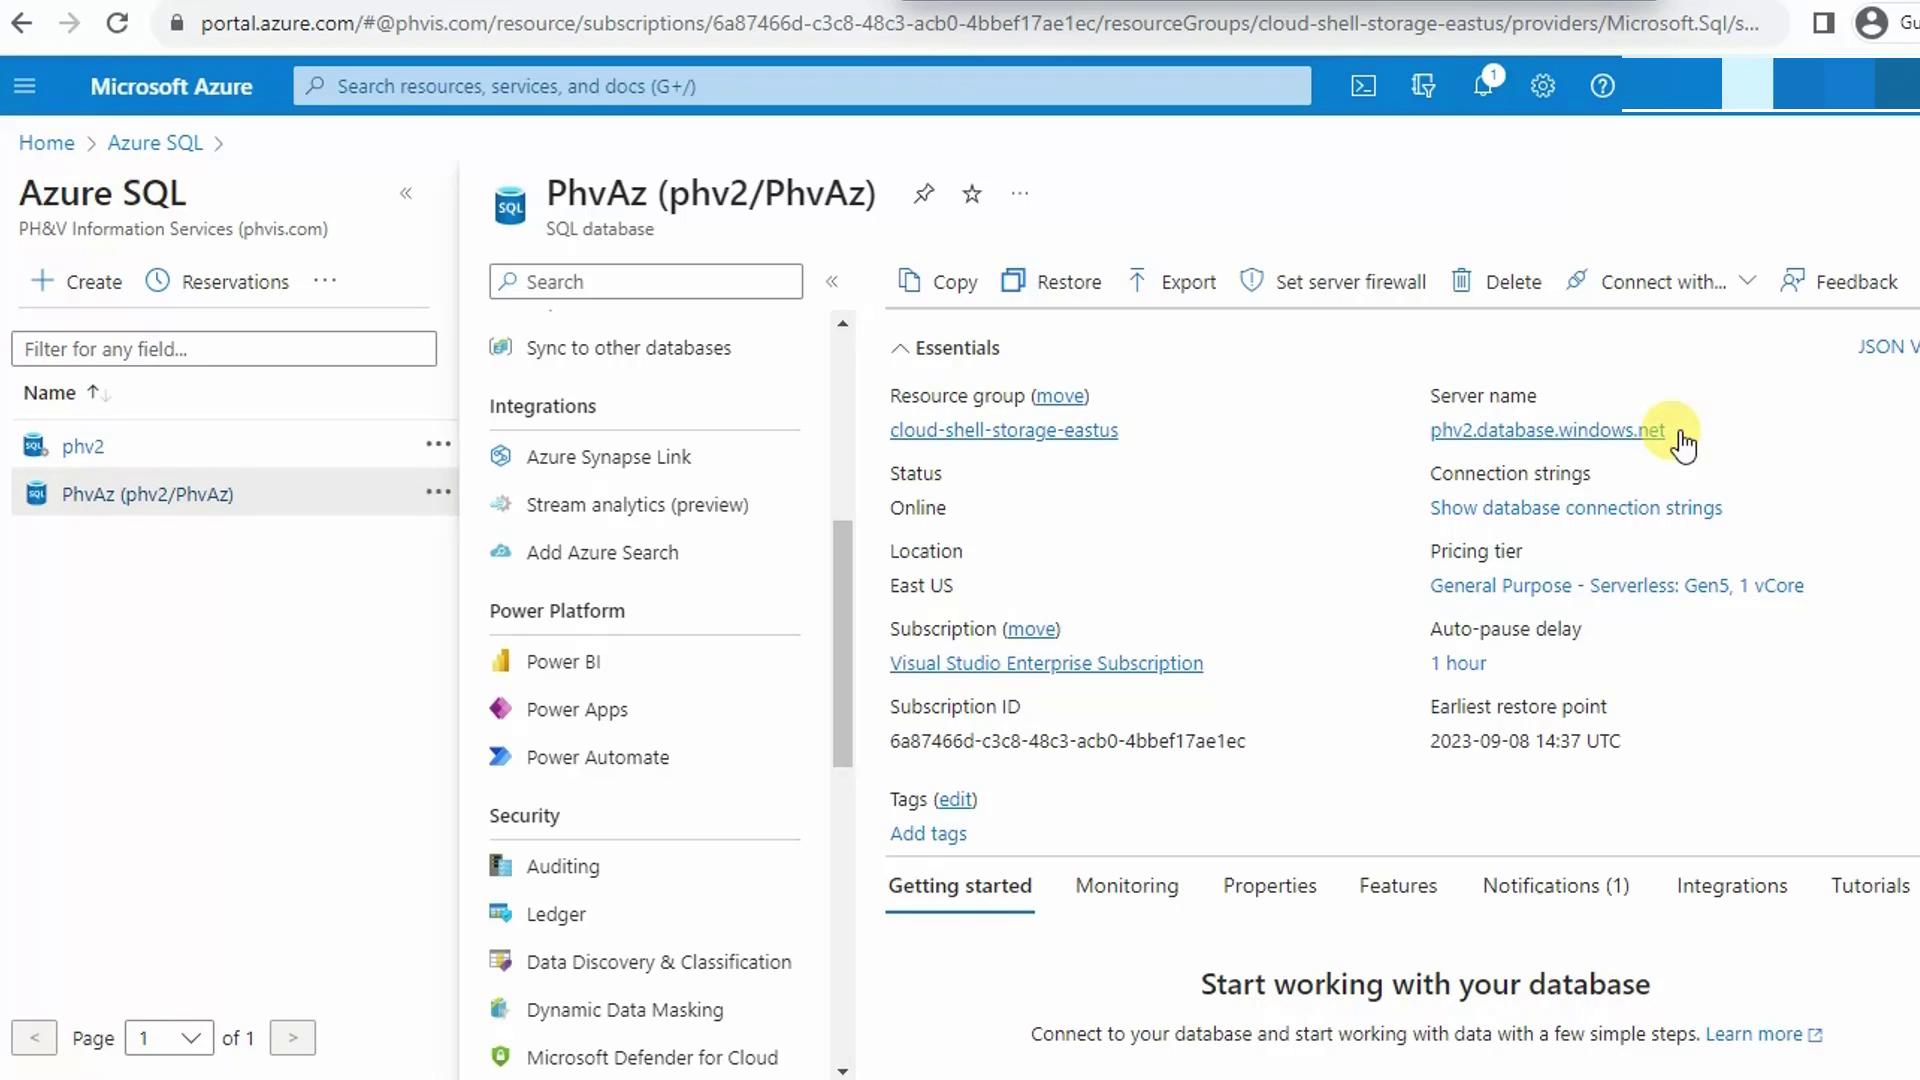
Once your IP is approved, copy the **Server name** from the database overview (hover and **Copy to clipboard**). You’ll need it for Power BI.
<Frame>
  ![The image shows a Microsoft Azure portal interface displaying details of an Azure SQL database named "PhvAz." It includes information such as server name, resource group, status, location, and integration options.](https://kodekloud.com/kk-media/image/upload/v1752872875/notes-assets/images/DP-900-Microsoft-Azure-Data-Fundamentals-Demo-Power-BI-Report/azure-portal-sql-database-phvaz.jpg)
</Frame>

***

## 2. Install Power BI Desktop

Power BI Desktop is free and provides full report-authoring capabilities.

<Callout icon="lightbulb" color="#1CB2FE">
  If you don’t have it installed already, download Power BI Desktop for Windows or try the [Power BI service in your browser](https://app.powerbi.com/).
</Callout>

***

## 3. Connect Power BI to Azure SQL Database

1. Open **Power BI Desktop**.
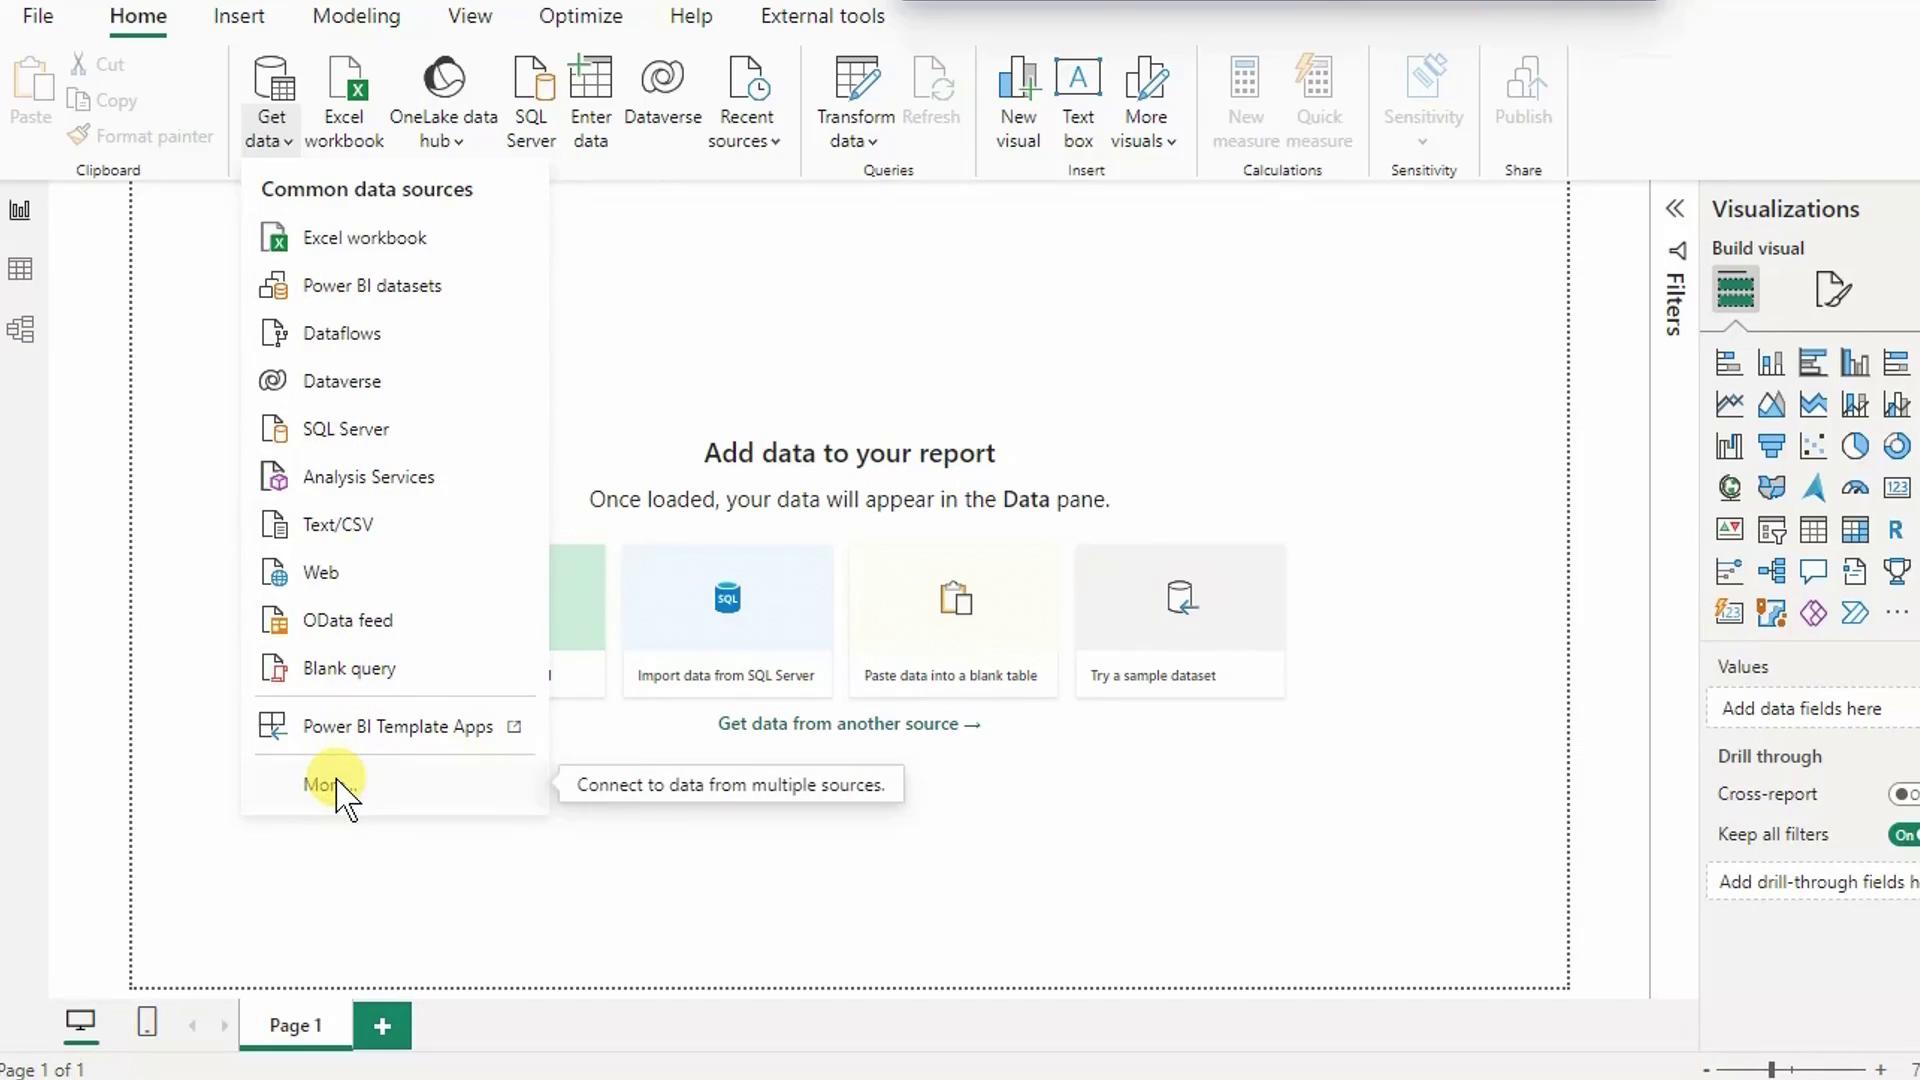
2. On the Home ribbon, select **Get Data** → **More…**.
<Frame>
  ![The image shows a Power BI interface with options to add data from various sources, such as Excel and SQL Server, and a visualization pane on the right.](https://kodekloud.com/kk-media/image/upload/v1752872875/notes-assets/images/DP-900-Microsoft-Azure-Data-Fundamentals-Demo-Power-BI-Report/power-bi-data-sources-visualization.jpg)
</Frame>

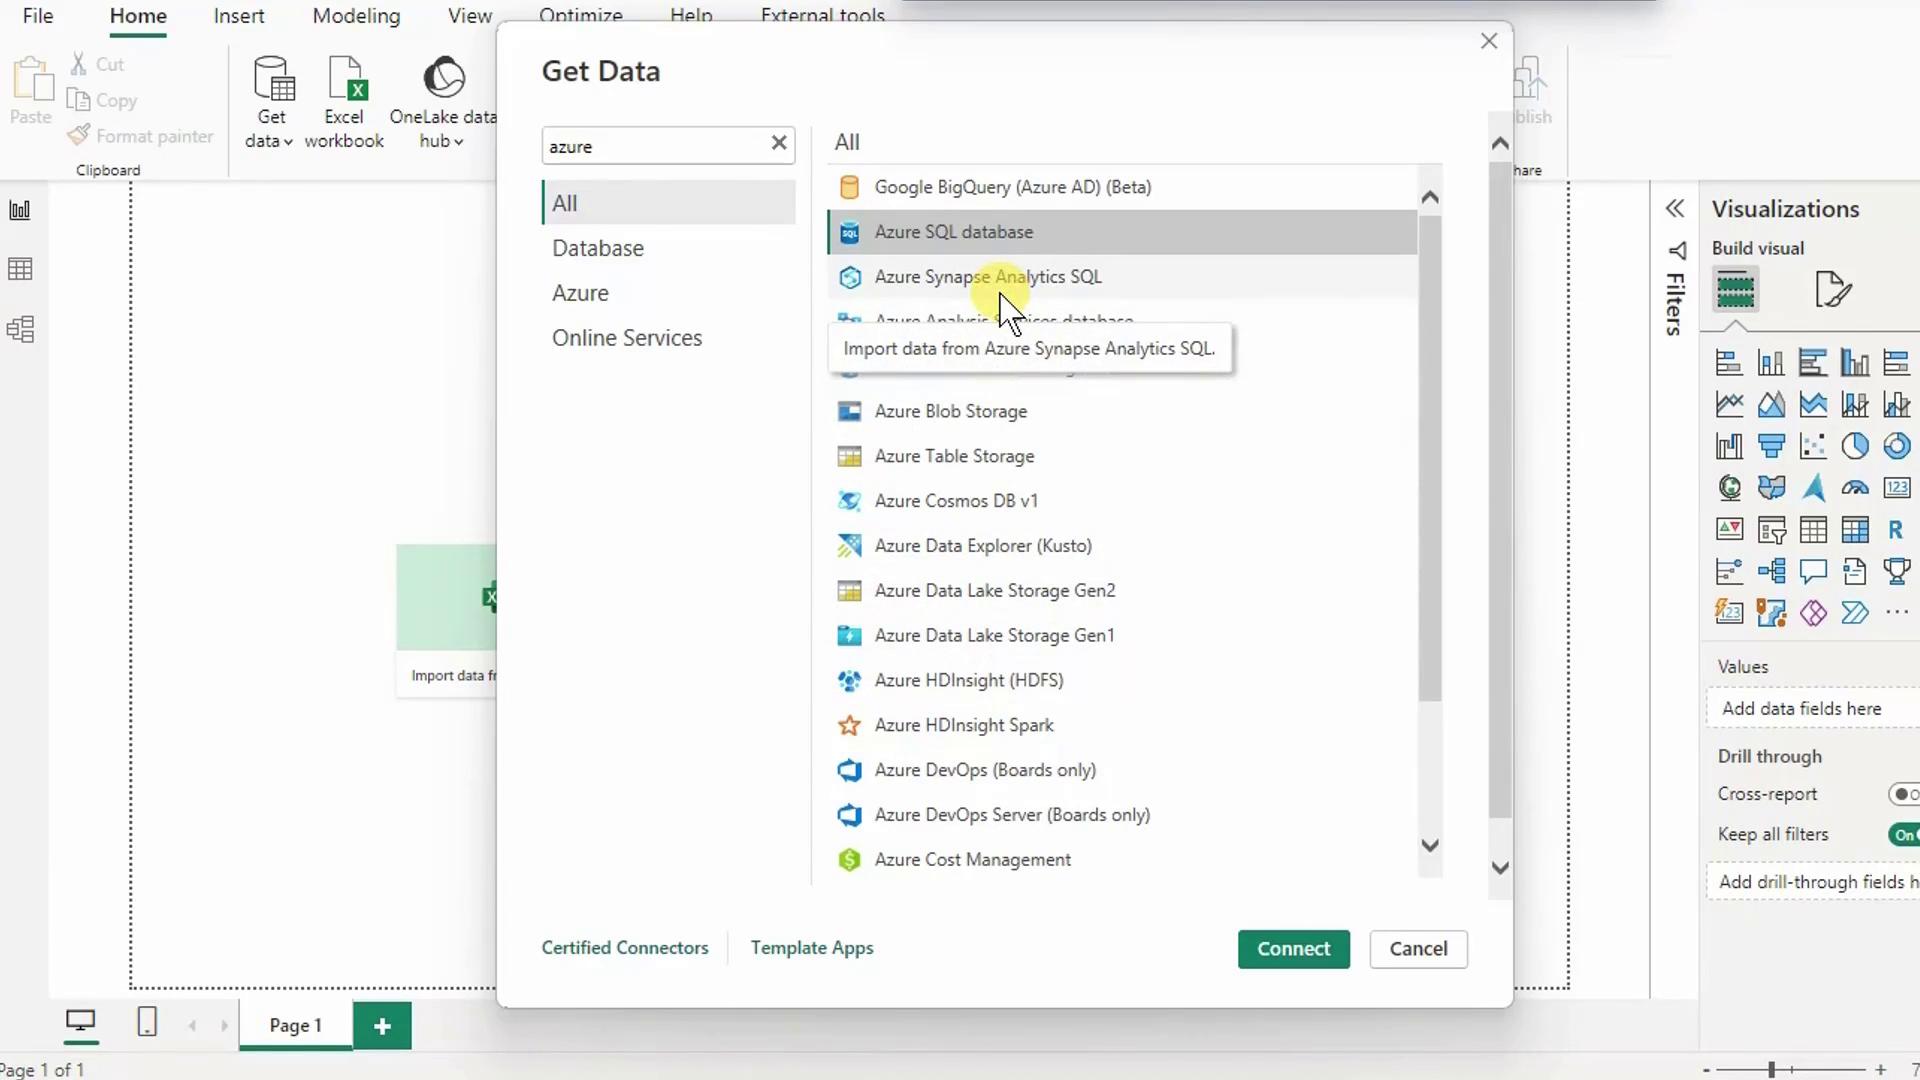
3. In the **Get Data** dialog, search for **Azure SQL Database** and click **Connect**.
<Frame>
  ![The image shows a "Get Data" window in a software application, displaying various Azure data source options like Azure SQL Database and Azure Synapse Analytics SQL. The user interface includes options for connecting to these data sources.](https://kodekloud.com/kk-media/image/upload/v1752872876/notes-assets/images/DP-900-Microsoft-Azure-Data-Fundamentals-Demo-Power-BI-Report/get-data-window-azure-sources-options.jpg)
</Frame>

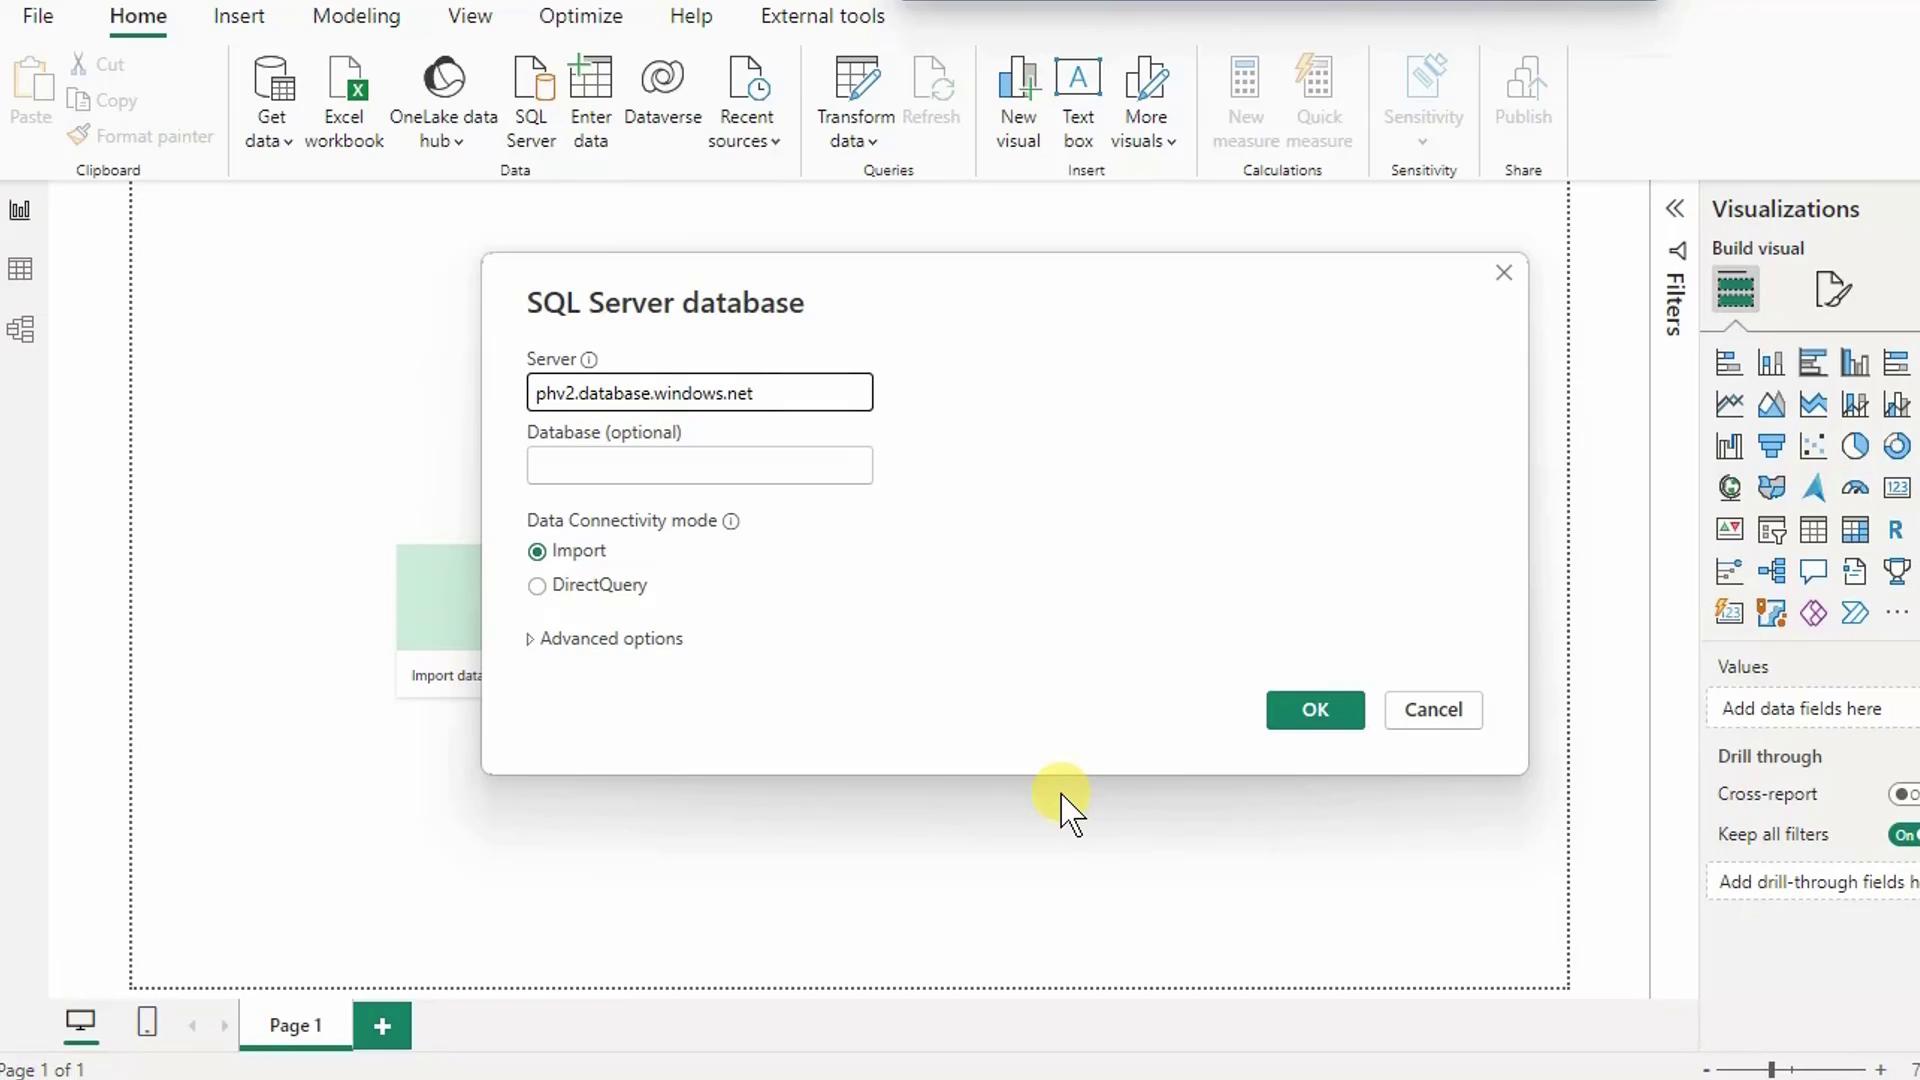
4. Paste your **Server name**, click **OK**, then choose **Database** authentication. Enter your SQL admin credentials and click **Connect**.
<Frame>
  ![The image shows a Power BI interface with a pop-up window for connecting to an SQL Server database, where the server name is filled in, and options for data connectivity mode are available.](https://kodekloud.com/kk-media/image/upload/v1752872877/notes-assets/images/DP-900-Microsoft-Azure-Data-Fundamentals-Demo-Power-BI-Report/power-bi-sql-server-connection-popup.jpg)
</Frame>

***

## 4. Select and Load Tables

When the **Navigator** appears, expand your database (e.g., **PHVAZ**) and select the following tables:

| Table                    | Purpose                                 |
| ------------------------ | --------------------------------------- |
| SalesLT.Address          | Contains country/region information     |
| SalesLT.SalesOrderHeader | Links orders to customers and addresses |
| SalesLT.SalesOrderDetail | Includes product IDs and quantities     |

<Frame>
  ![The image shows a Power BI interface with a Navigator pane displaying a list of database tables and a preview of the "SalesLT.SalesOrderDetail" table, which includes columns like SalesOrderID, OrderQty, and UnitPrice.](https://kodekloud.com/kk-media/image/upload/v1752872878/notes-assets/images/DP-900-Microsoft-Azure-Data-Fundamentals-Demo-Power-BI-Report/power-bi-navigator-salesorderdetail-preview.jpg)
</Frame>

* To preview or transform data, click **Transform Data** (opens Power Query).
* To proceed directly, click **Load** to import the tables.

***

## 5. Verify Auto-Detected Relationships

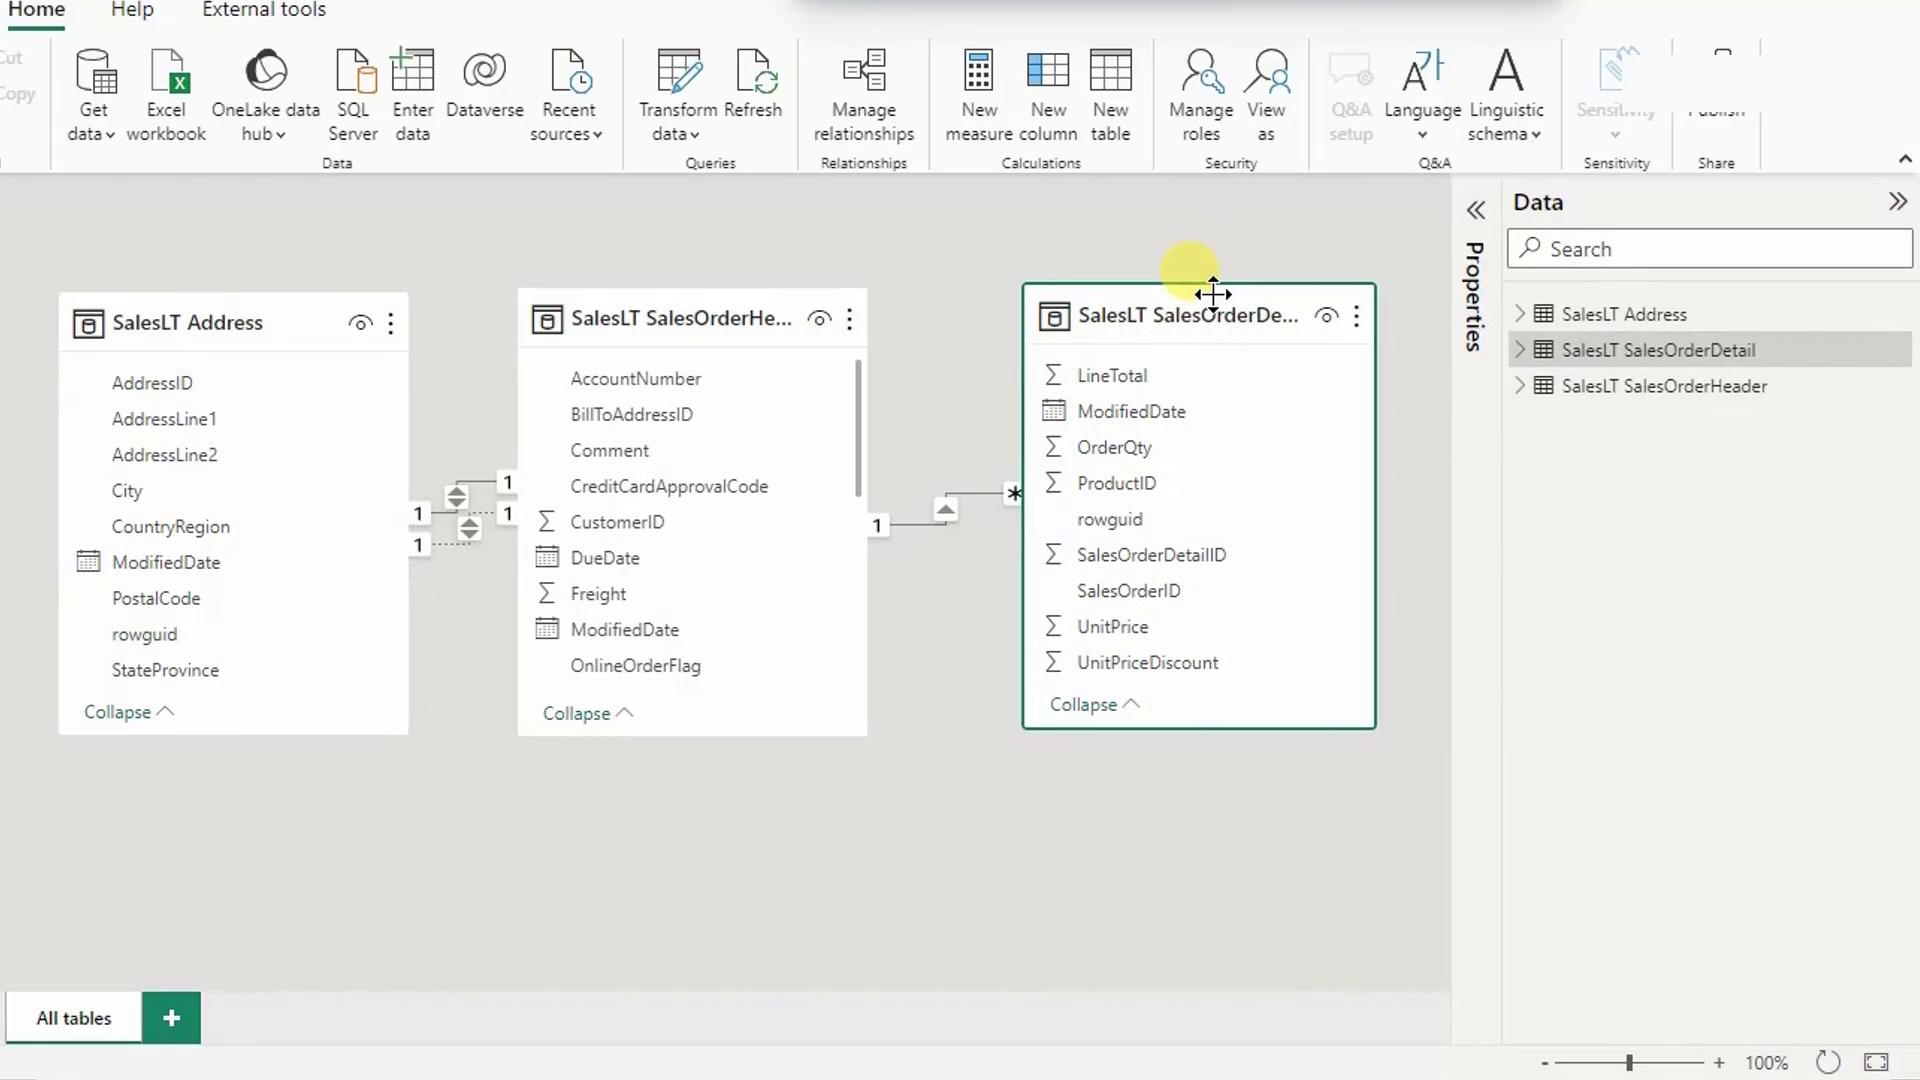
Switch to **Model view** (bottom icon in the left pane) to confirm Power BI has created correct joins between your tables.
<Frame>
  ![The image shows a data model in Power BI, displaying tables with fields and relationships between them. The tables include "SalesLT Address," "SalesLT SalesOrderHeader," and "SalesLT SalesOrderDetail."](https://kodekloud.com/kk-media/image/upload/v1752872879/notes-assets/images/DP-900-Microsoft-Azure-Data-Fundamentals-Demo-Power-BI-Report/power-bi-data-model-tables-relationships.jpg)
</Frame>

Because all tables live in the same SQL database, Power BI typically auto-detects relationships.

***

## 6. Build the Stacked Column Chart

1. Switch to **Report view** (top icon in the left pane).
2. From **Visualizations**, select **Stacked column chart** and place it on the canvas.
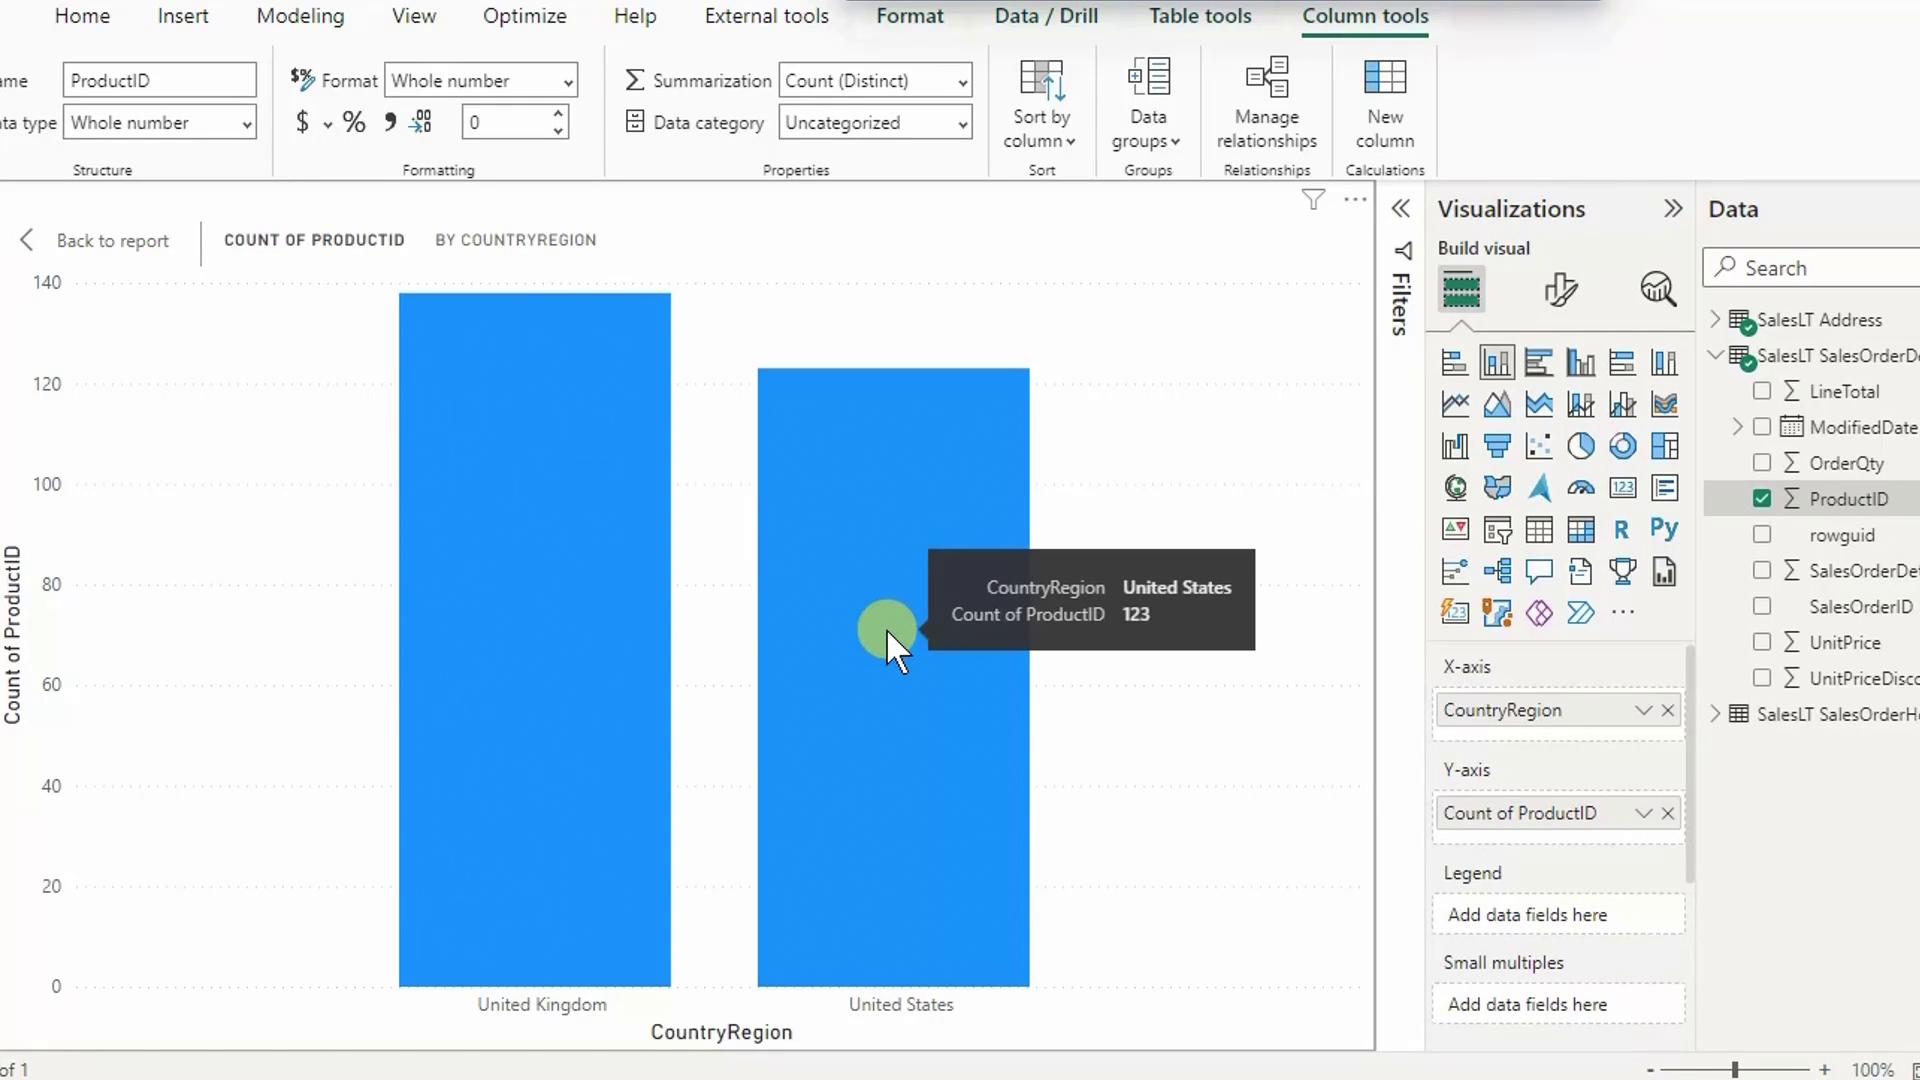
3. In **Fields**, expand **SalesLT.Address** and check **CountryRegion** (X-axis).
4. Expand **SalesLT.SalesOrderDetail**, check **ProductID**, then click the drop-down next to **ProductID** under **Values** and select **Count (Distinct)**.
<Frame>
  ![The image shows a bar chart in a data visualization tool, comparing the count of ProductID between the United Kingdom and the United States. The chart indicates that the United Kingdom has a higher count than the United States.](https://kodekloud.com/kk-media/image/upload/v1752872880/notes-assets/images/DP-900-Microsoft-Azure-Data-Fundamentals-Demo-Power-BI-Report/bar-chart-productid-uk-us-comparison.jpg)
</Frame>

***

## 7. Interpret Your Results

* Hover over the **United Kingdom** column to see **Distinct count of ProductID = 138**.
* Hover over **United States** to view **123 distinct products**.

These numbers reveal at least 15 products sold in the UK that haven’t sold in the US—insights you can use for marketing or inventory analysis.

***

## Next Steps & References

* Explore [Power Query transformations](https://docs.microsoft.com/power-query/) to clean and shape data.
* Visit [Power BI documentation](https://docs.microsoft.com/power-bi/) for advanced visualizations and DAX calculations.
* Learn more about [Azure SQL Database](https://docs.microsoft.com/azure/azure-sql/).

Congratulations! You’ve successfully created a Power BI report using data from an Azure SQL Database.

<CardGroup>
  <Card title="Watch Video" icon="video" cta="Learn more" href="https://learn.kodekloud.com/user/courses/dp-900-microsoft-azure-data-fundamentals/module/a4f1a604-4743-4a3a-81ac-8210d6f9bb96/lesson/67992163-c6f2-495c-b34b-913942ddcf70" />
</CardGroup>