> ## Documentation Index
> Fetch the complete documentation index at: https://notes.kodekloud.com/llms.txt
> Use this file to discover all available pages before exploring further.
# Introduction
> This article introduces Online Analytical Processing (OLAP) and its role in data analysis, including data preparation and case studies using Azure services.
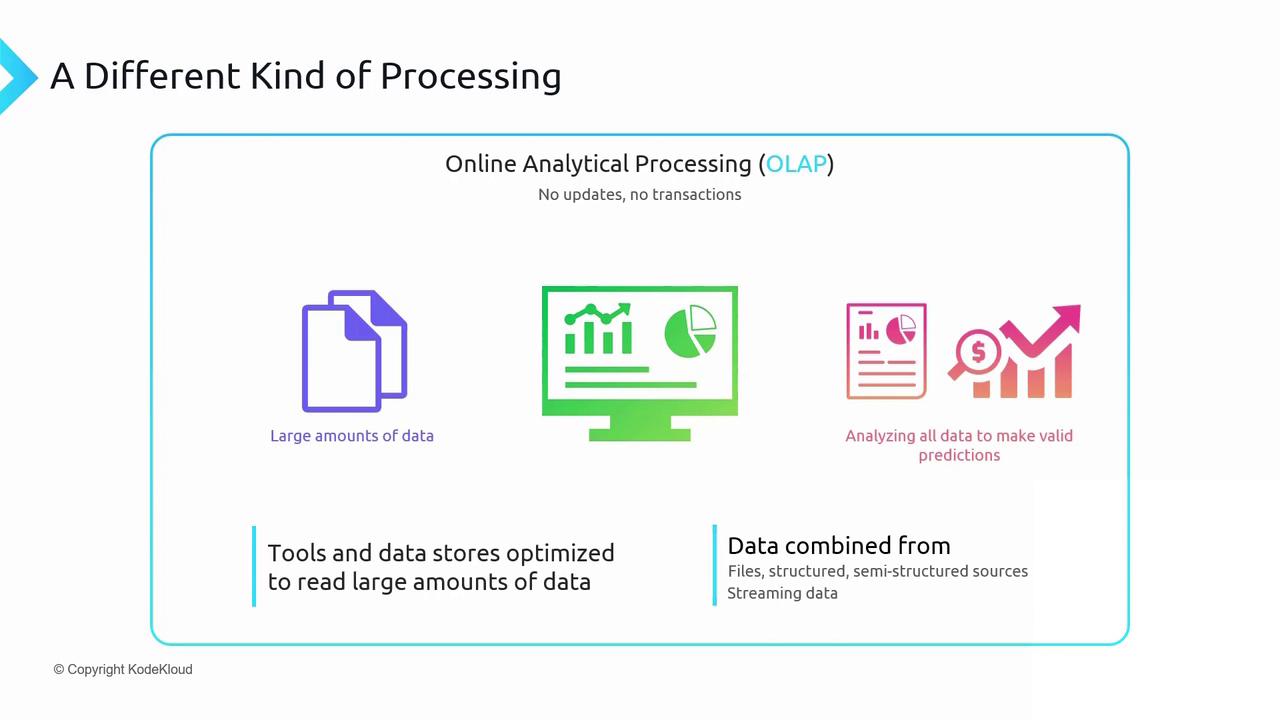
In this lesson, we dive into **Online Analytical Processing (OLAP)**—the backbone of modern data analysis. Unlike Online Transaction Processing (OLTP), OLAP systems are designed to:
| Characteristic | Description |
| ---------------------------------- | ------------------------------------------------------------------------------------------ |
| No in-place updates | Only a continuous **load** process appends new data; no record modifications or deletions. |
| Large-scale data handling | Efficiently processes terabytes of historical data to derive business insights and trends. |
| Optimized for read-heavy workloads | Uses specialized storage engines tailored for fast aggregations and complex queries. |
We’ll explore how OLAP transforms raw data into actionable intelligence by stitching together various Azure services.
***
## Case Study: Sales Forecast Analysis
Consider a scenario where you must predict next year’s revenue. Your data sources include:
| Data Source | Storage Service | Description |
| -------------------------- | ----------------------------- | ---------------------------------------------------------------- |
| Sales forecasts | Azure Blob Storage | Excel files detailing each customer’s projected product volumes. |
| Actual sales | Azure Cosmos DB Table Storage | Semi-structured, globally replicated transaction records. |
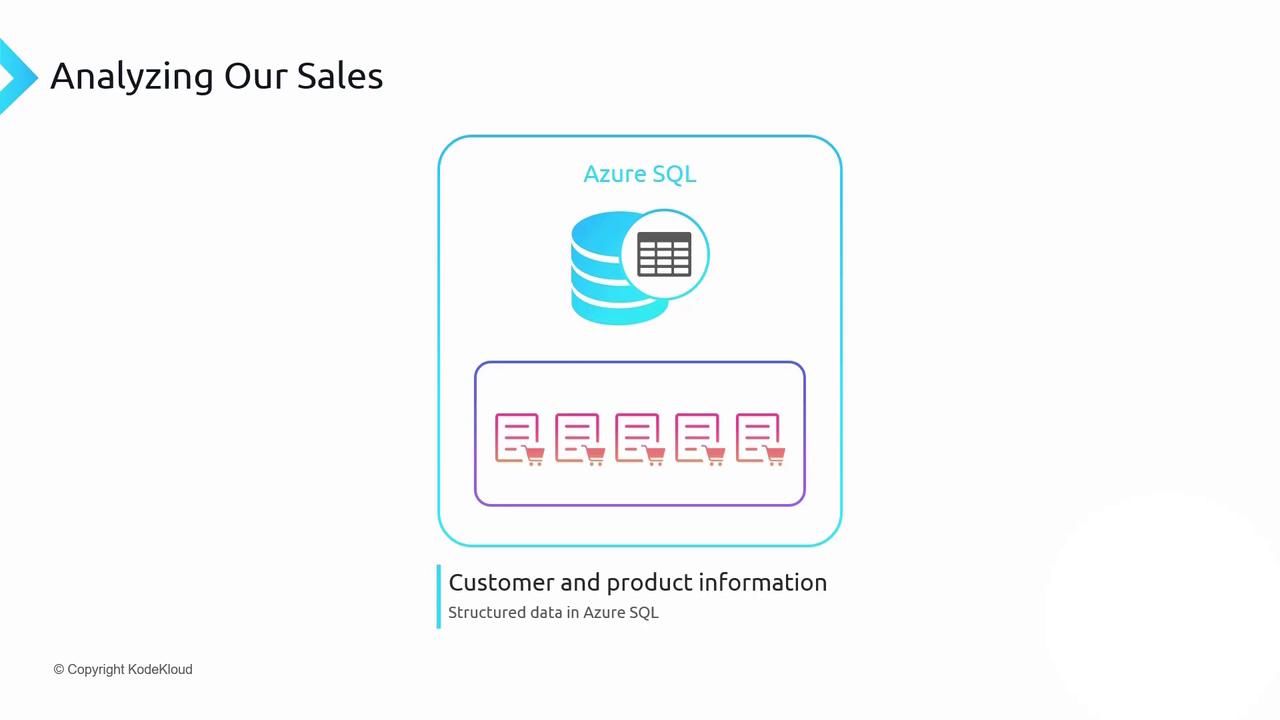
| Customer & product masters | Azure SQL Database | Structured relational tables for customer and product details. |
***
## Three Phases of Data Preparation (ETL)
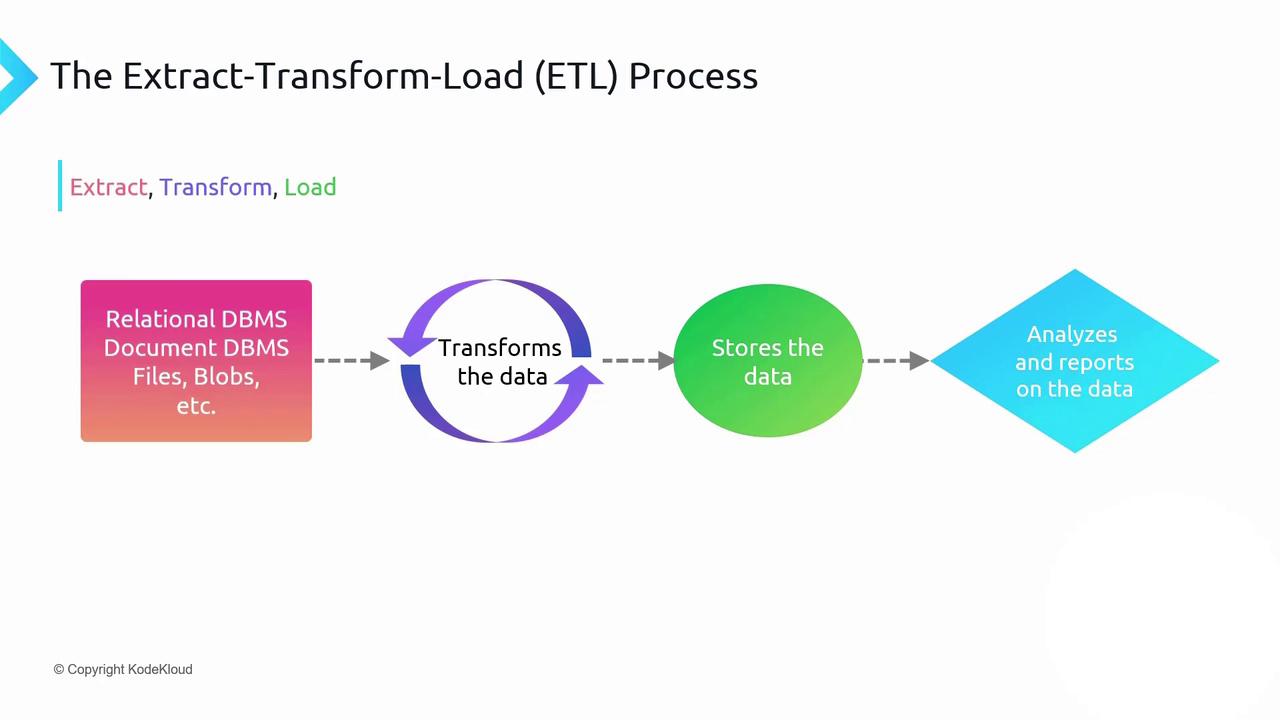
1. **Extract**\
Retrieve blobs from Azure Storage, tables from Cosmos DB, and rows from Azure SQL.
2. **Transform**\
Standardize formats, cleanse data, and perform aggregations (e.g., sum of sales by region).
3. **Load**\
Persist the cleansed and transformed dataset into a high-performance analytical store such as **Azure Synapse Analytics** or **Azure Data Lake Storage Gen2**.
Learn more about ETL best practices in the [Azure Data Factory documentation](https://docs.microsoft.com/azure/data-factory/concepts-pipelines-activities).
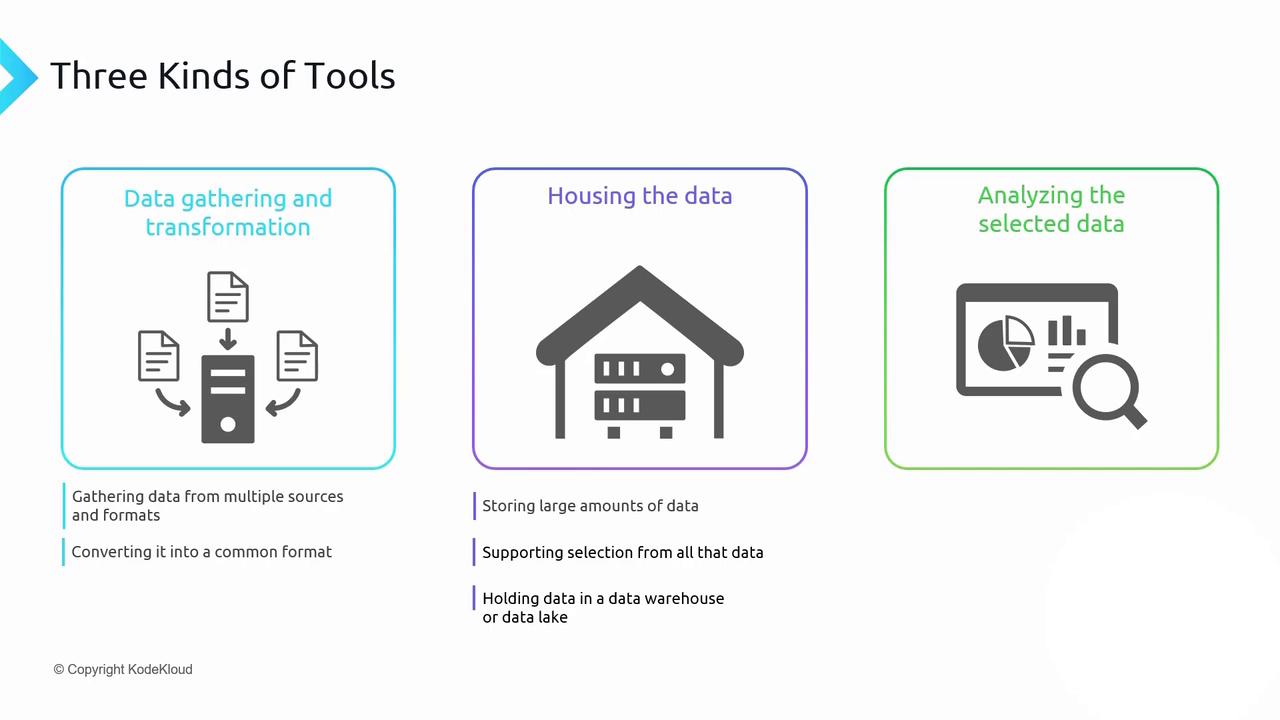
After loading, you can run complex queries and generate dashboards using tools like **Power BI** or **Azure Analysis Services**.
***
Data transfer charges apply when moving data across Azure regions. To minimize egress fees, deploy your ETL pipelines and analytical storage within the **same region** as your source systems.