> ## Documentation Index
> Fetch the complete documentation index at: https://notes.kodekloud.com/llms.txt
> Use this file to discover all available pages before exploring further.
# Power BI Service
> Power BI Service is a platform for sharing, collaborating, and automating data refresh on Power BI reports, focusing on secure distribution and user access.
Power BI Service is the cloud- or on-premises delivery platform for sharing, collaborating, and automating data refresh on your Power BI reports. While Power BI Desktop focuses on report creation, the Service handles secure distribution, user access, and scheduled updates.
## Licensing and Access
When you install Power BI Desktop (free), you automatically receive a **trial subscription** (30–90 days) to the cloud Power BI Service. Upgrading to a Pro or Premium license grants you **permanent** Service access. Once your report is ready in Desktop, you **publish** it to the Service so that colleagues can view and interact with it online.
| License Type | Desktop Version | Service Access | Duration |
| ------------- | --------------------------- | ---------------- | ---------- |
| Free Trial | Power BI Desktop (free) | Power BI Service | 30–90 days |
| Pro / Premium | Power BI Desktop (licensed) | Power BI Service | Permanent |
## Workspaces
Workspaces are collaborative containers for dashboards, reports, and datasets. You assign users to a workspace and manage permissions centrally.
| Role | Permissions |
| ----------- | --------------------------------------------------- |
| Admin | Add/remove users, publish, modify, delete content |
| Member | Publish and update existing content |
| Contributor | Create and publish new content |
| Viewer | View and interact with published dashboards/reports |
Use workspace roles to limit who can edit datasets or dashboards. Assign the Viewer role when you want read-only access.
## Reports vs. Datasets
When published, Power BI separates a **report** (visual layout and definitions) from its **dataset** (data model and transformations). This design enables:
1. **Reusing Data**\
Build multiple reports on the same dataset without duplicating storage or maintenance.
2. **Automated Refreshes**\
Schedule refreshes based on the dataset’s lineage (data sources and Power Query steps) to ensure up-to-date analytics.
Learn more about [Power BI datasets and dataflows](https://learn.microsoft.com/power-bi/connect-data/service-dataflows-overview).
## Dashboards
A **dashboard** is a single-page, consolidated view of visuals (tiles) pinned from one or multiple reports—even across different datasets. Dashboards are ideal for at-a-glance monitoring but offer limited drill-through compared to reports.
You can pin:
* Individual charts or KPI tiles
* Entire report pages
Dashboards refresh only when their underlying datasets refresh. To see the latest data, ensure your dataset schedule aligns with your reporting needs.
## Apps
**Apps** bundle related dashboards and reports from a workspace into a streamlined package. When end users need consistent access to a suite of analytics, publishing an app simplifies installation and ensures version control.
* Apps support centralized updates.
* Consumers install or update with a single click.
## Paginated Reports
For pixel-perfect, printable outputs—such as invoices or operational reports—Power BI supports **paginated reports** (built on SQL Server Reporting Services). These page-oriented documents excel at large tabular data exports, formatted headers/footers, and precise pagination.
## Cloud vs. On-Premises Service
Power BI Service is available as:
* **Cloud Service** (app.powerbi.com) – hosted by Microsoft
* **On-Premises Report Server** – deployed within your data center
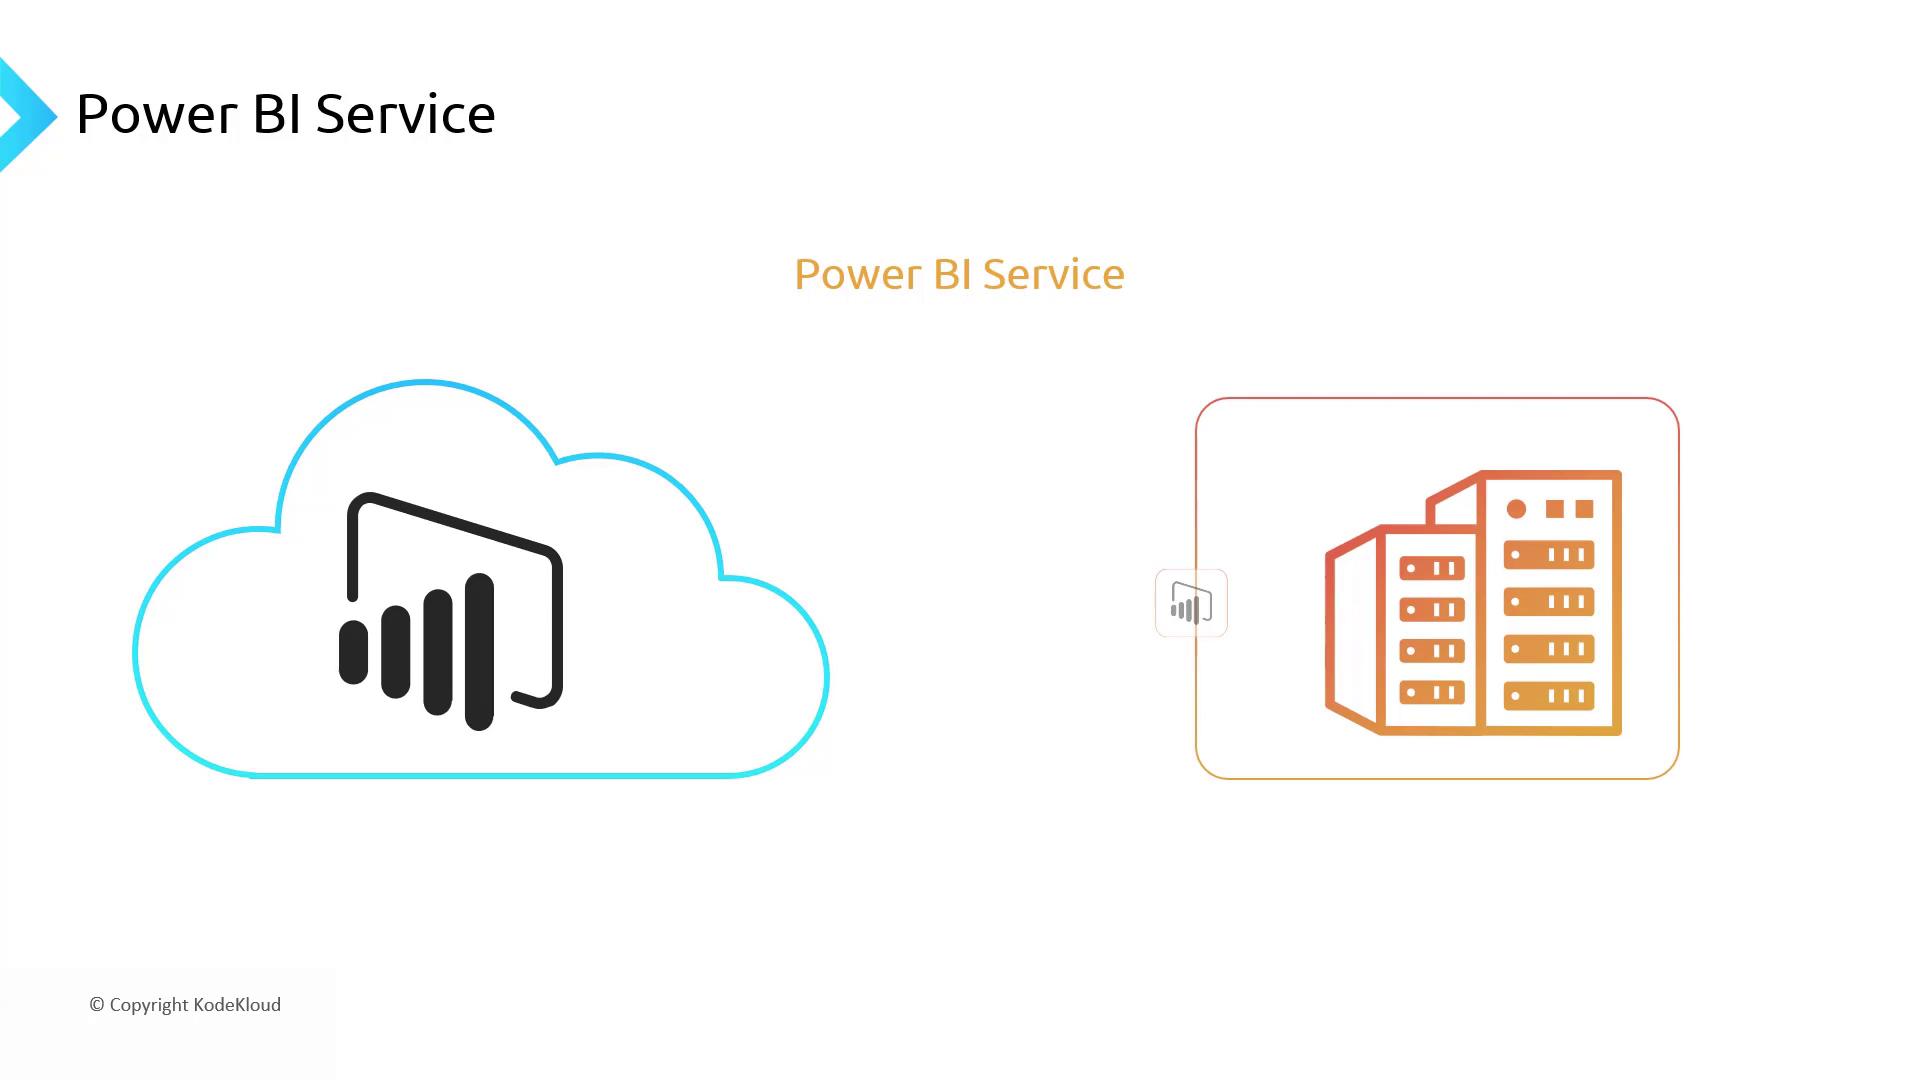
If your cloud workspace accesses on-premises data, you must install and configure a **data gateway** to bridge secure connections.
Without a properly configured on-premises data gateway, your cloud datasets cannot refresh against local data sources.
## References
* [Power BI Workspaces](https://learn.microsoft.com/power-bi/collaborate-share/service-create-workspaces)
* [Understanding Dashboards in Power BI](https://learn.microsoft.com/power-bi/create-reports/service-dashboards)
* [Deploying Paginated Reports](https://learn.microsoft.com/sql/reporting-services/paginated-reports)