DP-900: Microsoft Azure Data Fundamentals

Analyzing Data

Reporting

Welcome back to the Azure Data Fundamentals DP-900 course. In this module, we explore reporting through Microsoft Power BI—your end-to-end platform for data analysis, from ingestion to distribution.

When we discuss “reporting” in the Microsoft ecosystem, we mean Power BI. Think of it as two distinct phases:

  1. Building interactive visualizations
  2. Distributing those reports to end users
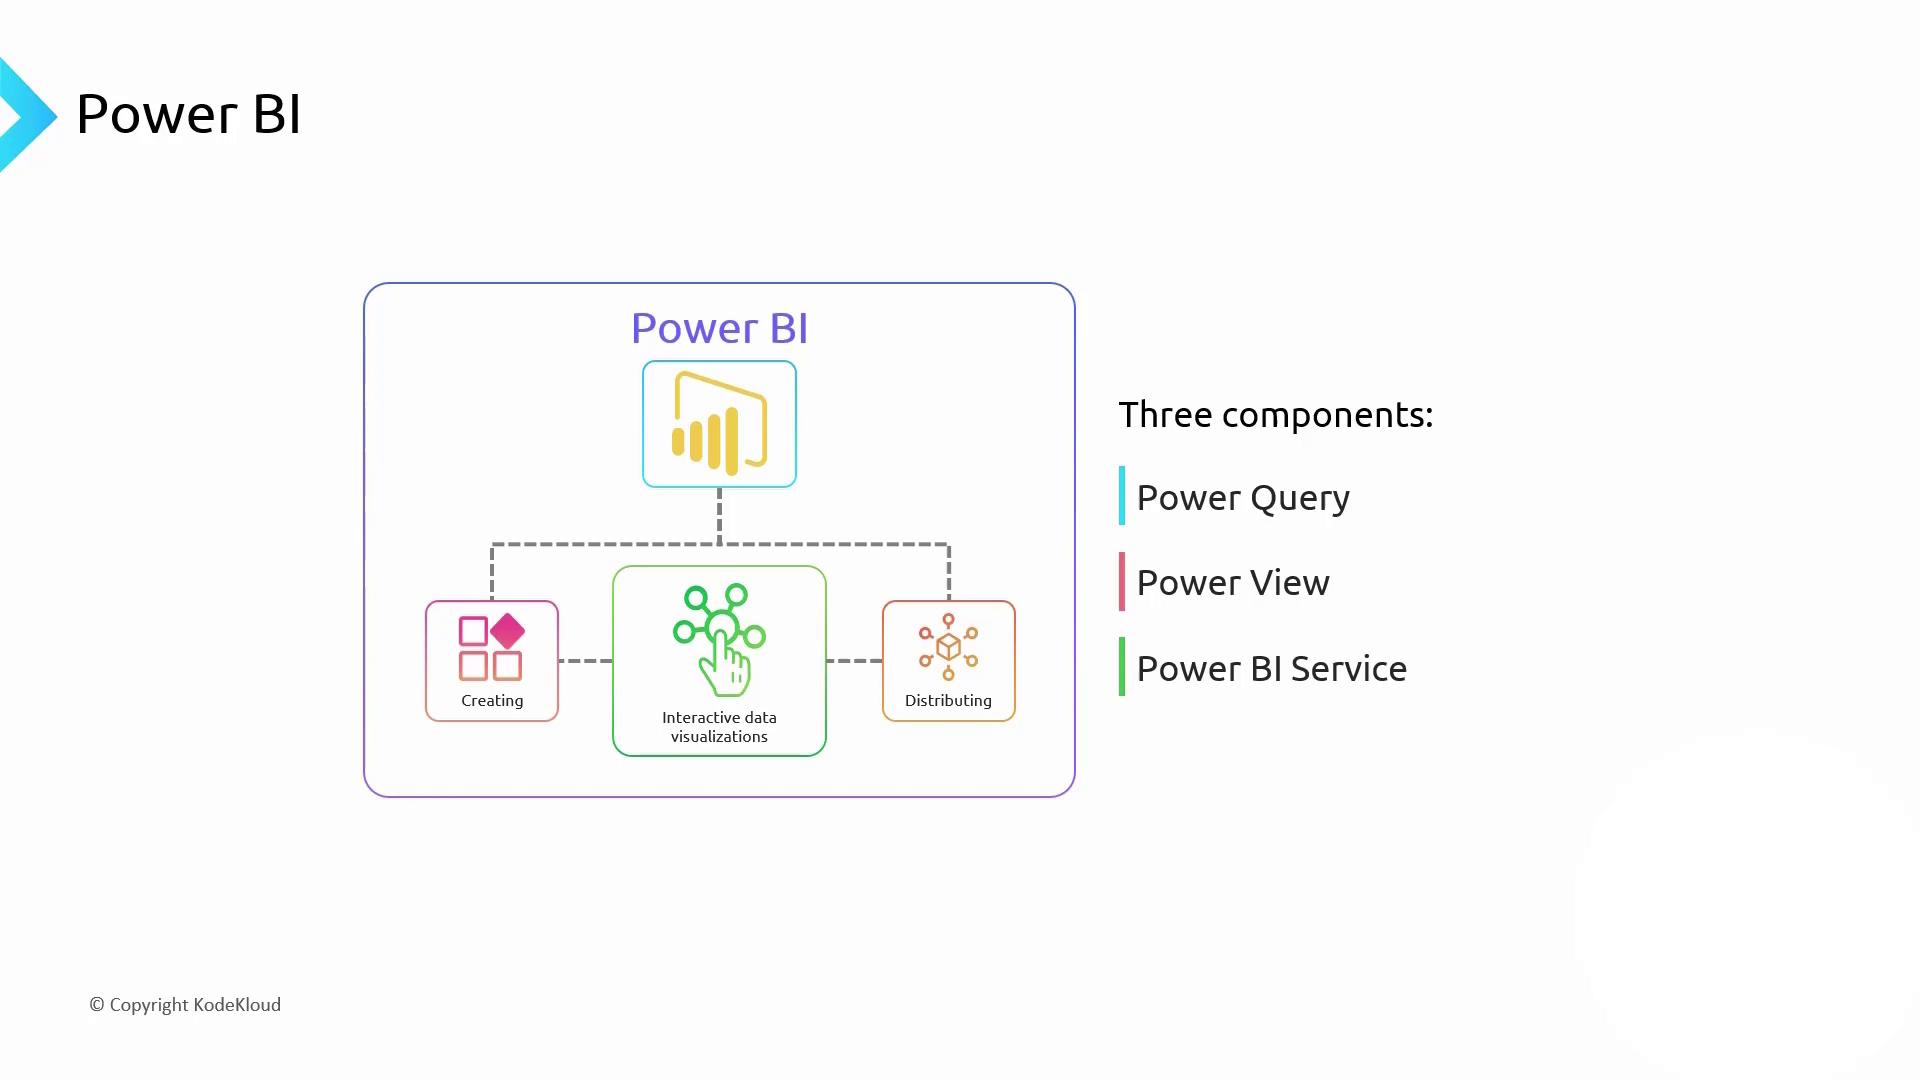
Under the hood, Power BI’s design phase relies on Power Query and Power View, while publishing and sharing are handled by the Power BI Service.

The image illustrates the components of Power BI, highlighting its three main parts: Power Query, Power View, and Power BI Service, along with their roles in creating, visualizing, and distributing data.

Power BI Desktop: Create and Design

Power BI Desktop (formerly Power BI Designer) is the free Windows client that combines Power Query and Power View into a single workspace. Both the free and Pro versions offer full design capabilities, with Pro removing dataset size limits and adding collaboration features.
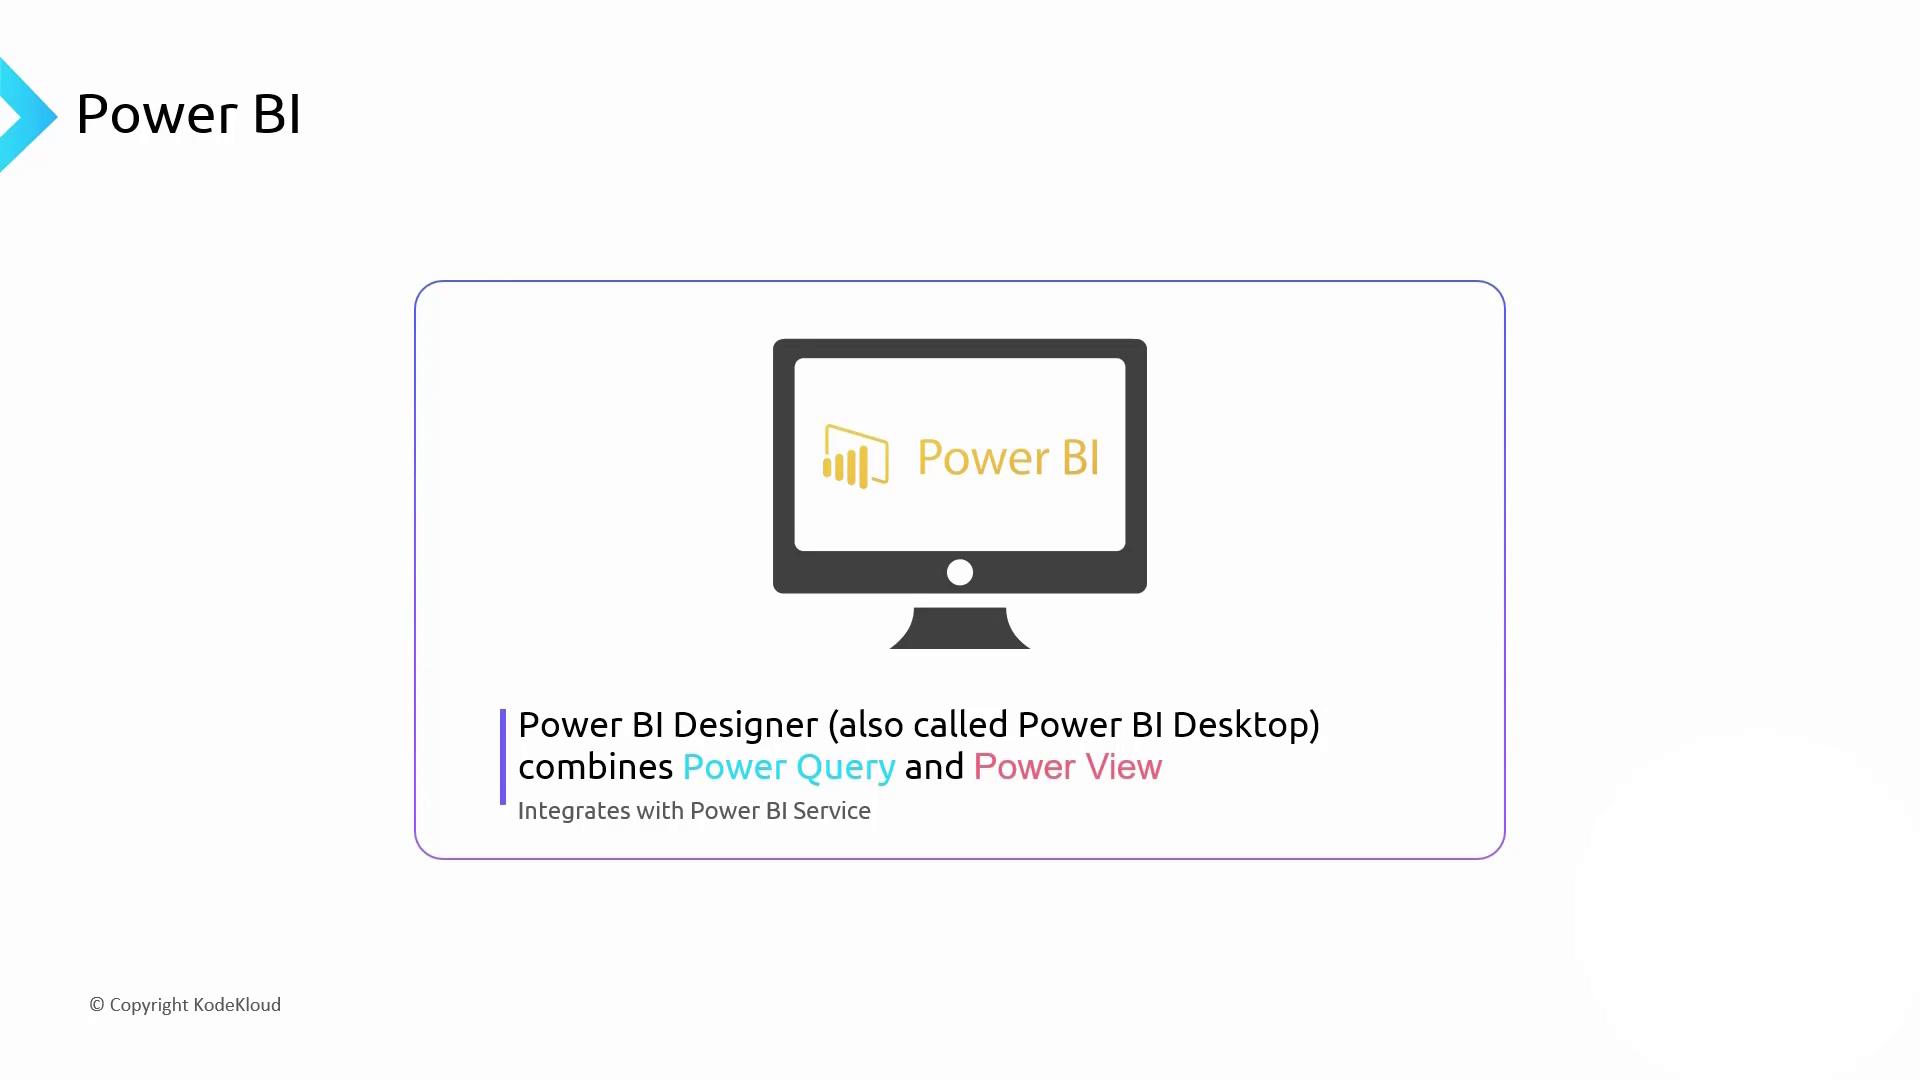
The image is an illustration of Power BI, showing a computer screen with the Power BI logo. It describes Power BI Designer (also called Power BI Desktop) as combining Power Query and Power View, and mentions integration with Power BI Service.

1. Power Query: Extract, Transform, Load (ETL)

Power Query is where you connect to sources, shape data, and load it into your Power BI dataset. Common transformations include:

  • Joining or splitting tables
  • Cleaning invalid or null values
  • Filtering out unneeded rows

Every step is recorded in M code, forming an ETL pipeline that reruns on each refresh.

The image is about Power Query, highlighting its ability to customize the ETL process and create datasets for Power BI reports.

Note

Power Query’s step-by-step transformation ensures reproducibility. When you refresh, only the final query runs against the source.

Import vs. DirectQuery

ModeCharacteristicsWhen to Use
ImportData is loaded into Power BI’s in-memory engine. Fast interaction.Datasets under size limit, offline analysis.
DirectQueryQueries the source in real time. No import limits but slower visuals.Large tables, always-up-to-date dashboards.

Warning

DirectQuery can add query latency to visuals. Always test performance when using live connections.

2. Power View: Design Interactive Reports

Once data is loaded or connected, switch to Power View to craft visuals. Power BI Desktop offers over 40 built-in charts plus community-driven custom visuals. Visual interactions mean selecting one chart filters the rest, and date slicers dynamically slice time-series data.
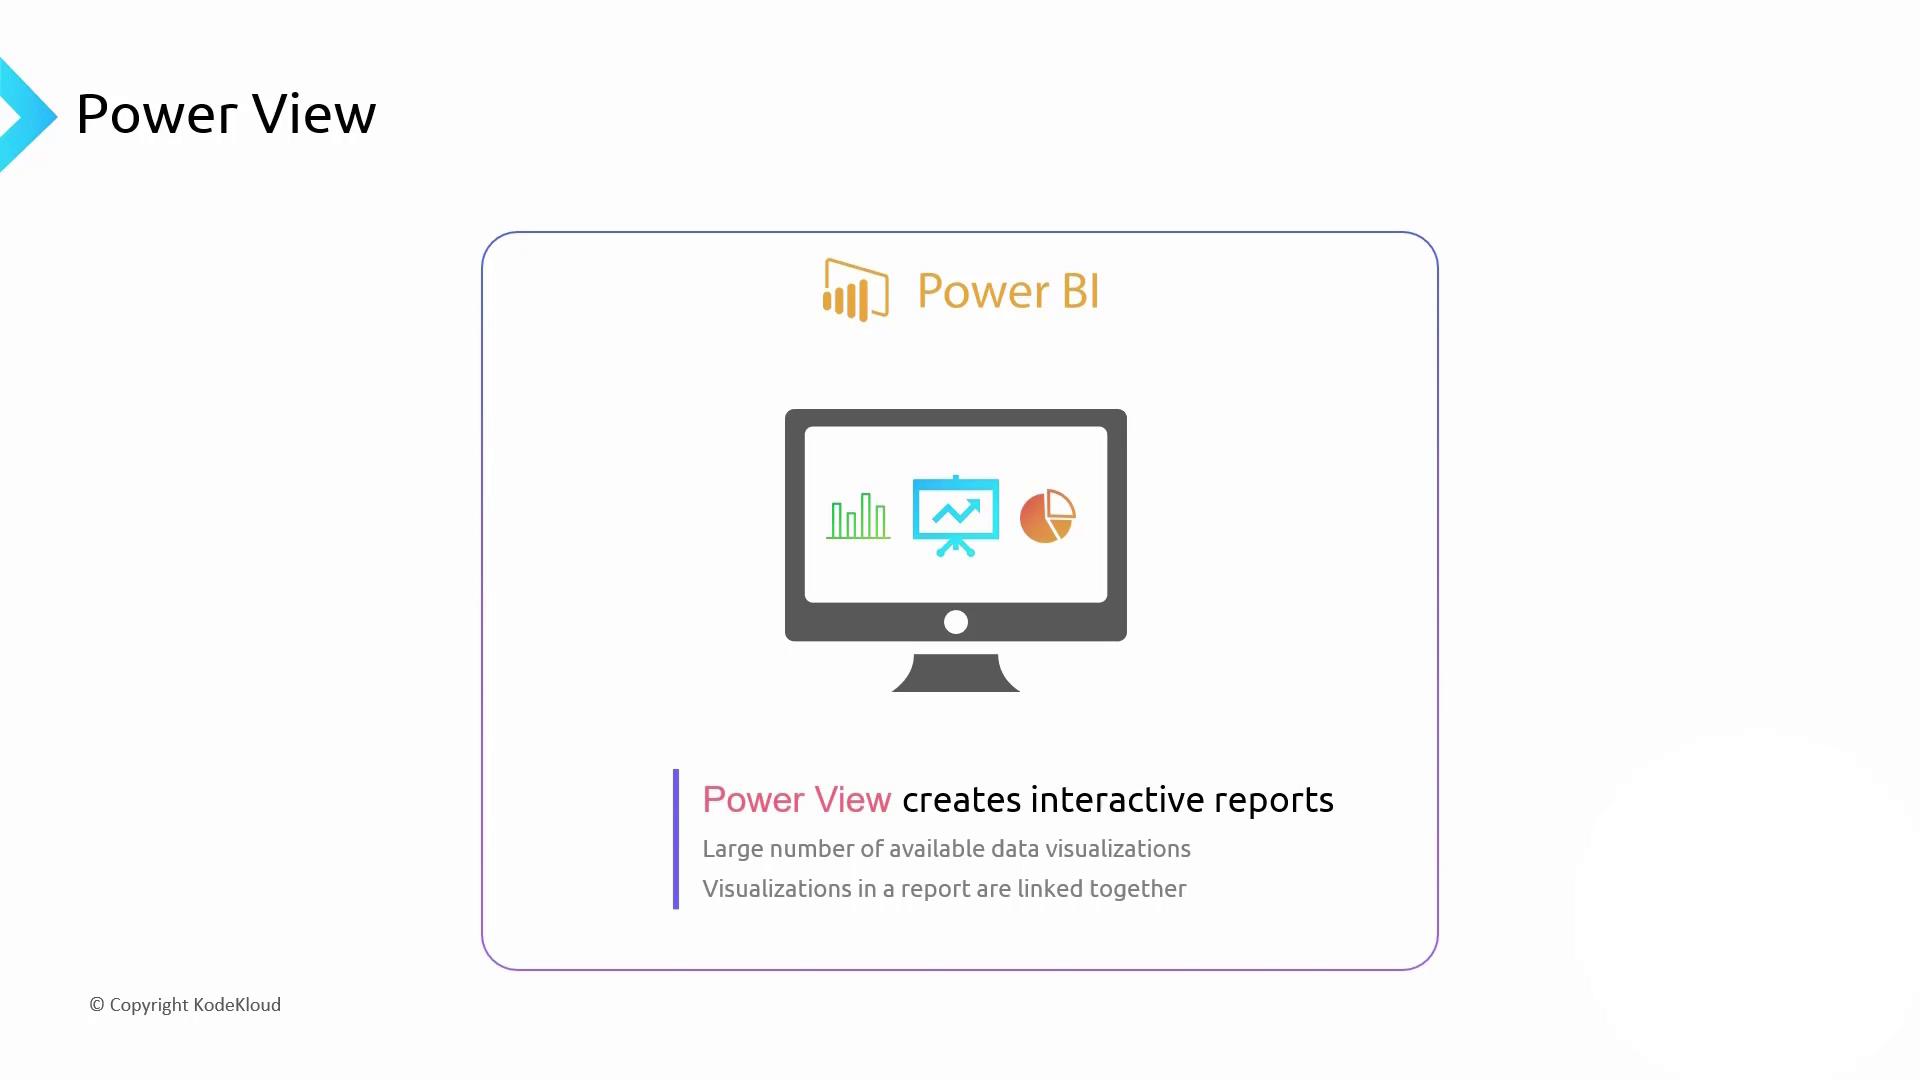
The image is an illustration related to Power BI, highlighting Power View's capability to create interactive reports with various data visualizations.

Filtering, Slicers & Hierarchies

  • Slicers for on-canvas filtering
  • Drill-down/up through hierarchies (Region → Country → City → Customer)
  • Automatic date hierarchies (Year → Quarter → Month → Week)

The image is a Power BI Desktop slide showing a computer monitor with a filter icon, highlighting features like user interactivity, filtering, and creating hierarchies.

Data Modeling in Power BI

Central to unified reporting is a robust data model. Power BI lets you:

  • Import tables from Excel, Azure SQL Database, Cosmos DB, and more
  • Auto-detect relationships by column names or define them manually
  • Build star or snowflake schemas with fact and dimension tables
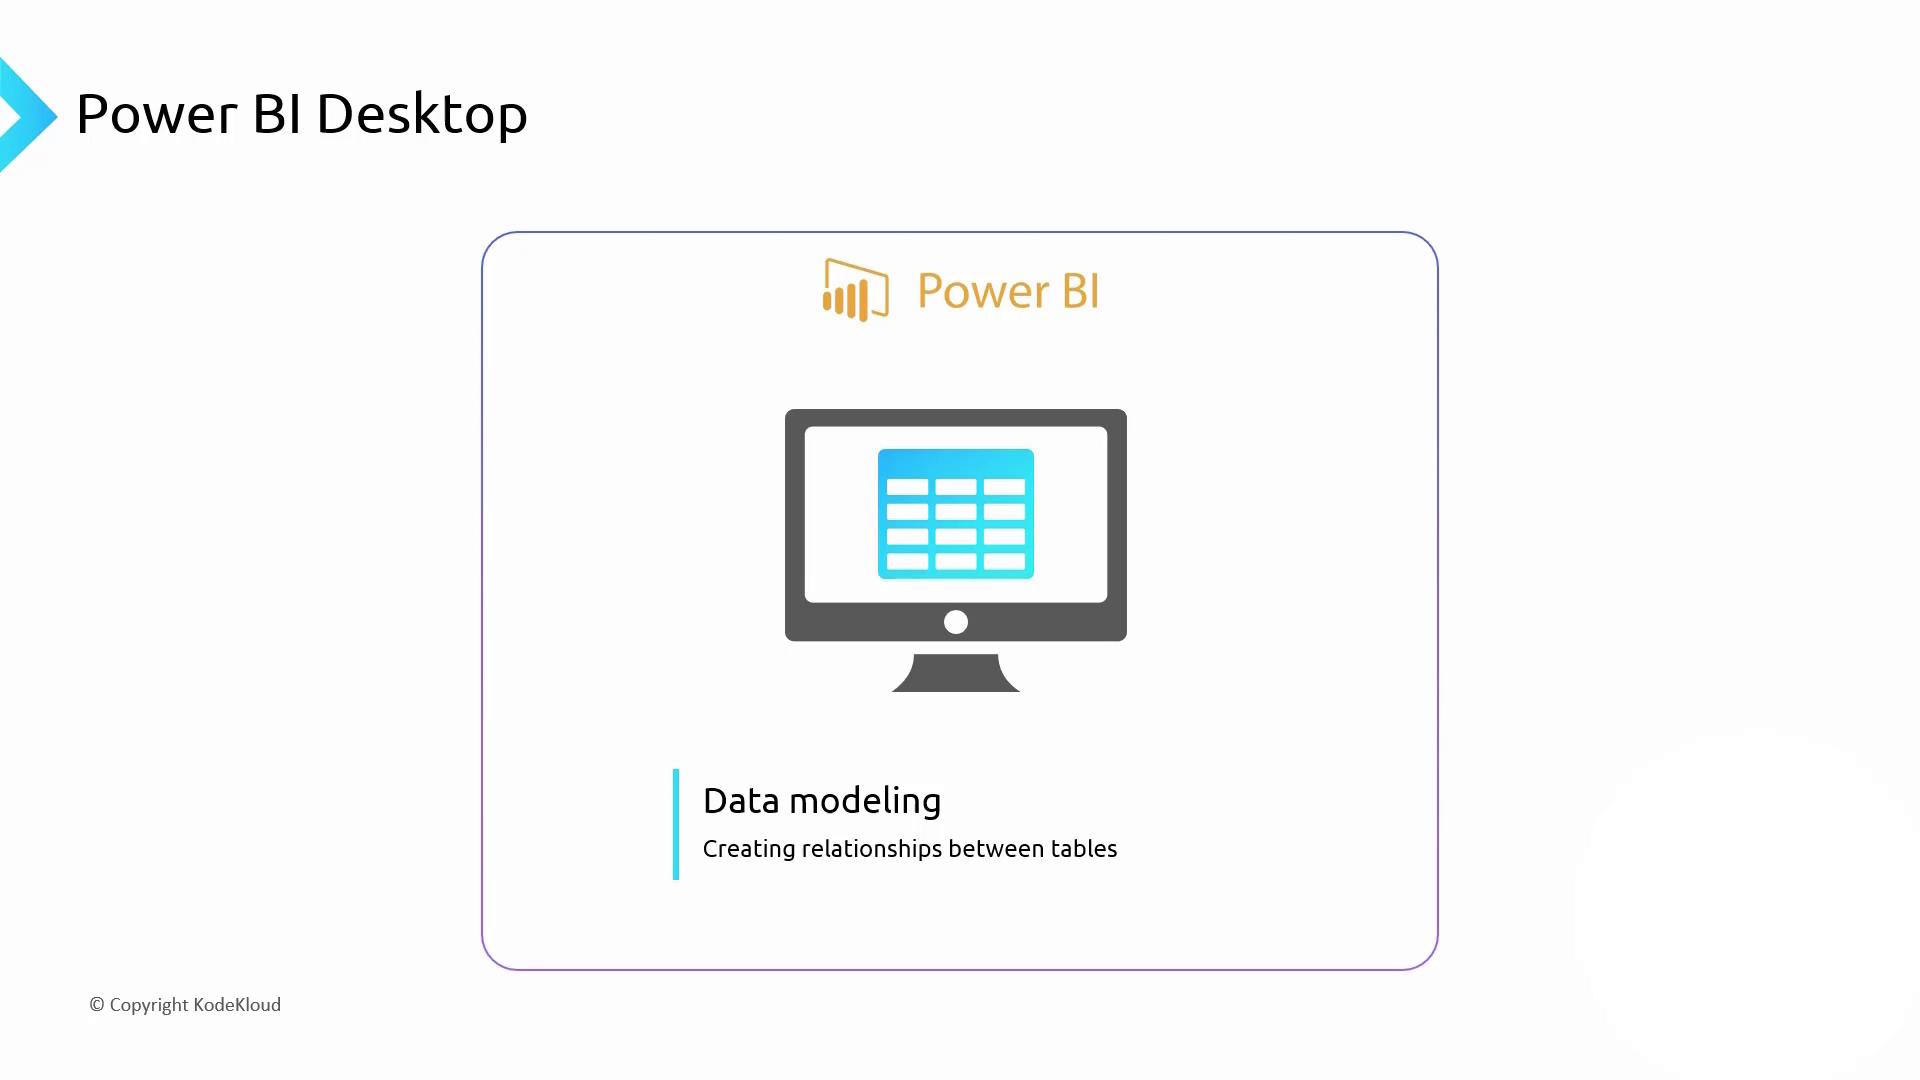
The image is an illustration related to Power BI Desktop, focusing on data modeling and creating relationships between tables. It features a computer monitor icon with a table graphic.

Note

In modeling view, drag to create relationships or adjust cardinality and cross-filter direction for accurate joins.
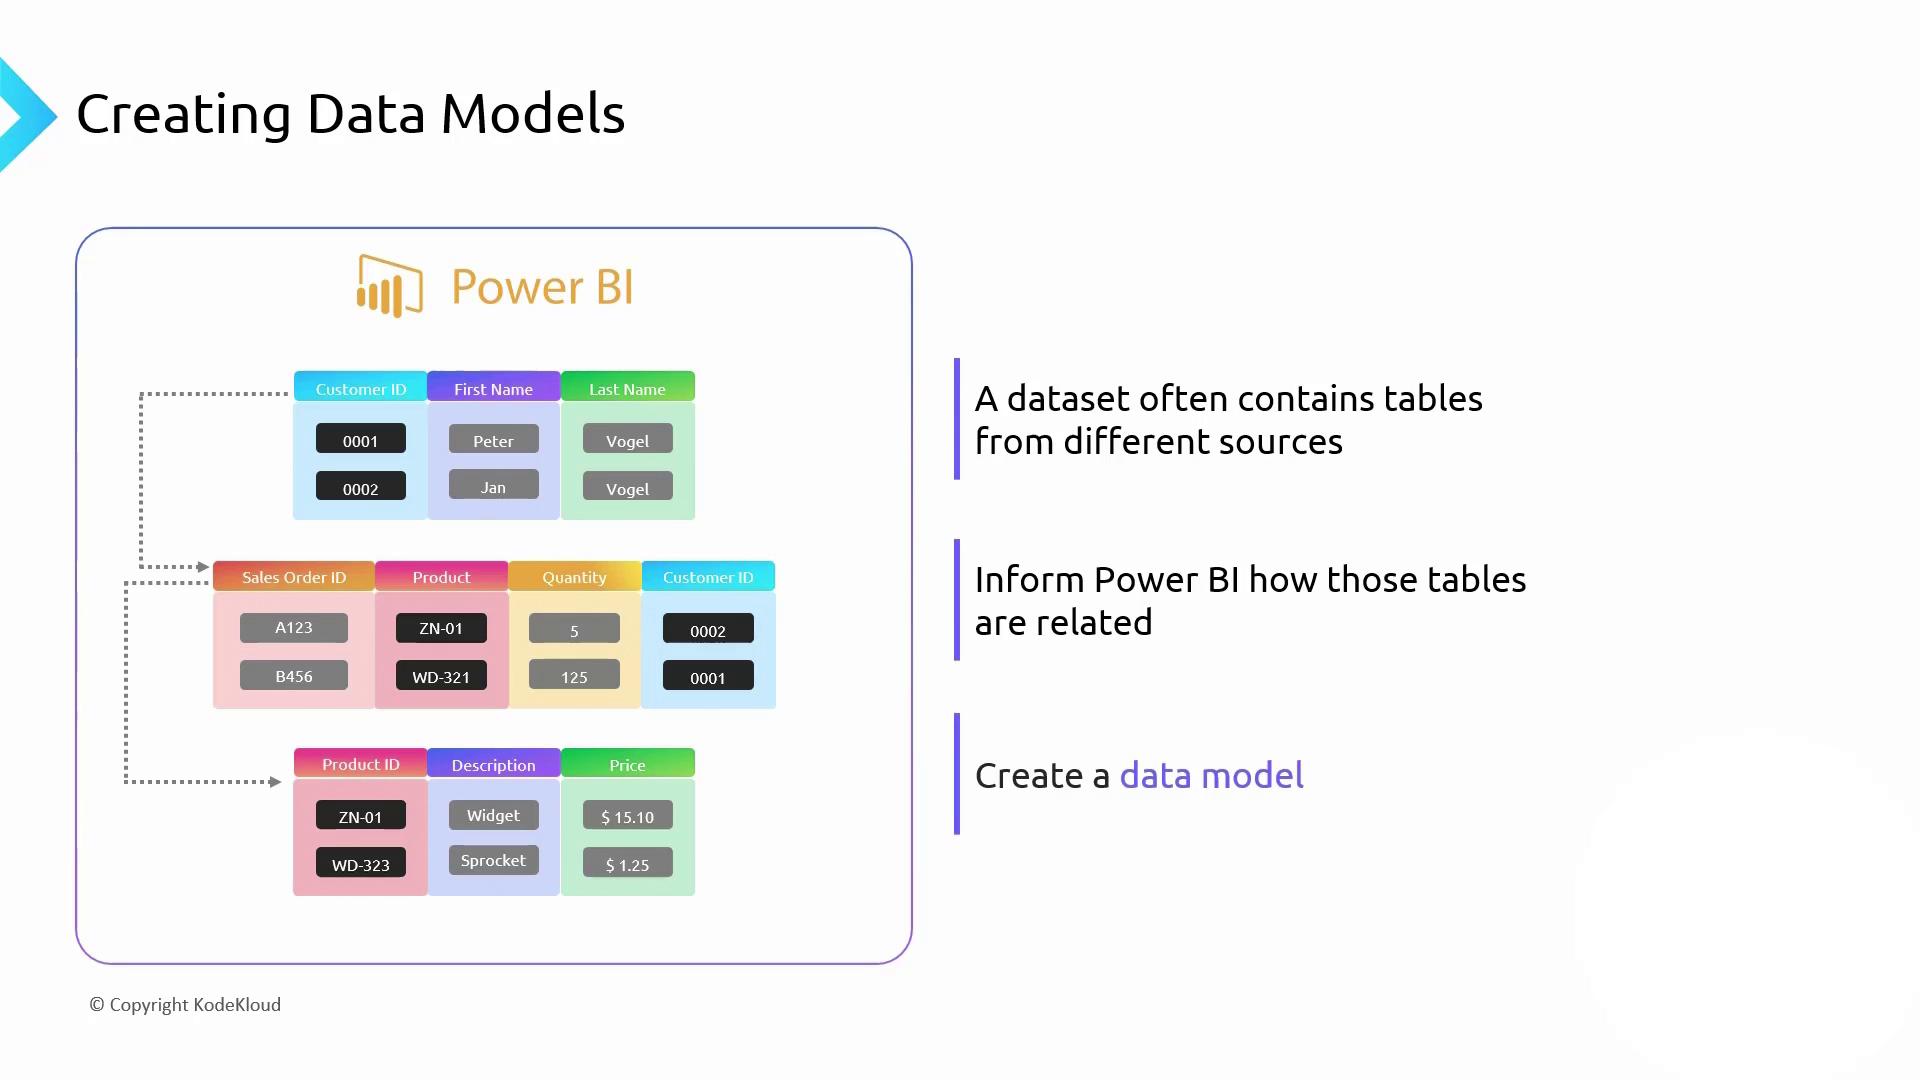
Once relationships are in place, your reports draw on a coherent, interrelated dataset:

The image illustrates the process of creating data models in Power BI, showing how different tables from various sources are related. It includes a visual representation of tables with customer, sales, and product information.

Next Steps

By leveraging Power Query, Power View, and the Power BI Service, you can extract, transform, model, visualize, and distribute insights across your organization.


Watch Video

Watch video content

Previous
Analyzing Data