> ## Documentation Index
> Fetch the complete documentation index at: https://notes.kodekloud.com/llms.txt
> Use this file to discover all available pages before exploring further.
# Introduction to Kodekloude Application
> Guide to running and observing the KodeKloud Record Store demo app locally, covering architecture, Docker Compose setup, Prometheus, Grafana, Jaeger, Loki and telemetry endpoints.
Welcome — this guide walks through the KodeKloud Record Store web app (a small demo) and shows how the core application and a full observability stack are wired together for local development and experimentation.
The repository is available on GitHub: `jakepage91/kodekloud-records-store-web-app`. Fork and experiment — the app is intentionally simple so you can apply observability and distributed-systems concepts to your own projects.
This article summarizes:
* the repository layout,
* architecture and request/data flow,
* how to run the stack locally (application + observability),
* quick verification and troubleshooting commands,
* useful endpoints and scripts for generating telemetry.
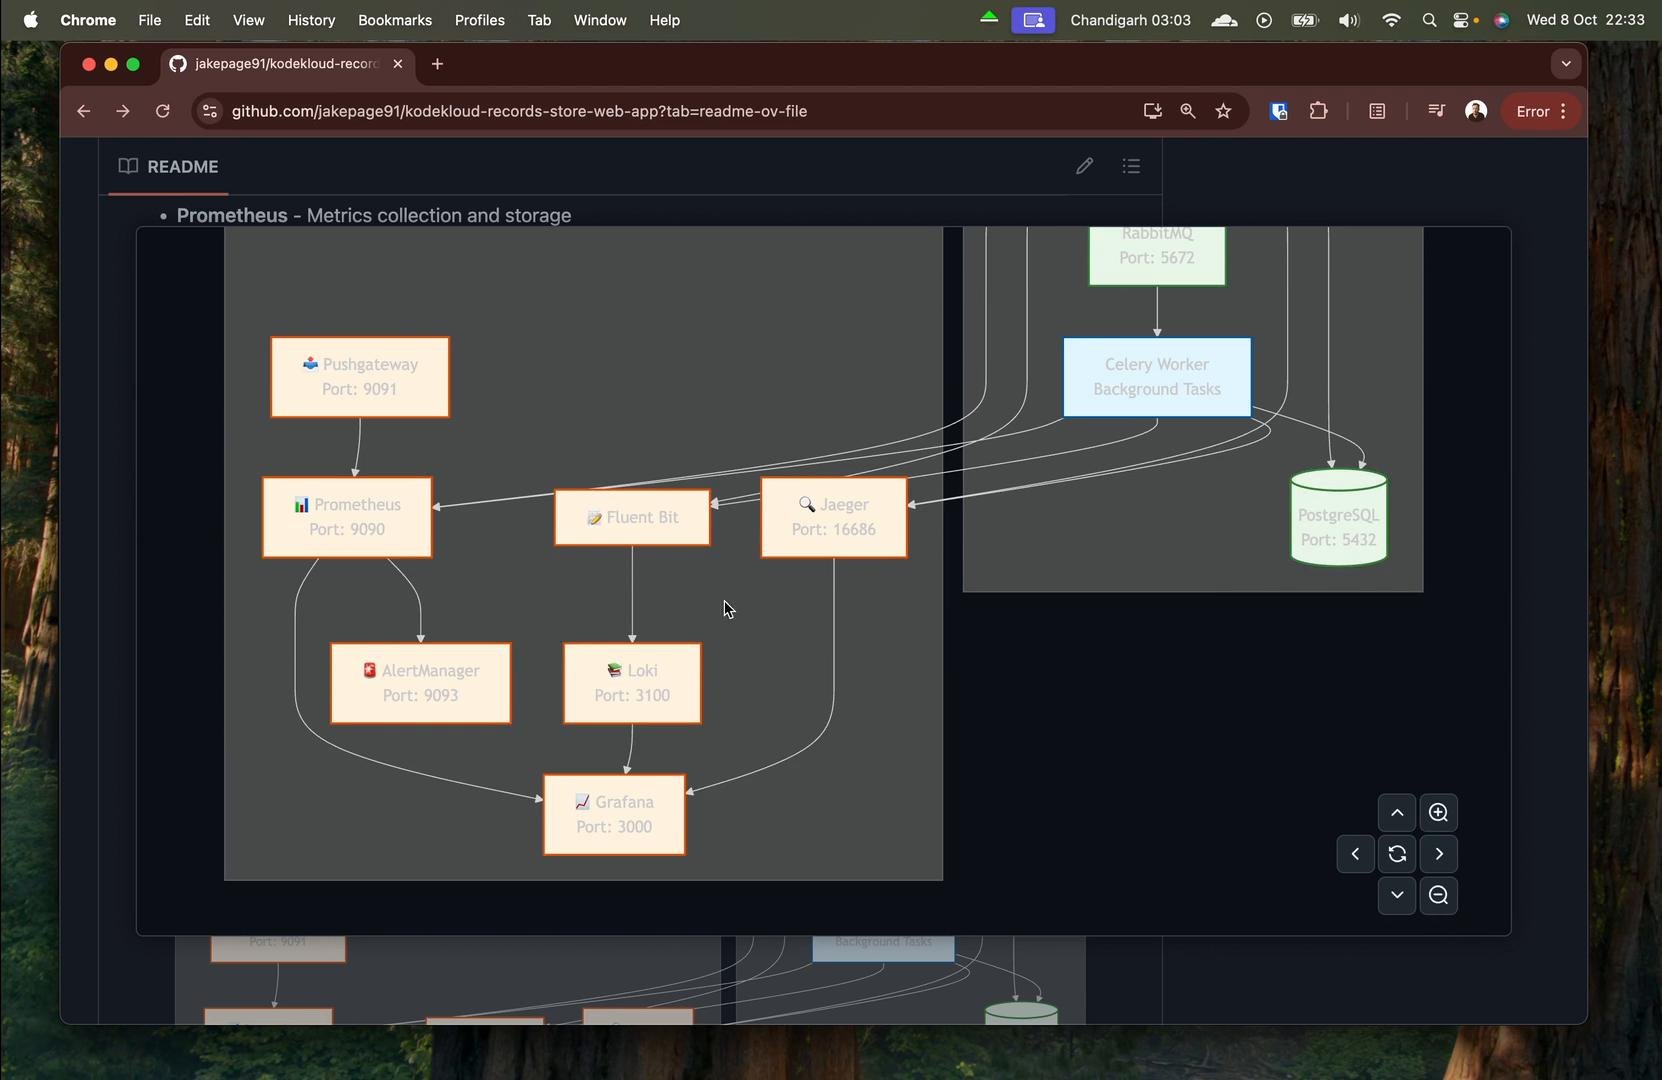
Architecture overview
The project is split into two logical groups:
* Core application: FastAPI web service + Celery worker for background tasks, backed by PostgreSQL and RabbitMQ.
* Observability stack: Prometheus, Pushgateway, Alertmanager, Grafana, Loki, Fluent Bit, Jaeger, and supporting exporters/collectors.
Textually, the system is a set of services connected on a Docker network. The FastAPI API (port 8000) interacts with PostgreSQL (5432) and RabbitMQ (5672, management 15672); Prometheus (9090) scrapes metrics and can receive pushed metrics via Pushgateway (9091); Grafana (3000) reads dashboards from Prometheus and Loki; Jaeger exposes tracing (UI 16686 and OTLP/collector ports such as 14268, 4317/4318); Fluent Bit/Loki handle log collection and storage. These services and ports are defined and wired in the compose file and the monitoring configuration.
 Request / data flow
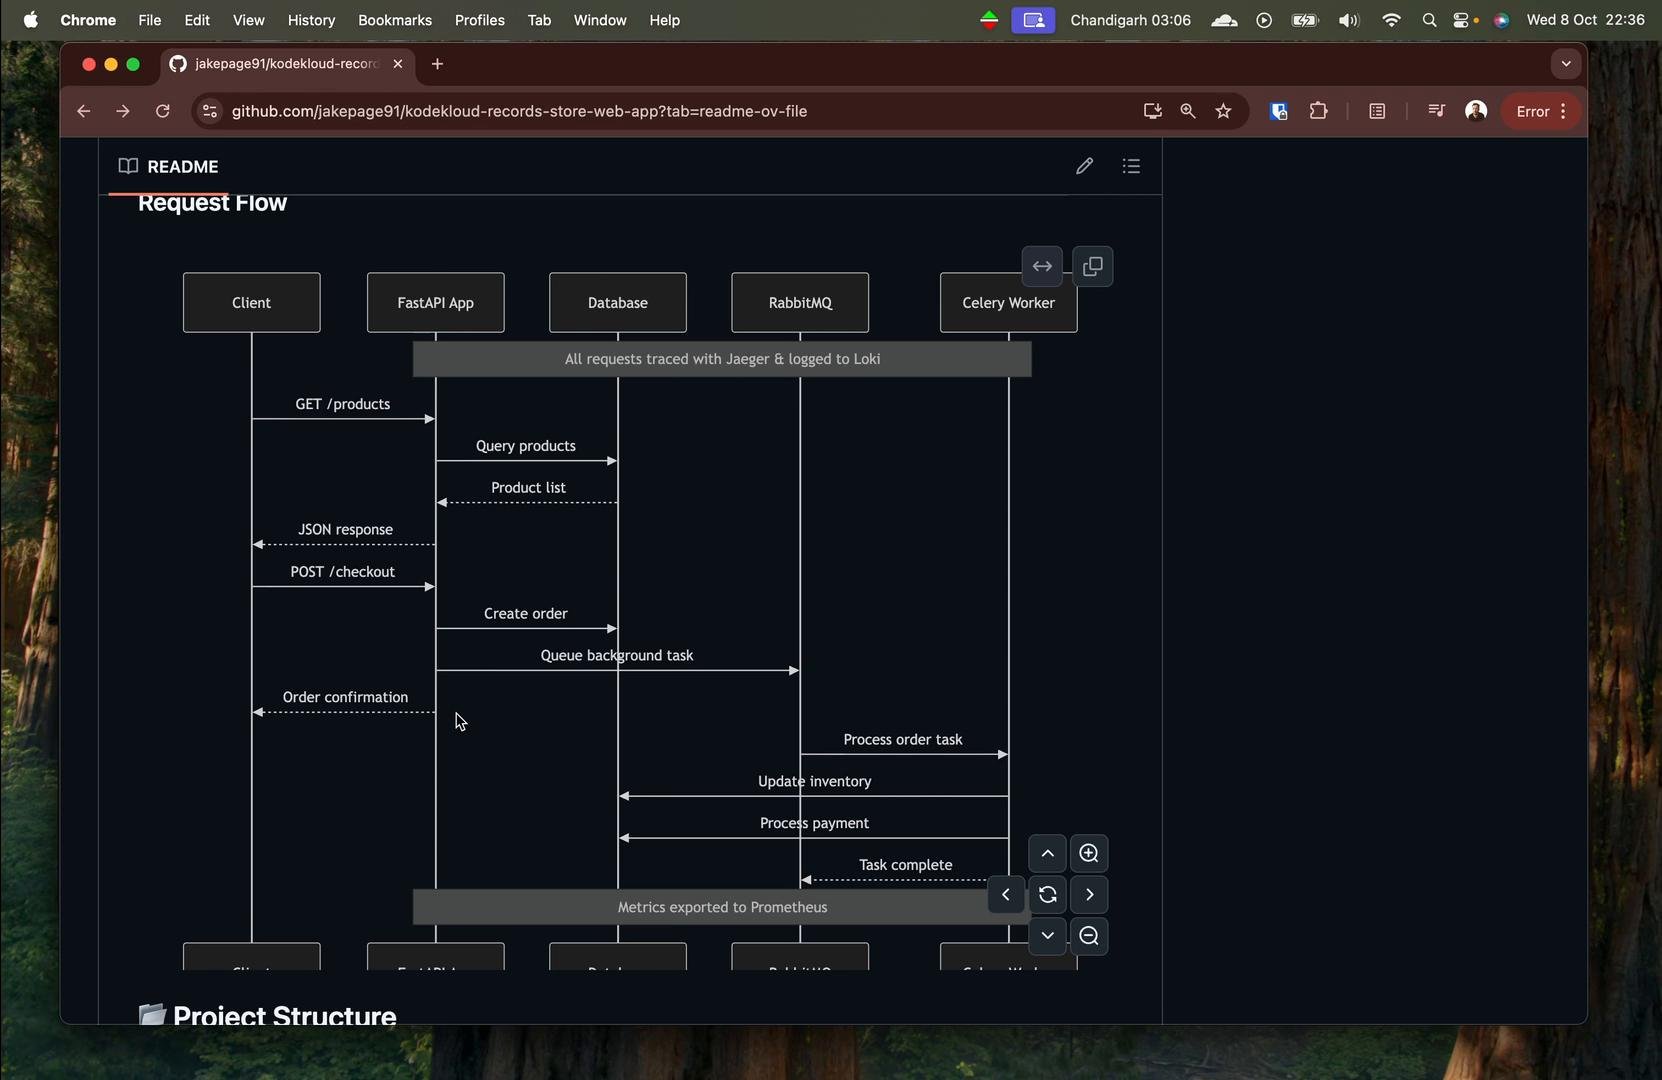
Different endpoints exercise different parts of the stack:
* GET /products — FastAPI → PostgreSQL. (Synchronous API + DB read.)
* POST /checkout — FastAPI enqueues an order to RabbitMQ; Celery workers consume the queue, process payment/inventory asynchronously, and update the database. Telemetry (metrics, logs, traces) is emitted across these steps.
Typical end-to-end flow:
Client → FastAPI → Database (query) → RabbitMQ (enqueue) → Celery worker (background processing) → Database (update)
Telemetry is collected at each phase (Prometheus metrics, application logs forwarded by Fluent Bit to Loki, and traces exported to Jaeger/OpenTelemetry).
Request / data flow
Different endpoints exercise different parts of the stack:
* GET /products — FastAPI → PostgreSQL. (Synchronous API + DB read.)
* POST /checkout — FastAPI enqueues an order to RabbitMQ; Celery workers consume the queue, process payment/inventory asynchronously, and update the database. Telemetry (metrics, logs, traces) is emitted across these steps.
Typical end-to-end flow:
Client → FastAPI → Database (query) → RabbitMQ (enqueue) → Celery worker (background processing) → Database (update)
Telemetry is collected at each phase (Prometheus metrics, application logs forwarded by Fluent Bit to Loki, and traces exported to Jaeger/OpenTelemetry).
 Repository layout
Top-level structure (core app + observability):
```text theme={null}
kodekloud-records-store-web-app/
├── src/
│ └── api/
│ ├── main.py # FastAPI application entry point
│ ├── routes.py # API endpoints (products, orders, checkout)
│ ├── models.py # Database models (Product, Order)
│ ├── database.py # Database connection and session management
│ ├── worker.py # Celery background tasks
│ ├── telemetry.py # OpenTelemetry setup
│ └── metrics.py # Prometheus metrics definitions (BEST PRACTICES)
│ └── requirements.txt # Python dependencies
├── config/
│ └── monitoring/ # Observability configuration
│ ├── prometheus.yml
│ ├── alertmanager.yml
│ ├── alert_rules.yml
│ ├── sli_rules.yml
│ └── grafana-provisioning/
├── deploy/
│ └── environments/ # Environment configuration
│ ├── setup-local-env.sh # Environment setup script
│ └── templates/
│ ├── env.dev.template
│ ├── env.staging.template
│ └── env.prod.template
├── scripts/
│ ├── generate_logs.sh
│ └── demo_request_correlation.sh
├── docker-compose.yaml
├── Dockerfile
├── test_traffic.sh
└── black_box_monitor.sh
```
Get started (local development)
1. Clone the repository and change into it:
```bash theme={null}
git clone https://github.com/jakepage91/kodekloud-records-store-web-app.git
cd kodekloud-records-store-web-app
```
2. Generate a development `.env` with safe defaults:
```bash theme={null}
# Create deploy/environments/.env.dev from the template
./deploy/environments/setup-local-env.sh
```
Sample output from the setup script:
```text theme={null}
🛠 Setting up local development environment configuration
============================================================
⚠️ deploy/environments/.env.dev already exists. Backup created as deploy/environments/.env.dev.backup
📄 Creating deploy/environments/.env.dev from template...
✅ Development environment configured with safe defaults
📝 For staging and production environments:
1. Copy the template files manually
2. Replace ${VARIABLE} placeholders with actual values
3. Store sensitive values in CI/CD secrets, not in files
🎯 Next steps:
1. Run: docker-compose --env-file deploy/environments/.env.dev up
2. For production: Set up GitHub secrets for sensitive values
🔒 Security reminder: Never commit files with real passwords!
```
Example `.env.dev` values used by the compose file:
```env theme={null}
# Application Settings
DEBUG=true
LOG_LEVEL=DEBUG
WEB_PORT=8000
# Message Queue
RABBITMQ_HOST=rabbitmq
# Monitoring & Observability
GRAFANA_ADMIN_PASSWORD=dev_admin_123
PROMETHEUS_RETENTION_TIME=7d
# OpenTelemetry
OTEL_SERVICE_NAME=kodekloud-record-store-api-dev
OTEL_EXPORTER_OTLP_ENDPOINT=http://jaeger:4317
OTEL_EXPORTER_OTLP_PROTOCOL=grpc
OTEL_TRACES_SAMPLER=parentbased_always_on
# Prometheus Pushgateway
PROMETHEUS_PUSHGATEWAY=pushgateway:9091
# Python Path
PYTHONPATH=/app/src
# Environment Tag
ENVIRONMENT=development
```
Do not commit real passwords or secrets to the repository. Keep sensitive values in CI/CD secrets or a secure secret store.
Docker Compose and services
A single `docker-compose.yaml` composes the application and all observability services. The `api` service is built from the local Dockerfile and depends on `db`, `rabbitmq`, `jaeger`, `fluent-bit`, and others to be available.
Example excerpts from the compose file (application and supporting services):
```yaml theme={null}
services:
api:
build:
context: .
dockerfile: Dockerfile
container_name: kodekloud-record-store-api
restart: always
depends_on:
- db
- rabbitmq
- jaeger
- fluent-bit
ports:
- "${WEB_PORT:-8000}:8000"
environment:
POSTGRES_HOST: ${POSTGRES_HOST}
POSTGRES_DB: ${POSTGRES_DB}
POSTGRES_USER: ${POSTGRES_USER}
POSTGRES_PASSWORD: ${POSTGRES_PASSWORD}
RABBITMQ_HOST: ${RABBITMQ_HOST}
PYTHONPATH: ${PYTHONPATH}
OTEL_SERVICE_NAME: ${OTEL_SERVICE_NAME}
OTEL_EXPORTER_OTLP_ENDPOINT: ${OTEL_EXPORTER_OTLP_ENDPOINT}
OTEL_EXPORTER_OTLP_PROTOCOL: ${OTEL_EXPORTER_OTLP_PROTOCOL}
OTEL_TRACES_SAMPLER: ${OTEL_TRACES_SAMPLER}
OTEL_PROPAGATORS: "tracecontext,baggage"
DEBUG: ${DEBUG}
LOG_LEVEL: ${LOG_LEVEL}
db:
image: postgres:15
container_name: kodekloud-record-store-db
restart: always
environment:
POSTGRES_DB: ${POSTGRES_DB}
POSTGRES_USER: ${POSTGRES_USER}
POSTGRES_PASSWORD: ${POSTGRES_PASSWORD}
ports:
- "5432:5432"
volumes:
- postgres_data:/var/lib/postgresql/data
networks:
- kodekloud-record-store-net
rabbitmq:
image: "rabbitmq:3-management"
container_name: kodekloud-record-store-rabbitmq
restart: always
ports:
- "5672:5672"
- "15672:15672"
volumes:
- rabbitmq_data:/var/lib/rabbitmq
networks:
- kodekloud-record-store-net
```
Observability services (Prometheus, Pushgateway, Grafana, Alertmanager, Loki, Fluent Bit, Jaeger and others) are defined in the same `docker-compose.yaml` and connected to the shared network. Example service entries and ports:
```yaml theme={null}
prometheus:
image: prom/prometheus:latest
command:
- '--config.file=/etc/prometheus/prometheus.yml'
- '--storage.tsdb.path=/prometheus'
- '--web.enable-lifecycle'
- '--storage.tsdb.retention.time=${PROMETHEUS_RETENTION_TIME:-15d}'
networks:
- kodekloud-record-store-net
pushgateway:
image: prom/pushgateway:latest
container_name: kodekloud-record-store-pushgateway
ports:
- "9091:9091"
networks:
- kodekloud-record-store-net
grafana:
image: grafana/grafana:11.5.1
container_name: kodekloud-record-store-grafana
ports:
- "3000:3000"
environment:
- GF_SECURITY_ADMIN_PASSWORD=${GRAFANA_ADMIN_PASSWORD}
- GF_USERS_ALLOW_SIGN_UP=false
volumes:
- grafana_data:/var/lib/grafana
- ./config/monitoring/grafana-provisioning:/etc/grafana/provisioning
networks:
- kodekloud-record-store-net
depends_on:
- prometheus
- loki
jaeger:
image: jaegertracing/jaeger:latest
container_name: kodekloud-record-store-jaeger
ports:
- "16686:16686"
- "14268:14268"
- "14250:14250"
- "4317:4317"
- "4318:4318"
environment:
- COLLECTOR_OTLP_ENABLED=true
- COLLECTOR_ZIPKIN_HOST_PORT=:9411
networks:
- kodekloud-record-store-net
```
Quick reference — common service ports
| Service | Purpose | Default ports (local) |
| -: | - | -: |
| API (FastAPI) | Application HTTP API | `8000` |
| PostgreSQL | Relational datastore | `5432` |
| RabbitMQ | Message broker (AMQP + management UI) | `5672`, `15672` |
| Prometheus | Metrics scraping and TSDB | `9090` |
| Pushgateway | Push metrics endpoint | `9091` |
| Grafana | Dashboards | `3000` |
| Jaeger | Tracing UI & OTLP/collector | `16686`, `14268`, `4317`, `4318` |
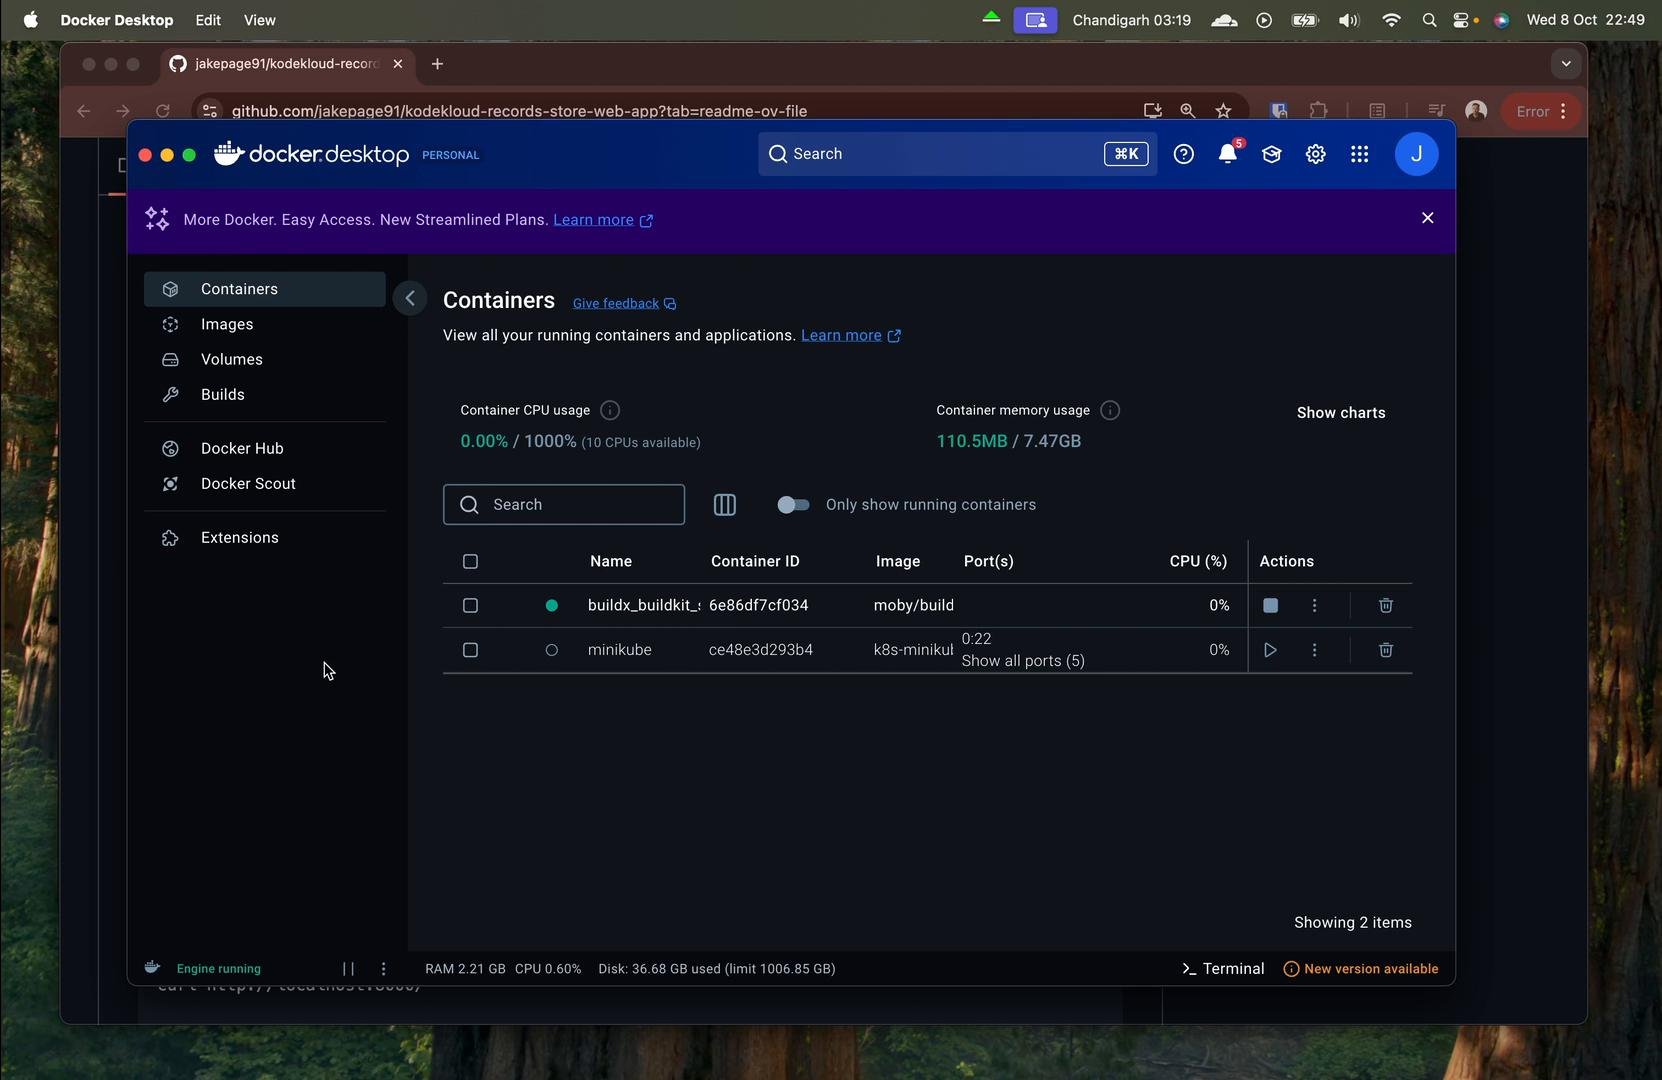
Ensure Docker is running locally
Start your Docker daemon first (Docker Desktop on macOS/Windows, Docker Engine on Linux). Containers must bind to exposed ports when you run docker-compose.
Repository layout
Top-level structure (core app + observability):
```text theme={null}
kodekloud-records-store-web-app/
├── src/
│ └── api/
│ ├── main.py # FastAPI application entry point
│ ├── routes.py # API endpoints (products, orders, checkout)
│ ├── models.py # Database models (Product, Order)
│ ├── database.py # Database connection and session management
│ ├── worker.py # Celery background tasks
│ ├── telemetry.py # OpenTelemetry setup
│ └── metrics.py # Prometheus metrics definitions (BEST PRACTICES)
│ └── requirements.txt # Python dependencies
├── config/
│ └── monitoring/ # Observability configuration
│ ├── prometheus.yml
│ ├── alertmanager.yml
│ ├── alert_rules.yml
│ ├── sli_rules.yml
│ └── grafana-provisioning/
├── deploy/
│ └── environments/ # Environment configuration
│ ├── setup-local-env.sh # Environment setup script
│ └── templates/
│ ├── env.dev.template
│ ├── env.staging.template
│ └── env.prod.template
├── scripts/
│ ├── generate_logs.sh
│ └── demo_request_correlation.sh
├── docker-compose.yaml
├── Dockerfile
├── test_traffic.sh
└── black_box_monitor.sh
```
Get started (local development)
1. Clone the repository and change into it:
```bash theme={null}
git clone https://github.com/jakepage91/kodekloud-records-store-web-app.git
cd kodekloud-records-store-web-app
```
2. Generate a development `.env` with safe defaults:
```bash theme={null}
# Create deploy/environments/.env.dev from the template
./deploy/environments/setup-local-env.sh
```
Sample output from the setup script:
```text theme={null}
🛠 Setting up local development environment configuration
============================================================
⚠️ deploy/environments/.env.dev already exists. Backup created as deploy/environments/.env.dev.backup
📄 Creating deploy/environments/.env.dev from template...
✅ Development environment configured with safe defaults
📝 For staging and production environments:
1. Copy the template files manually
2. Replace ${VARIABLE} placeholders with actual values
3. Store sensitive values in CI/CD secrets, not in files
🎯 Next steps:
1. Run: docker-compose --env-file deploy/environments/.env.dev up
2. For production: Set up GitHub secrets for sensitive values
🔒 Security reminder: Never commit files with real passwords!
```
Example `.env.dev` values used by the compose file:
```env theme={null}
# Application Settings
DEBUG=true
LOG_LEVEL=DEBUG
WEB_PORT=8000
# Message Queue
RABBITMQ_HOST=rabbitmq
# Monitoring & Observability
GRAFANA_ADMIN_PASSWORD=dev_admin_123
PROMETHEUS_RETENTION_TIME=7d
# OpenTelemetry
OTEL_SERVICE_NAME=kodekloud-record-store-api-dev
OTEL_EXPORTER_OTLP_ENDPOINT=http://jaeger:4317
OTEL_EXPORTER_OTLP_PROTOCOL=grpc
OTEL_TRACES_SAMPLER=parentbased_always_on
# Prometheus Pushgateway
PROMETHEUS_PUSHGATEWAY=pushgateway:9091
# Python Path
PYTHONPATH=/app/src
# Environment Tag
ENVIRONMENT=development
```
Do not commit real passwords or secrets to the repository. Keep sensitive values in CI/CD secrets or a secure secret store.
Docker Compose and services
A single `docker-compose.yaml` composes the application and all observability services. The `api` service is built from the local Dockerfile and depends on `db`, `rabbitmq`, `jaeger`, `fluent-bit`, and others to be available.
Example excerpts from the compose file (application and supporting services):
```yaml theme={null}
services:
api:
build:
context: .
dockerfile: Dockerfile
container_name: kodekloud-record-store-api
restart: always
depends_on:
- db
- rabbitmq
- jaeger
- fluent-bit
ports:
- "${WEB_PORT:-8000}:8000"
environment:
POSTGRES_HOST: ${POSTGRES_HOST}
POSTGRES_DB: ${POSTGRES_DB}
POSTGRES_USER: ${POSTGRES_USER}
POSTGRES_PASSWORD: ${POSTGRES_PASSWORD}
RABBITMQ_HOST: ${RABBITMQ_HOST}
PYTHONPATH: ${PYTHONPATH}
OTEL_SERVICE_NAME: ${OTEL_SERVICE_NAME}
OTEL_EXPORTER_OTLP_ENDPOINT: ${OTEL_EXPORTER_OTLP_ENDPOINT}
OTEL_EXPORTER_OTLP_PROTOCOL: ${OTEL_EXPORTER_OTLP_PROTOCOL}
OTEL_TRACES_SAMPLER: ${OTEL_TRACES_SAMPLER}
OTEL_PROPAGATORS: "tracecontext,baggage"
DEBUG: ${DEBUG}
LOG_LEVEL: ${LOG_LEVEL}
db:
image: postgres:15
container_name: kodekloud-record-store-db
restart: always
environment:
POSTGRES_DB: ${POSTGRES_DB}
POSTGRES_USER: ${POSTGRES_USER}
POSTGRES_PASSWORD: ${POSTGRES_PASSWORD}
ports:
- "5432:5432"
volumes:
- postgres_data:/var/lib/postgresql/data
networks:
- kodekloud-record-store-net
rabbitmq:
image: "rabbitmq:3-management"
container_name: kodekloud-record-store-rabbitmq
restart: always
ports:
- "5672:5672"
- "15672:15672"
volumes:
- rabbitmq_data:/var/lib/rabbitmq
networks:
- kodekloud-record-store-net
```
Observability services (Prometheus, Pushgateway, Grafana, Alertmanager, Loki, Fluent Bit, Jaeger and others) are defined in the same `docker-compose.yaml` and connected to the shared network. Example service entries and ports:
```yaml theme={null}
prometheus:
image: prom/prometheus:latest
command:
- '--config.file=/etc/prometheus/prometheus.yml'
- '--storage.tsdb.path=/prometheus'
- '--web.enable-lifecycle'
- '--storage.tsdb.retention.time=${PROMETHEUS_RETENTION_TIME:-15d}'
networks:
- kodekloud-record-store-net
pushgateway:
image: prom/pushgateway:latest
container_name: kodekloud-record-store-pushgateway
ports:
- "9091:9091"
networks:
- kodekloud-record-store-net
grafana:
image: grafana/grafana:11.5.1
container_name: kodekloud-record-store-grafana
ports:
- "3000:3000"
environment:
- GF_SECURITY_ADMIN_PASSWORD=${GRAFANA_ADMIN_PASSWORD}
- GF_USERS_ALLOW_SIGN_UP=false
volumes:
- grafana_data:/var/lib/grafana
- ./config/monitoring/grafana-provisioning:/etc/grafana/provisioning
networks:
- kodekloud-record-store-net
depends_on:
- prometheus
- loki
jaeger:
image: jaegertracing/jaeger:latest
container_name: kodekloud-record-store-jaeger
ports:
- "16686:16686"
- "14268:14268"
- "14250:14250"
- "4317:4317"
- "4318:4318"
environment:
- COLLECTOR_OTLP_ENABLED=true
- COLLECTOR_ZIPKIN_HOST_PORT=:9411
networks:
- kodekloud-record-store-net
```
Quick reference — common service ports
| Service | Purpose | Default ports (local) |
| -: | - | -: |
| API (FastAPI) | Application HTTP API | `8000` |
| PostgreSQL | Relational datastore | `5432` |
| RabbitMQ | Message broker (AMQP + management UI) | `5672`, `15672` |
| Prometheus | Metrics scraping and TSDB | `9090` |
| Pushgateway | Push metrics endpoint | `9091` |
| Grafana | Dashboards | `3000` |
| Jaeger | Tracing UI & OTLP/collector | `16686`, `14268`, `4317`, `4318` |
Ensure Docker is running locally
Start your Docker daemon first (Docker Desktop on macOS/Windows, Docker Engine on Linux). Containers must bind to exposed ports when you run docker-compose.
 Bring up the complete stack
Run docker-compose with the generated `.env.dev`:
```bash theme={null}
# Start all services (application + observability)
docker-compose --env-file deploy/environments/.env.dev up -d
# Check all services are running
docker-compose ps
```
Basic verification
Test API and telemetry endpoints:
```bash theme={null}
# Test the API root
curl http://localhost:8000/
# Health and metrics
curl http://localhost:8000/health
curl http://localhost:8000/metrics | head -n 40
```
Example Prometheus-style metrics exposed by the API:
```text theme={null}
# HELP kodekloud_order_processing_duration_seconds Time taken to process an order from start to completion
# TYPE kodekloud_order_processing_duration_seconds histogram
# HELP kodekloud_database_operation_duration_seconds Time spent on database operations
# TYPE kodekloud_database_operation_duration_seconds histogram
# HELP kodekloud_http_errors_total Total number of HTTP errors
# TYPE kodekloud_http_errors_total counter
# HELP kodekloud_application_errors_total Total number of application-level errors
# TYPE kodekloud_application_errors_total counter
# HELP kodekloud_database_errors_total Total number of database errors
# TYPE kodekloud_database_errors_total counter
# HELP kodekloud_active_connections_current Current number of active connections
# TYPE kodekloud_active_connections_current gauge
kodekloud_active_connections_current 1.0
```
Useful API endpoints and testing scripts
Common endpoints for manual testing and generating telemetry:
```bash theme={null}
# Observability testing endpoints
curl http://localhost:8000/trace-test # Generate test traces
curl http://localhost:8000/error-test # Generate test errors
# Business endpoints
curl http://localhost:8000/products # List products
curl -X POST http://localhost:8000/products \
-H "Content-Type: application/json" \
-d '{"name": "Abbey Road", "price": 25.99}'
curl http://localhost:8000/orders # List orders
curl -X POST http://localhost:8000/orders \
-H "Content-Type: application/json" \
-d '{"product_id": 1, "quantity": 2}'
curl -X POST http://localhost:8000/checkout \
-H "Content-Type: application/json" \
-d '{"product_id": 1, "quantity": 1}'
```
Helper scripts in the repository:
```bash theme={null}
# Generate test traffic (products, orders, errors)
./test_traffic.sh
# Generate logs for correlation testing
./scripts/generate_logs.sh
# Run synthetic monitoring (blackbox)
./black_box_monitor.sh
```
Troubleshooting tips
Common commands and checks:
```bash theme={null}
# Check for port conflicts
docker-compose ps
sudo netstat -tulpn | grep -E ':(3000|8000|9090|5432)'
# Check Docker disk usage and prune if necessary
docker system df
docker system prune
# Verify Prometheus targets
curl http://localhost:9090/api/v1/targets
# Check API metrics for application counters
curl http://localhost:8000/metrics | grep kodekloud_
# Check Fluent Bit logs
docker-compose logs fluent-bit
# Check Jaeger logs
docker-compose logs jaeger
# Show container logs for any service
docker-compose logs
# Re-create the stack (caution: this removes volumes)
docker-compose down -v && docker-compose --env-file deploy/environments/.env.dev up -d
```
The `docker-compose down -v` command will remove volumes and delete local state (databases, message queues). Back up any important data before running it.
If a container fails to start, check:
* `docker-compose logs ` for the service-specific logs,
* environment variables in `deploy/environments/.env.dev` (missing DB credentials or incorrect hostnames are common causes),
* Prometheus config (`config/monitoring/prometheus.yml`) for scrape targets and job definitions.
Closing notes
This repository is a playground for hands-on observability: metrics (Prometheus), tracing (Jaeger/OpenTelemetry), and centralized logging (Loki + Fluent Bit), plus dashboards (Grafana) and alerting (Alertmanager). Use the project to:
* explore trace propagation and correlation across API + background workers,
* prototype Prometheus metrics and alerts,
* test log forwarding and query patterns in Loki,
* learn how dashboards and alert rules map to SLOs/SLIs.
Links and references
* FastAPI: [https://fastapi.tiangolo.com/](https://fastapi.tiangolo.com/)
* Celery: [https://docs.celeryproject.org/](https://docs.celeryproject.org/)
* PostgreSQL: [https://www.postgresql.org/](https://www.postgresql.org/)
* RabbitMQ: [https://www.rabbitmq.com/](https://www.rabbitmq.com/)
* Prometheus: [https://prometheus.io/](https://prometheus.io/)
* Pushgateway: [https://github.com/prometheus/pushgateway](https://github.com/prometheus/pushgateway)
* Grafana: [https://grafana.com/](https://grafana.com/)
* Jaeger: [https://www.jaegertracing.io/](https://www.jaegertracing.io/)
* Loki: [https://grafana.com/oss/loki/](https://grafana.com/oss/loki/)
* Fluent Bit: [https://fluentbit.io/](https://fluentbit.io/)
* Docker & Docker Compose: [https://docs.docker.com/](https://docs.docker.com/) and [https://docs.docker.com/compose/](https://docs.docker.com/compose/)
This documentation is built and hosted on [Mintlify](https://mintlify.com), a developer documentation platform.
Bring up the complete stack
Run docker-compose with the generated `.env.dev`:
```bash theme={null}
# Start all services (application + observability)
docker-compose --env-file deploy/environments/.env.dev up -d
# Check all services are running
docker-compose ps
```
Basic verification
Test API and telemetry endpoints:
```bash theme={null}
# Test the API root
curl http://localhost:8000/
# Health and metrics
curl http://localhost:8000/health
curl http://localhost:8000/metrics | head -n 40
```
Example Prometheus-style metrics exposed by the API:
```text theme={null}
# HELP kodekloud_order_processing_duration_seconds Time taken to process an order from start to completion
# TYPE kodekloud_order_processing_duration_seconds histogram
# HELP kodekloud_database_operation_duration_seconds Time spent on database operations
# TYPE kodekloud_database_operation_duration_seconds histogram
# HELP kodekloud_http_errors_total Total number of HTTP errors
# TYPE kodekloud_http_errors_total counter
# HELP kodekloud_application_errors_total Total number of application-level errors
# TYPE kodekloud_application_errors_total counter
# HELP kodekloud_database_errors_total Total number of database errors
# TYPE kodekloud_database_errors_total counter
# HELP kodekloud_active_connections_current Current number of active connections
# TYPE kodekloud_active_connections_current gauge
kodekloud_active_connections_current 1.0
```
Useful API endpoints and testing scripts
Common endpoints for manual testing and generating telemetry:
```bash theme={null}
# Observability testing endpoints
curl http://localhost:8000/trace-test # Generate test traces
curl http://localhost:8000/error-test # Generate test errors
# Business endpoints
curl http://localhost:8000/products # List products
curl -X POST http://localhost:8000/products \
-H "Content-Type: application/json" \
-d '{"name": "Abbey Road", "price": 25.99}'
curl http://localhost:8000/orders # List orders
curl -X POST http://localhost:8000/orders \
-H "Content-Type: application/json" \
-d '{"product_id": 1, "quantity": 2}'
curl -X POST http://localhost:8000/checkout \
-H "Content-Type: application/json" \
-d '{"product_id": 1, "quantity": 1}'
```
Helper scripts in the repository:
```bash theme={null}
# Generate test traffic (products, orders, errors)
./test_traffic.sh
# Generate logs for correlation testing
./scripts/generate_logs.sh
# Run synthetic monitoring (blackbox)
./black_box_monitor.sh
```
Troubleshooting tips
Common commands and checks:
```bash theme={null}
# Check for port conflicts
docker-compose ps
sudo netstat -tulpn | grep -E ':(3000|8000|9090|5432)'
# Check Docker disk usage and prune if necessary
docker system df
docker system prune
# Verify Prometheus targets
curl http://localhost:9090/api/v1/targets
# Check API metrics for application counters
curl http://localhost:8000/metrics | grep kodekloud_
# Check Fluent Bit logs
docker-compose logs fluent-bit
# Check Jaeger logs
docker-compose logs jaeger
# Show container logs for any service
docker-compose logs
# Re-create the stack (caution: this removes volumes)
docker-compose down -v && docker-compose --env-file deploy/environments/.env.dev up -d
```
The `docker-compose down -v` command will remove volumes and delete local state (databases, message queues). Back up any important data before running it.
If a container fails to start, check:
* `docker-compose logs ` for the service-specific logs,
* environment variables in `deploy/environments/.env.dev` (missing DB credentials or incorrect hostnames are common causes),
* Prometheus config (`config/monitoring/prometheus.yml`) for scrape targets and job definitions.
Closing notes
This repository is a playground for hands-on observability: metrics (Prometheus), tracing (Jaeger/OpenTelemetry), and centralized logging (Loki + Fluent Bit), plus dashboards (Grafana) and alerting (Alertmanager). Use the project to:
* explore trace propagation and correlation across API + background workers,
* prototype Prometheus metrics and alerts,
* test log forwarding and query patterns in Loki,
* learn how dashboards and alert rules map to SLOs/SLIs.
Links and references
* FastAPI: [https://fastapi.tiangolo.com/](https://fastapi.tiangolo.com/)
* Celery: [https://docs.celeryproject.org/](https://docs.celeryproject.org/)
* PostgreSQL: [https://www.postgresql.org/](https://www.postgresql.org/)
* RabbitMQ: [https://www.rabbitmq.com/](https://www.rabbitmq.com/)
* Prometheus: [https://prometheus.io/](https://prometheus.io/)
* Pushgateway: [https://github.com/prometheus/pushgateway](https://github.com/prometheus/pushgateway)
* Grafana: [https://grafana.com/](https://grafana.com/)
* Jaeger: [https://www.jaegertracing.io/](https://www.jaegertracing.io/)
* Loki: [https://grafana.com/oss/loki/](https://grafana.com/oss/loki/)
* Fluent Bit: [https://fluentbit.io/](https://fluentbit.io/)
* Docker & Docker Compose: [https://docs.docker.com/](https://docs.docker.com/) and [https://docs.docker.com/compose/](https://docs.docker.com/compose/)
This documentation is built and hosted on [Mintlify](https://mintlify.com), a developer documentation platform.