Popular Dashboarding Tools & Their Use Cases
Different environments may call for specific dashboarding tools. Here are some commonly employed options:-
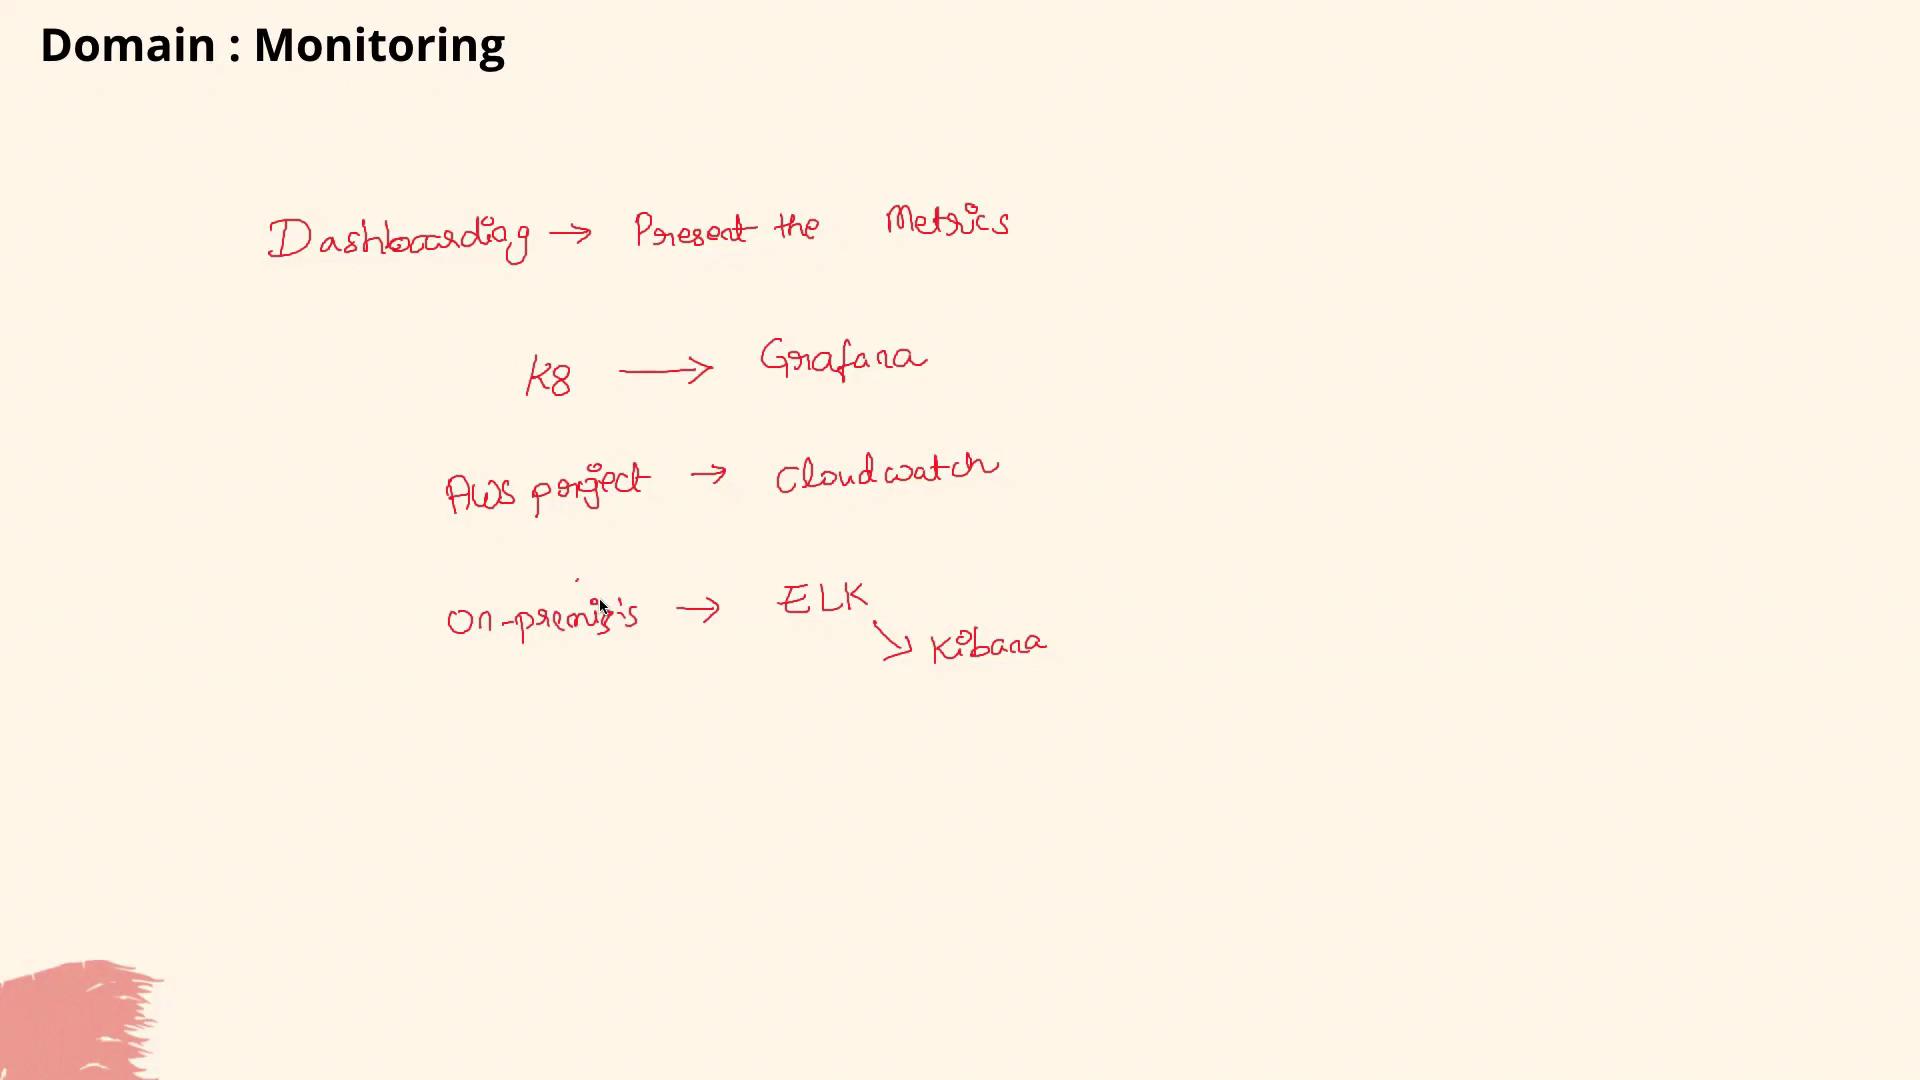
Kubernetes Environments:
In projects based on Kubernetes, Grafana is frequently used. Grafana offers dynamic visualizations that make it easy to monitor real-time performance metrics. -
AWS-Powered Projects:
For projects hosted on AWS—such as a three-tier web application utilizing EC2 Auto Scaling groups and databases—AWS CloudWatch is often the tool of choice. Its deep integration with AWS services provides seamless monitoring. -
On-Premises Environments:
When neither Kubernetes nor AWS is utilized, the ELK stack emerges as a robust solution. Here, Kibana serves as the dashboard tool, turning logs into actionable visual insights.
Crafting Your Answer
When responding to this inquiry, you might say:“As a DevOps engineer, I understand that effective monitoring and dashboarding are key to maintaining observability. In our Kubernetes-based projects, we rely on Grafana to present essential performance metrics to developers, testers, and operations teams. For environments hosted on AWS, I prefer AWS CloudWatch due to its tight integration with AWS services and ease of use. In cases where neither Kubernetes nor AWS is applicable, I would implement an ELK stack, which leverages Kibana for efficient metric visualization.”
If you are less familiar with the ELK stack, it is perfectly acceptable to focus on Grafana and AWS CloudWatch—both are widely recognized as leading tools in the industry.