> ## Documentation Index
> Fetch the complete documentation index at: https://notes.kodekloud.com/llms.txt
> Use this file to discover all available pages before exploring further.
# Your Database Query Takes 30 Seconds
> Explains diagnosing and fixing slow SQL queries by examining execution plans, adding appropriate indexes, eliminating N+1 application patterns, optimizing joins and statistics before considering hardware upgrades.
In this lesson we walk through a common DevOps / backend interview scenario:
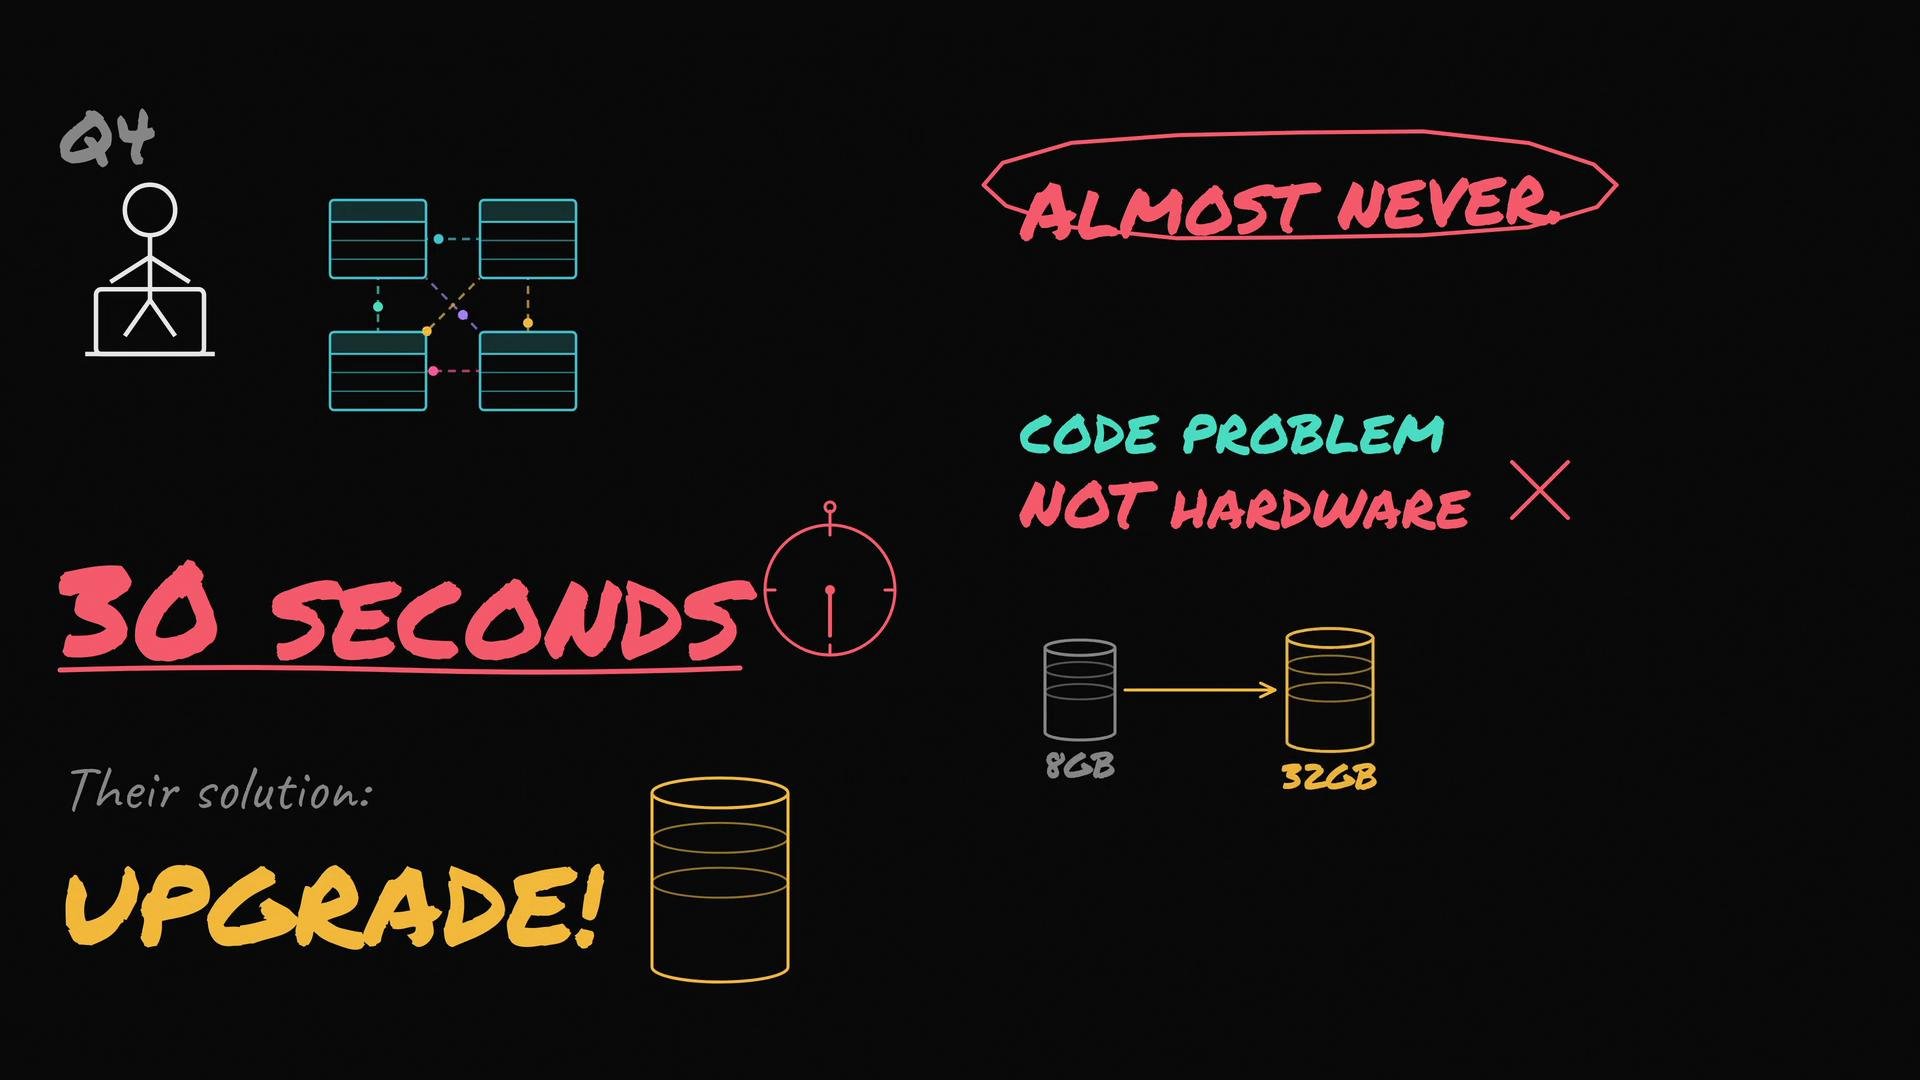
A developer writes a query that joins four tables. It takes thirty seconds to return results. The proposed fix? Upgrade the database to a bigger instance.
Is that the right move? Almost never. A slow query is typically a code, schema, or plan problem — not a RAM or CPU problem. Upgrading from 8 GB to 32 GB might reduce the time from thirty seconds to twenty‑five seconds, but you still have a fundamentally broken query and ongoing cost.
Before making any changes, inspect the query plan and the application behavior: that’s where the real cause usually reveals itself.
 ## Common root causes
Most slow queries fall into a few predictable categories:
* Missing or wrong indexes
* Application-layer N+1 query patterns
* Inefficient joins and `SELECT *` usage
* Outdated statistics, bad planner estimates, or inappropriate join orders
## Missing indexes
This is the number-one culprit. Without an index, a database may scan millions of rows instead of reading a handful — like flipping through every page of a phone book instead of using the alphabetical tabs. A single well-placed index can turn 30 seconds into tens of milliseconds.
## Common root causes
Most slow queries fall into a few predictable categories:
* Missing or wrong indexes
* Application-layer N+1 query patterns
* Inefficient joins and `SELECT *` usage
* Outdated statistics, bad planner estimates, or inappropriate join orders
## Missing indexes
This is the number-one culprit. Without an index, a database may scan millions of rows instead of reading a handful — like flipping through every page of a phone book instead of using the alphabetical tabs. A single well-placed index can turn 30 seconds into tens of milliseconds.
 ## The N+1 problem
This is an application-layer issue. Example pattern:
* Your code fetches 100 users.
* Then it runs a separate query for each user's orders.
* Result: 101 round trips (1 + 100) when a single join or a batched query could return everything in one round trip.
N+1 often does not show up in a standalone SQL review because the extra queries are generated in application loops or from lazy-loaded relationships.
## Bad joins and SELECT \*
A multi-table join isn’t inherently slow. The problem arises when:
* You join on non-indexed columns, causing full scans.
* You fetch every column with `SELECT *` when you only need a few fields (wasted I/O and CPU).
* The planner chooses an expensive join order or hash join because statistics are stale.
Best practice: select only the columns you need and join on indexed keys.
## What to do (practical checklist)
Always run the query planner/executor to see what the database is actually doing before making changes.
## Step 1 — Run EXPLAIN / EXPLAIN ANALYZE
This is non-negotiable. Use the RDBMS’s explain facility to see the chosen plan and actual runtime stats.
* PostgreSQL: `EXPLAIN ANALYZE ;` (add `BUFFERS` for I/O stats)
* MySQL: `EXPLAIN FORMAT=JSON ;` and consider `ANALYZE TABLE` to refresh stats
* SQL Server: Use the Actual Execution Plan
Look for: full table scans, large row estimates, ignored indexes, expensive sorts, or repeated nested loops.
Example (PostgreSQL):
```sql theme={null}
EXPLAIN ANALYZE
SELECT o.id, o.total, u.name
FROM orders o
JOIN users u ON u.id = o.user_id
WHERE o.created_at >= '2026-01-01';
```
## Step 2 — Add the right indexes
* Index columns used in `WHERE`, `JOIN`, `GROUP BY`, and `ORDER BY`.
* Use composite indexes for multi-column filters. Create them in the column order the query uses (leading-column matters).
* Avoid indexing every column — unnecessary indexes increase write cost and storage.
* Consider covering indexes if the index can satisfy the entire query without touching the table.
## Step 3 — Fix the application layer
* Replace lazy-loaded per-row queries with eager loading or explicit joins.
* Batch requests (e.g., `WHERE id IN (...)`) instead of issuing one query per item.
* Implement pagination or streaming for large result sets rather than reading everything into memory.
## When to consider additional hardware
Only after you’ve exhausted query, schema, and configuration fixes should you consider scaling or specialized systems.
* Use read replicas to offload reporting/read-heavy workloads — they protect the primary but don’t fix a bad query.
* For heavy analytics over very large datasets, consider OLAP systems (e.g., Redshift, BigQuery, ClickHouse).
* Tune database configuration (work\_mem, shared\_buffers, effective\_cache\_size, etc.) and ensure statistics are current (`ANALYZE` / autovacuum working).
Do not use larger instances to hide slow queries. Upgrading hardware without addressing the root cause is expensive and temporary.
## Quick reference table
| Problem | What to check | Quick fix |
| -----------------------: | -------------------------------------------------- | -------------------------------------------- |
| Too many rows scanned | EXPLAIN ANALYZE → sequential scans on large tables | Add or adjust indexes |
| N+1 queries | Application logs / query tracing (APM) | Eager load, batch queries, JOINs |
| Large result payloads | Query selects `*` or many columns | Select only required columns; use pagination |
| Planner chooses bad plan | Stale statistics, wrong estimates | `ANALYZE`, update stats, check histograms |
| Read-heavy reporting | Primary instance CPU/IO spikes | Offload to read replicas or a data warehouse |
## Summary
The pattern is consistent: diagnose first, then fix the root cause. Use the planner and application traces to find whether the issue is an index, an application loop, a bad join, or stale statistics. Throwing hardware at a bad query is like putting a bigger engine on a car with a clogged fuel line — it wastes money and delays the inevitable fix.
## The N+1 problem
This is an application-layer issue. Example pattern:
* Your code fetches 100 users.
* Then it runs a separate query for each user's orders.
* Result: 101 round trips (1 + 100) when a single join or a batched query could return everything in one round trip.
N+1 often does not show up in a standalone SQL review because the extra queries are generated in application loops or from lazy-loaded relationships.
## Bad joins and SELECT \*
A multi-table join isn’t inherently slow. The problem arises when:
* You join on non-indexed columns, causing full scans.
* You fetch every column with `SELECT *` when you only need a few fields (wasted I/O and CPU).
* The planner chooses an expensive join order or hash join because statistics are stale.
Best practice: select only the columns you need and join on indexed keys.
## What to do (practical checklist)
Always run the query planner/executor to see what the database is actually doing before making changes.
## Step 1 — Run EXPLAIN / EXPLAIN ANALYZE
This is non-negotiable. Use the RDBMS’s explain facility to see the chosen plan and actual runtime stats.
* PostgreSQL: `EXPLAIN ANALYZE ;` (add `BUFFERS` for I/O stats)
* MySQL: `EXPLAIN FORMAT=JSON ;` and consider `ANALYZE TABLE` to refresh stats
* SQL Server: Use the Actual Execution Plan
Look for: full table scans, large row estimates, ignored indexes, expensive sorts, or repeated nested loops.
Example (PostgreSQL):
```sql theme={null}
EXPLAIN ANALYZE
SELECT o.id, o.total, u.name
FROM orders o
JOIN users u ON u.id = o.user_id
WHERE o.created_at >= '2026-01-01';
```
## Step 2 — Add the right indexes
* Index columns used in `WHERE`, `JOIN`, `GROUP BY`, and `ORDER BY`.
* Use composite indexes for multi-column filters. Create them in the column order the query uses (leading-column matters).
* Avoid indexing every column — unnecessary indexes increase write cost and storage.
* Consider covering indexes if the index can satisfy the entire query without touching the table.
## Step 3 — Fix the application layer
* Replace lazy-loaded per-row queries with eager loading or explicit joins.
* Batch requests (e.g., `WHERE id IN (...)`) instead of issuing one query per item.
* Implement pagination or streaming for large result sets rather than reading everything into memory.
## When to consider additional hardware
Only after you’ve exhausted query, schema, and configuration fixes should you consider scaling or specialized systems.
* Use read replicas to offload reporting/read-heavy workloads — they protect the primary but don’t fix a bad query.
* For heavy analytics over very large datasets, consider OLAP systems (e.g., Redshift, BigQuery, ClickHouse).
* Tune database configuration (work\_mem, shared\_buffers, effective\_cache\_size, etc.) and ensure statistics are current (`ANALYZE` / autovacuum working).
Do not use larger instances to hide slow queries. Upgrading hardware without addressing the root cause is expensive and temporary.
## Quick reference table
| Problem | What to check | Quick fix |
| -----------------------: | -------------------------------------------------- | -------------------------------------------- |
| Too many rows scanned | EXPLAIN ANALYZE → sequential scans on large tables | Add or adjust indexes |
| N+1 queries | Application logs / query tracing (APM) | Eager load, batch queries, JOINs |
| Large result payloads | Query selects `*` or many columns | Select only required columns; use pagination |
| Planner chooses bad plan | Stale statistics, wrong estimates | `ANALYZE`, update stats, check histograms |
| Read-heavy reporting | Primary instance CPU/IO spikes | Offload to read replicas or a data warehouse |
## Summary
The pattern is consistent: diagnose first, then fix the root cause. Use the planner and application traces to find whether the issue is an index, an application loop, a bad join, or stale statistics. Throwing hardware at a bad query is like putting a bigger engine on a car with a clogged fuel line — it wastes money and delays the inevitable fix.