> ## Documentation Index
> Fetch the complete documentation index at: https://notes.kodekloud.com/llms.txt
> Use this file to discover all available pages before exploring further.
# Logs Pipeline Alloy Loki S3 Grafana
> Designing a scalable Kubernetes logging pipeline using Grafana Alloy collectors, Loki label-indexing, and S3 object storage for cost-effective centralized log storage and querying
We will design a Kubernetes logging pipeline that reliably collects, enriches, stores, and queries logs for hundreds of microservices. This architecture is optimized for scale and cost while preserving the ability to quickly correlate logs with metrics.
Why this is necessary
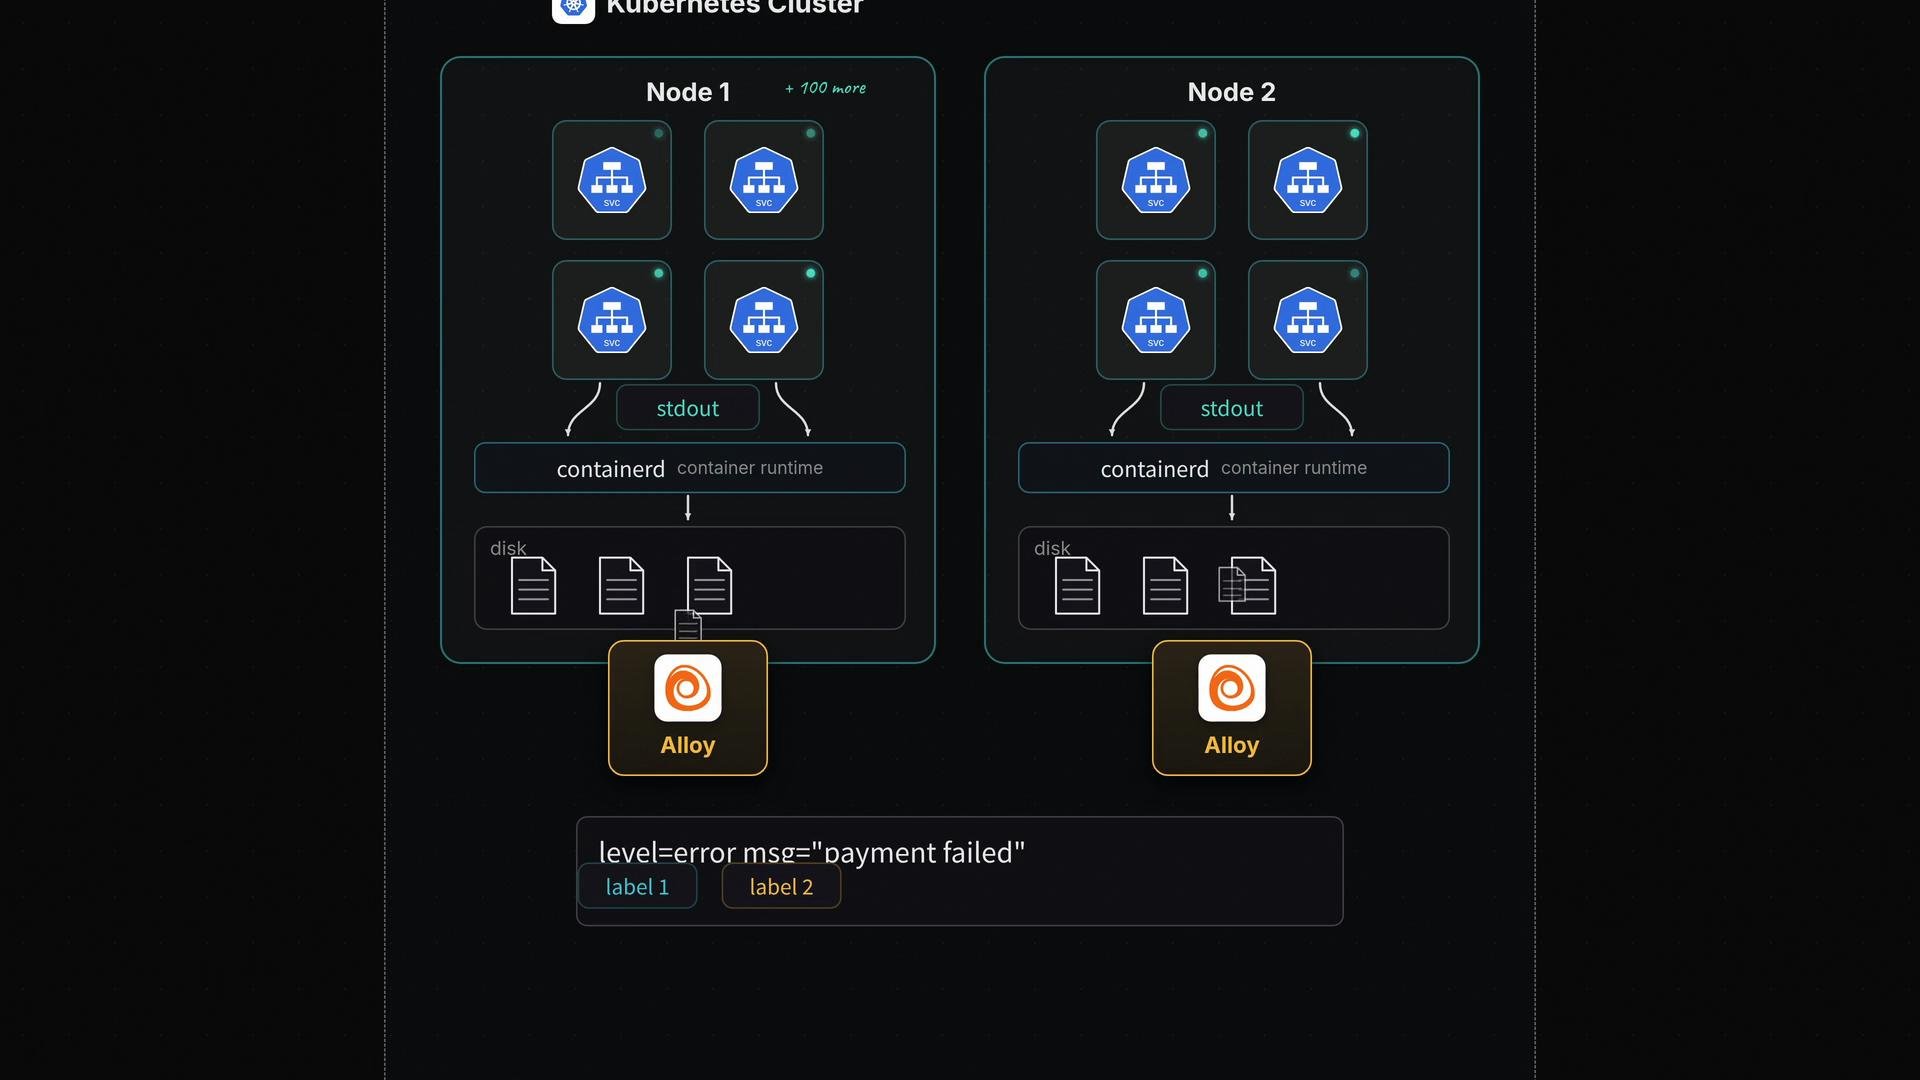
* Containers write logs to standard output. The container runtime (containerd/CRI-O) captures stdout and writes node-local log files.
* Those plain-text logs are scattered across nodes; if a node fails, its logs are lost.
* To avoid data loss and enable centralized querying, run a log-collector on every node and send logs to a durable backend.
DaemonSet log collectors (Grafana Alloy)
* Deploy Grafana Alloy as a DaemonSet so Kubernetes schedules one Alloy pod per node.
* Each Alloy instance tails the container runtime’s log files and enriches every line with Kubernetes metadata: namespace, pod, container, node, and labels.
* These labels make searches efficient and let you trace where a log line originated.
 Storage and indexing: Loki + object storage
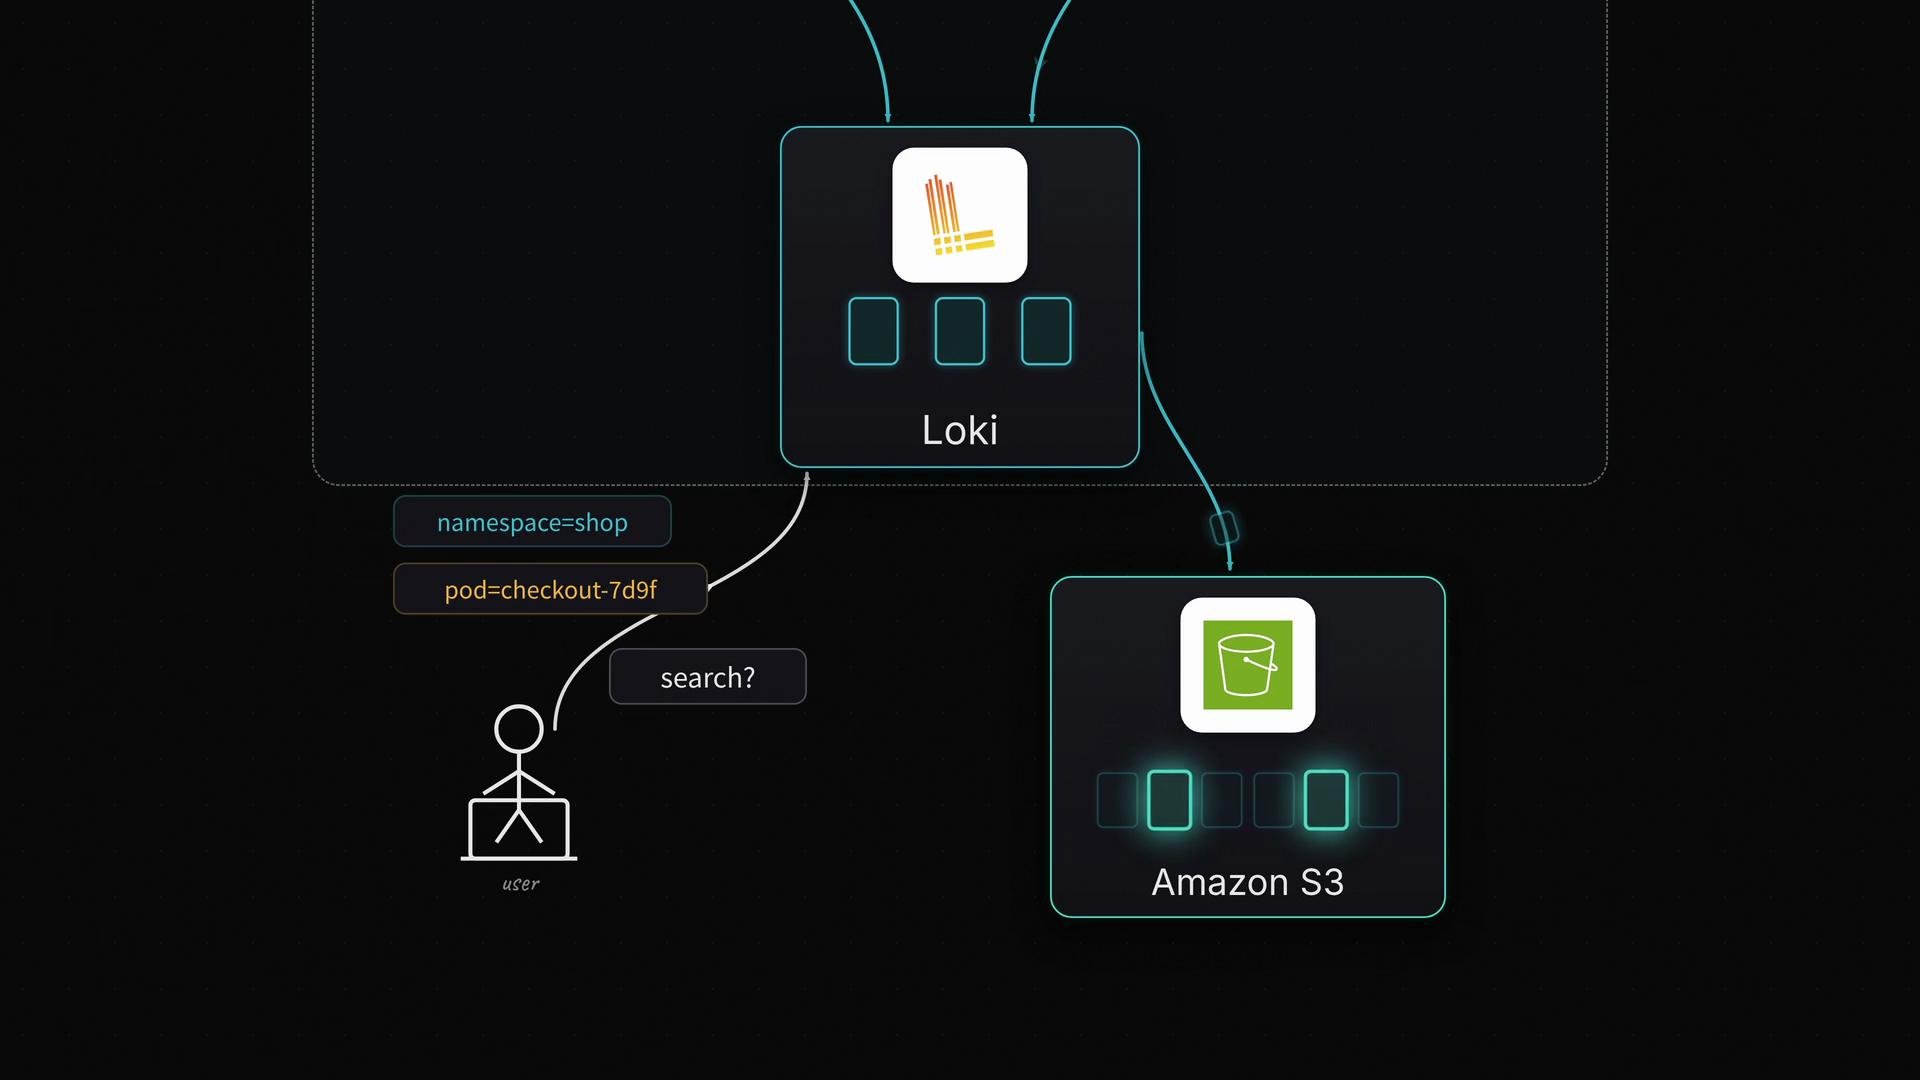
* Instead of indexing full log text like Elasticsearch, Loki indexes only labels (metadata) attached to log streams.
* Incoming logs are grouped into compressed chunks. Completed chunks are written to an object store (for example, Amazon S3), which stores the raw log text.
* Loki maintains a lightweight index mapping label combinations to chunks. Queries first use label selectors to narrow the set of candidate chunks, then scan the relevant chunks for matching log lines.
Storage and indexing: Loki + object storage
* Instead of indexing full log text like Elasticsearch, Loki indexes only labels (metadata) attached to log streams.
* Incoming logs are grouped into compressed chunks. Completed chunks are written to an object store (for example, Amazon S3), which stores the raw log text.
* Loki maintains a lightweight index mapping label combinations to chunks. Queries first use label selectors to narrow the set of candidate chunks, then scan the relevant chunks for matching log lines.
 Why this design is efficient
* Label-based indexing keeps the index small and cheap to operate.
* Compressed chunks in object storage are cost-effective for long-term retention.
* Most queries include labels (e.g., `namespace`, `service`, `pod`), so Loki avoids scanning unnecessary data by selecting only a few chunks.
Grafana as the UI
* Add Loki as a Grafana data source to view logs and build dashboards that combine metrics and logs.
* Grafana + Loki enable quick context switching: from a metric spike to logs filtered by the same labels and time window.
Design labels carefully: include `service`, `environment`, `namespace`, `pod`, and `node` identifiers so queries can efficiently narrow the search space.
Example troubleshooting workflow
1. A dashboard shows a CPU spike at 02:00.
2. In Grafana, open the same 02:00 time window and select the affected service or pod labels.
3. Search the log lines for errors (for example, "payment failed") to correlate metrics with application events.
Comparison: Elasticsearch vs Loki
| Aspect | Elasticsearch (full-text index) | Loki (label-indexed, object store) |
| ------------ | ------------------------------------------------- | ----------------------------------------------------------------- |
| Indexing | Full-text index of every log line | Indexes only labels/metadata |
| Storage cost | Higher (index size grows with text) | Lower (compressed chunks in object storage) |
| Query speed | Fast for full-text queries (heavy indexing cost) | Fast for label-based queries; scans chunks for text matches |
| Retention | More expensive for long-term retention | Cost-effective for long-term retention using S3-compatible stores |
| Use case | When full-text search across logs is primary need | When cost, scale, and label-based filtering are priorities |
Best practices and considerations
* Retain raw chunks in object storage for as long as business requirements dictate.
* Tune chunk size and compression for your write/query patterns.
* Ensure Alloy (or your collector) correctly attaches labels to each log stream.
* Monitor Loki’s index and object store throughput to avoid bottlenecks.
References and further reading
* [Kubernetes Basics](https://learn.kodekloud.com/user/courses/kubernetes-for-the-absolute-beginners-hands-on-tutorial)
* [Grafana Loki course](https://learn.kodekloud.com/user/courses/grafana-loki)
* [Amazon S3 course](https://learn.kodekloud.com/user/courses/amazon-simple-storage-service-amazon-s3)
* [EFK / Elasticsearch logging](https://learn.kodekloud.com/user/courses/efk-stack-enterprise-grade-logging-and-monitoring)
If you need frequent full-text searches across all logs, evaluate the increased indexing cost with Elasticsearch. Loki is optimized for label-filtered queries and long-term, cost-efficient storage.
Why this design is efficient
* Label-based indexing keeps the index small and cheap to operate.
* Compressed chunks in object storage are cost-effective for long-term retention.
* Most queries include labels (e.g., `namespace`, `service`, `pod`), so Loki avoids scanning unnecessary data by selecting only a few chunks.
Grafana as the UI
* Add Loki as a Grafana data source to view logs and build dashboards that combine metrics and logs.
* Grafana + Loki enable quick context switching: from a metric spike to logs filtered by the same labels and time window.
Design labels carefully: include `service`, `environment`, `namespace`, `pod`, and `node` identifiers so queries can efficiently narrow the search space.
Example troubleshooting workflow
1. A dashboard shows a CPU spike at 02:00.
2. In Grafana, open the same 02:00 time window and select the affected service or pod labels.
3. Search the log lines for errors (for example, "payment failed") to correlate metrics with application events.
Comparison: Elasticsearch vs Loki
| Aspect | Elasticsearch (full-text index) | Loki (label-indexed, object store) |
| ------------ | ------------------------------------------------- | ----------------------------------------------------------------- |
| Indexing | Full-text index of every log line | Indexes only labels/metadata |
| Storage cost | Higher (index size grows with text) | Lower (compressed chunks in object storage) |
| Query speed | Fast for full-text queries (heavy indexing cost) | Fast for label-based queries; scans chunks for text matches |
| Retention | More expensive for long-term retention | Cost-effective for long-term retention using S3-compatible stores |
| Use case | When full-text search across logs is primary need | When cost, scale, and label-based filtering are priorities |
Best practices and considerations
* Retain raw chunks in object storage for as long as business requirements dictate.
* Tune chunk size and compression for your write/query patterns.
* Ensure Alloy (or your collector) correctly attaches labels to each log stream.
* Monitor Loki’s index and object store throughput to avoid bottlenecks.
References and further reading
* [Kubernetes Basics](https://learn.kodekloud.com/user/courses/kubernetes-for-the-absolute-beginners-hands-on-tutorial)
* [Grafana Loki course](https://learn.kodekloud.com/user/courses/grafana-loki)
* [Amazon S3 course](https://learn.kodekloud.com/user/courses/amazon-simple-storage-service-amazon-s3)
* [EFK / Elasticsearch logging](https://learn.kodekloud.com/user/courses/efk-stack-enterprise-grade-logging-and-monitoring)
If you need frequent full-text searches across all logs, evaluate the increased indexing cost with Elasticsearch. Loki is optimized for label-filtered queries and long-term, cost-efficient storage.