> ## Documentation Index
> Fetch the complete documentation index at: https://notes.kodekloud.com/llms.txt
> Use this file to discover all available pages before exploring further.

# Measuring the impact of communication on DevOps success

> Measuring how communication practices affect DevOps outcomes and using metrics and health checks to improve deployment frequency, MTTR, and team collaboration.

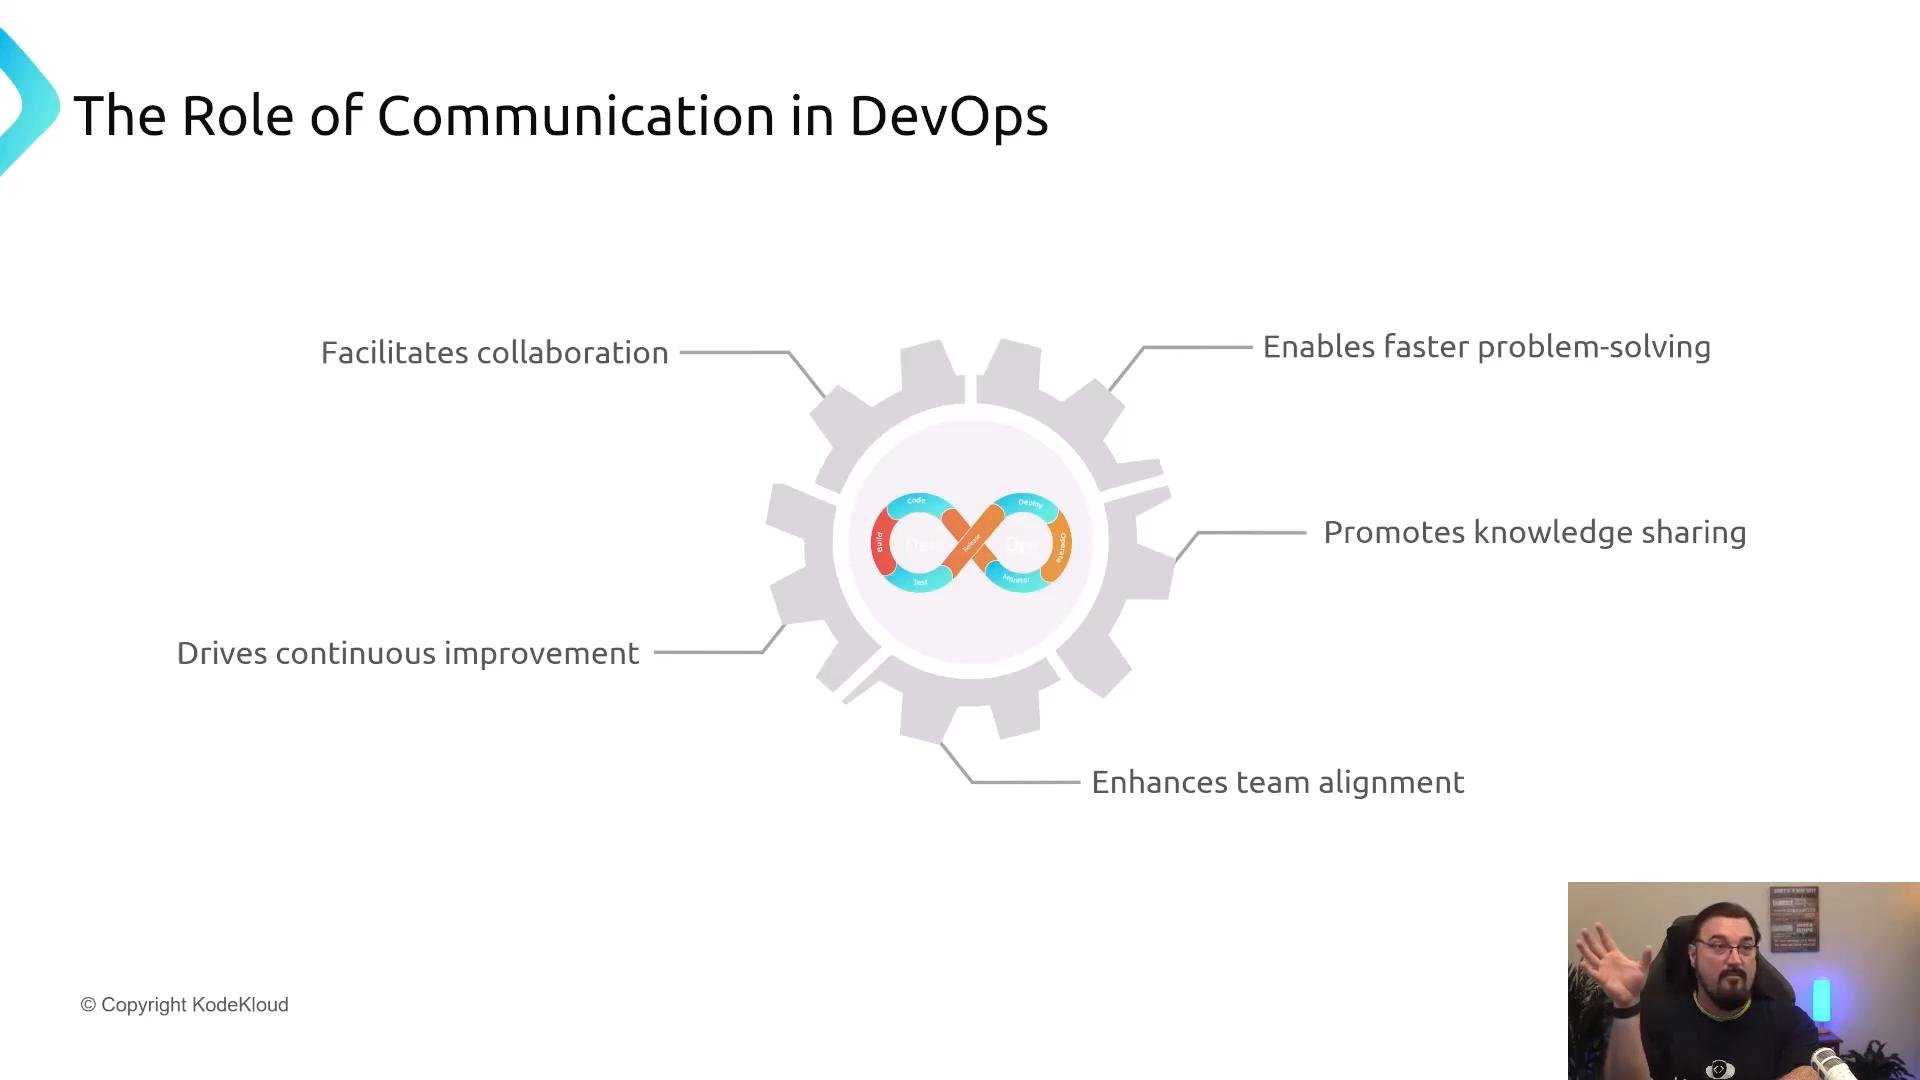
Welcome. In this lesson we’ll cover how to measure the impact of communication on DevOps outcomes, and how to turn those measurements into continuous improvement. Communication is a critical DevOps capability: it accelerates problem solving, increases knowledge sharing, improves team alignment, and supports faster delivery.
<Frame>
  <img src="https://mintcdn.com/kodekloud-c4ac6d9a/I2RNlSZgLhKXJPs-/images/DevOps-Soft-Skills-Speaking-Value-to-Non-Technical-Audiences/Continuous-Improvement/Measuring-the-impact-of-communication-on-DevOps-success/devops-communication-infinity-loop-presentation.jpg?fit=max&auto=format&n=I2RNlSZgLhKXJPs-&q=85&s=d5478e3119a31fc2943c22e1cb356e41" alt="A presentation slide titled &#x22;The Role of Communication in DevOps&#x22; showing a gear with a DevOps infinity loop and labeled benefits (facilitates collaboration, enables faster problem-solving, promotes knowledge sharing, drives continuous improvement, enhances team alignment). A small webcam feed at the bottom-right shows a presenter gesturing." width="1920" height="1080" data-path="images/DevOps-Soft-Skills-Speaking-Value-to-Non-Technical-Audiences/Continuous-Improvement/Measuring-the-impact-of-communication-on-DevOps-success/devops-communication-infinity-loop-presentation.jpg" />
</Frame>

<Callout icon="lightbulb" color="#1CB2FE">
  Measuring communication is about combining quantitative signals (message frequency, response times) with qualitative context (surveys, interviews). Both are necessary to understand how communication affects DevOps metrics like deployment frequency and MTTR.
</Callout>

## Why measure communication in DevOps?

Measurement helps you:

* Identify bottlenecks during incident response and deployment.
* Validate improvements (for example, protocol changes or tool integrations).
* Make decisions based on evidence instead of anecdotes.
* Align engineering practices with business outcomes (faster recovery, more frequent releases, better customer experience).

## Core DevOps success metrics (the targets)

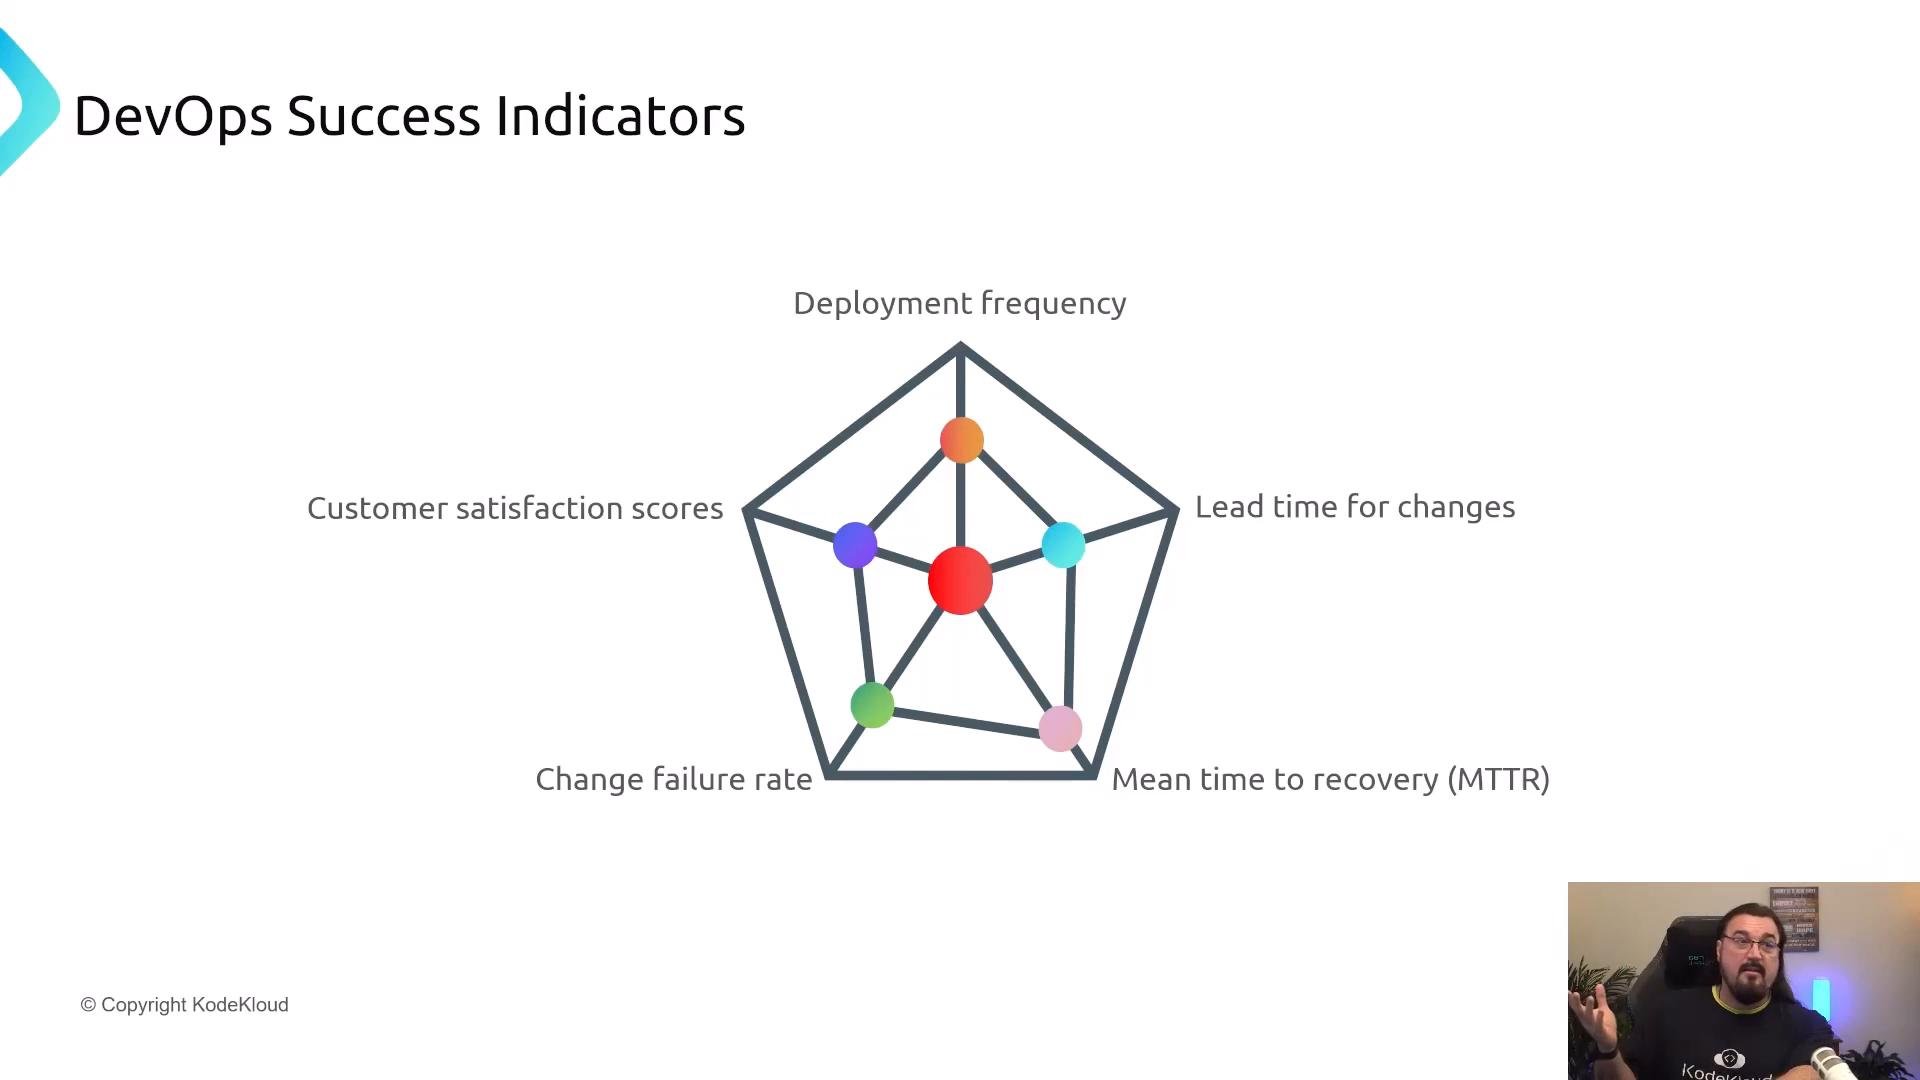
When measuring communication impact, correlate communication signals with established DevOps indicators, commonly referred to as DORA metrics:

* Deployment frequency
* Lead time for changes
* Mean time to recovery (MTTR)
* Change failure rate

Some teams also include customer satisfaction or NPS as an outcome metric to track user-facing impact.
<Frame>
  <img src="https://mintcdn.com/kodekloud-c4ac6d9a/I2RNlSZgLhKXJPs-/images/DevOps-Soft-Skills-Speaking-Value-to-Non-Technical-Audiences/Continuous-Improvement/Measuring-the-impact-of-communication-on-DevOps-success/devops-success-indicators-pentagon-radar-presenter.jpg?fit=max&auto=format&n=I2RNlSZgLhKXJPs-&q=85&s=67cf8785fe4bffb3e139c2a462923460" alt="A presentation slide titled &#x22;DevOps Success Indicators&#x22; showing a pentagon radar chart with metrics like deployment frequency, lead time for changes, mean time to recovery (MTTR), change failure rate, and customer satisfaction scores. A small video-feed of a presenter appears in the bottom-right corner." width="1920" height="1080" data-path="images/DevOps-Soft-Skills-Speaking-Value-to-Non-Technical-Audiences/Continuous-Improvement/Measuring-the-impact-of-communication-on-DevOps-success/devops-success-indicators-pentagon-radar-presenter.jpg" />
</Frame>

## What communication signals to measure

Common, actionable signals:

* Interaction frequency: meetings, standups, Slack/Teams channels activity, PR review throughput.
* Response times: how quickly questions or incident messages get answered.
* Documentation quality: README completeness, on-call playbook coverage, code comments.
* Cross-team handoffs: number and timeliness of dependency-related interactions.
* Knowledge sharing: internal workshops, onboarding materials, repository of runbooks.

You can map these signals to outcomes. For example, faster response times and clearer runbooks are expected to reduce MTTR.

## Correlation analysis: linking signals to outcomes

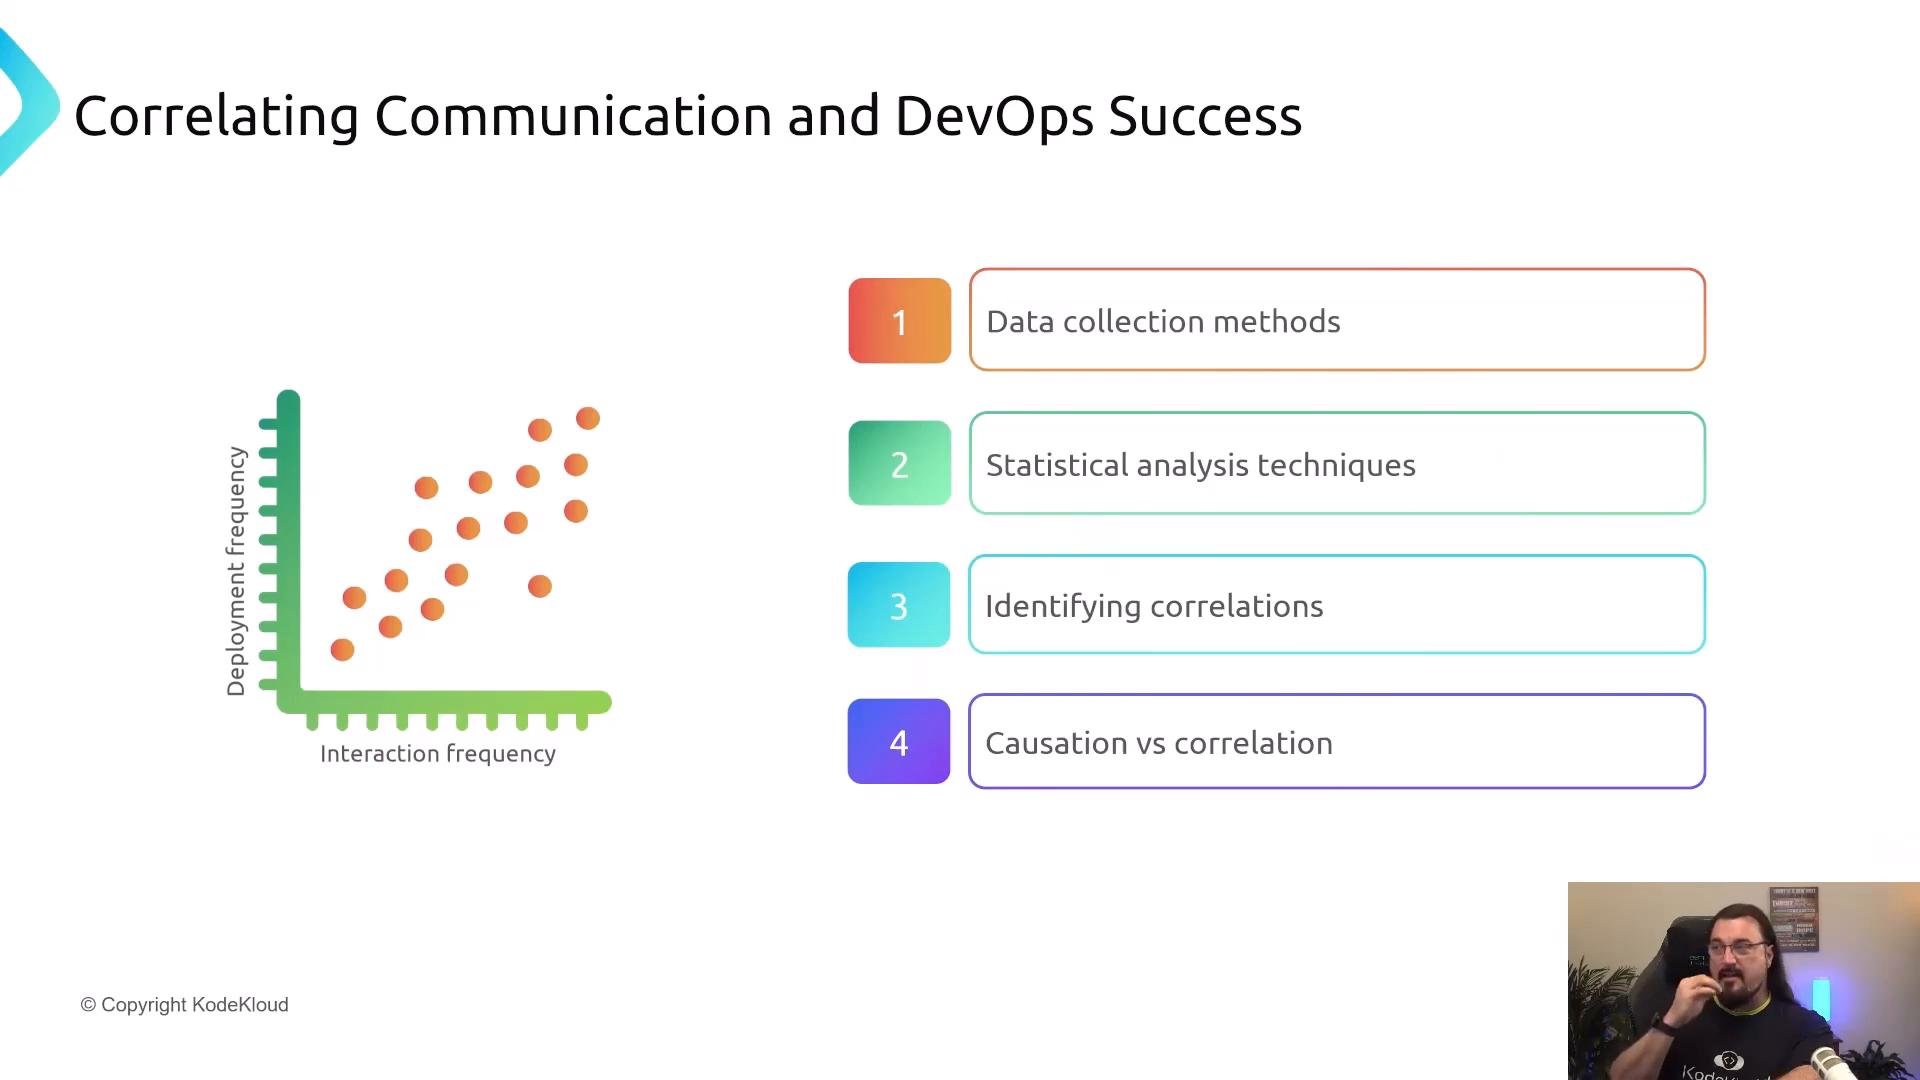
Correlation analysis helps reveal relationships between communication signals and DevOps metrics:

* Start with well-defined hypotheses (e.g., “higher PR review frequency correlates with faster lead time for changes”).
* Use basic statistical tools (Pearson/Spearman correlations, simple regressions) to quantify relationships.
* Always consider confounders: team size, tooling changes, or releases may affect both communication and outcomes.
* Distinguish correlation from causation: use experiments or phased roll-outs to test causality where possible.
<Frame>
  <img src="https://mintcdn.com/kodekloud-c4ac6d9a/I2RNlSZgLhKXJPs-/images/DevOps-Soft-Skills-Speaking-Value-to-Non-Technical-Audiences/Continuous-Improvement/Measuring-the-impact-of-communication-on-DevOps-success/correlating-communication-devops-success-slide.jpg?fit=max&auto=format&n=I2RNlSZgLhKXJPs-&q=85&s=a5457d61f49224ee9f75348a05a219fb" alt="A presentation slide titled &#x22;Correlating Communication and DevOps Success&#x22; with a scatter plot of interaction frequency vs deployment frequency on the left and a four-item list (data collection methods; statistical analysis techniques; identifying correlations; causation vs correlation) on the right. A small video feed of the presenter appears in the bottom-right." width="1920" height="1080" data-path="images/DevOps-Soft-Skills-Speaking-Value-to-Non-Technical-Audiences/Continuous-Improvement/Measuring-the-impact-of-communication-on-DevOps-success/correlating-communication-devops-success-slide.jpg" />
</Frame>

## Data sources for communication signals

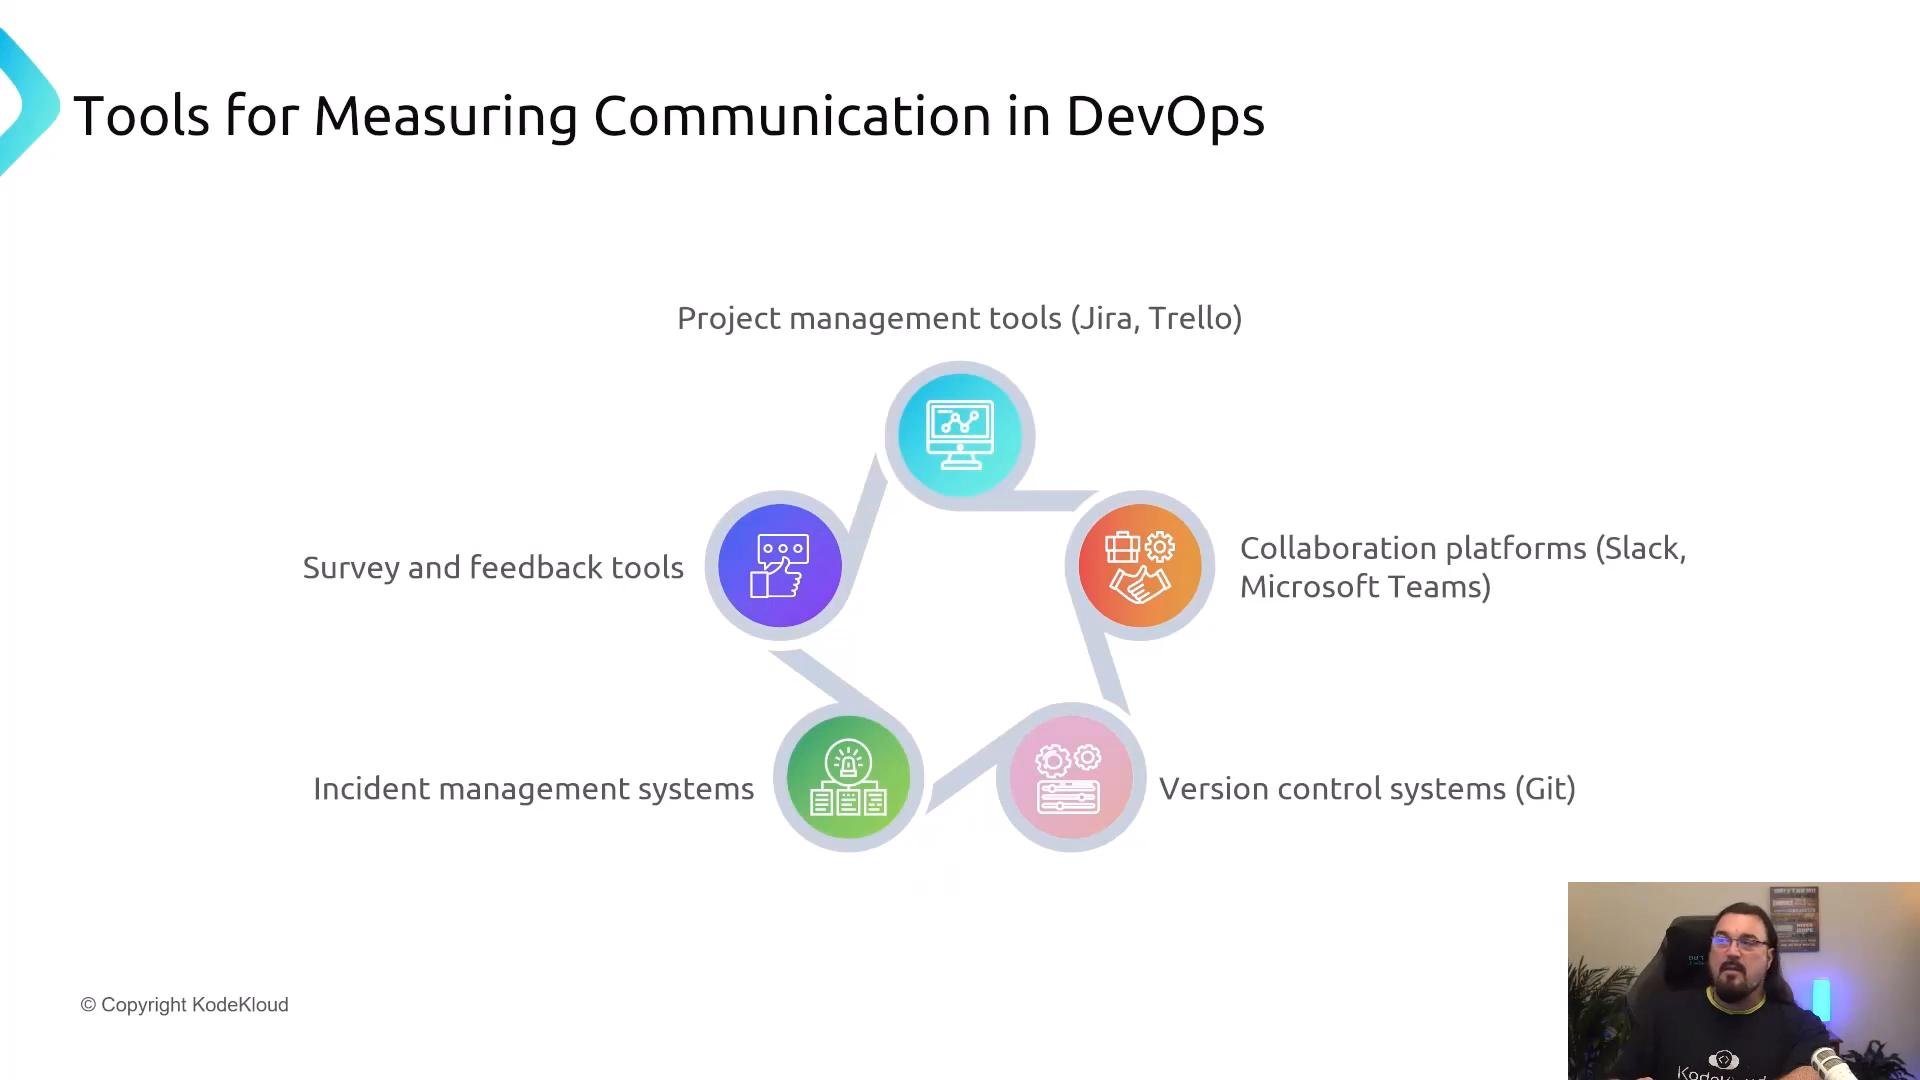
Use a mix of system telemetry and human feedback. Typical sources:

| Source type | What to extract | Example metrics |
| - | - | - |
| Project management | Ticket activity, handoffs, sprint cadence | Ticket cycle time, transition counts |
| Collaboration platforms | Message volume, response times, channel activity | Average response time, messages/day |
| Version control | PRs, comments, commit messages | PR review time, comment count per PR |
| Incident management | Incident timeline, on-call handoffs | Time to acknowledge, incident duration |
| Surveys & feedback | Qualitative context and sentiment | Satisfaction score, recurring themes |

Relevant tools: Jira, Trello, Slack, Microsoft Teams, Git, incident monitoring platforms, and survey tools.
<Frame>
  <img src="https://mintcdn.com/kodekloud-c4ac6d9a/I2RNlSZgLhKXJPs-/images/DevOps-Soft-Skills-Speaking-Value-to-Non-Technical-Audiences/Continuous-Improvement/Measuring-the-impact-of-communication-on-DevOps-success/devops-communication-measurement-tools.jpg?fit=max&auto=format&n=I2RNlSZgLhKXJPs-&q=85&s=7721370858ba375bb5259b2336589fcc" alt="A presentation slide titled &#x22;Tools for Measuring Communication in DevOps&#x22; showing circular icons and labels for project management (Jira, Trello), collaboration platforms (Slack, Microsoft Teams), version control (Git), incident management systems, and survey/feedback tools. A small webcam video of a presenter appears in the bottom-right." width="1920" height="1080" data-path="images/DevOps-Soft-Skills-Speaking-Value-to-Non-Technical-Audiences/Continuous-Improvement/Measuring-the-impact-of-communication-on-DevOps-success/devops-communication-measurement-tools.jpg" />
</Frame>

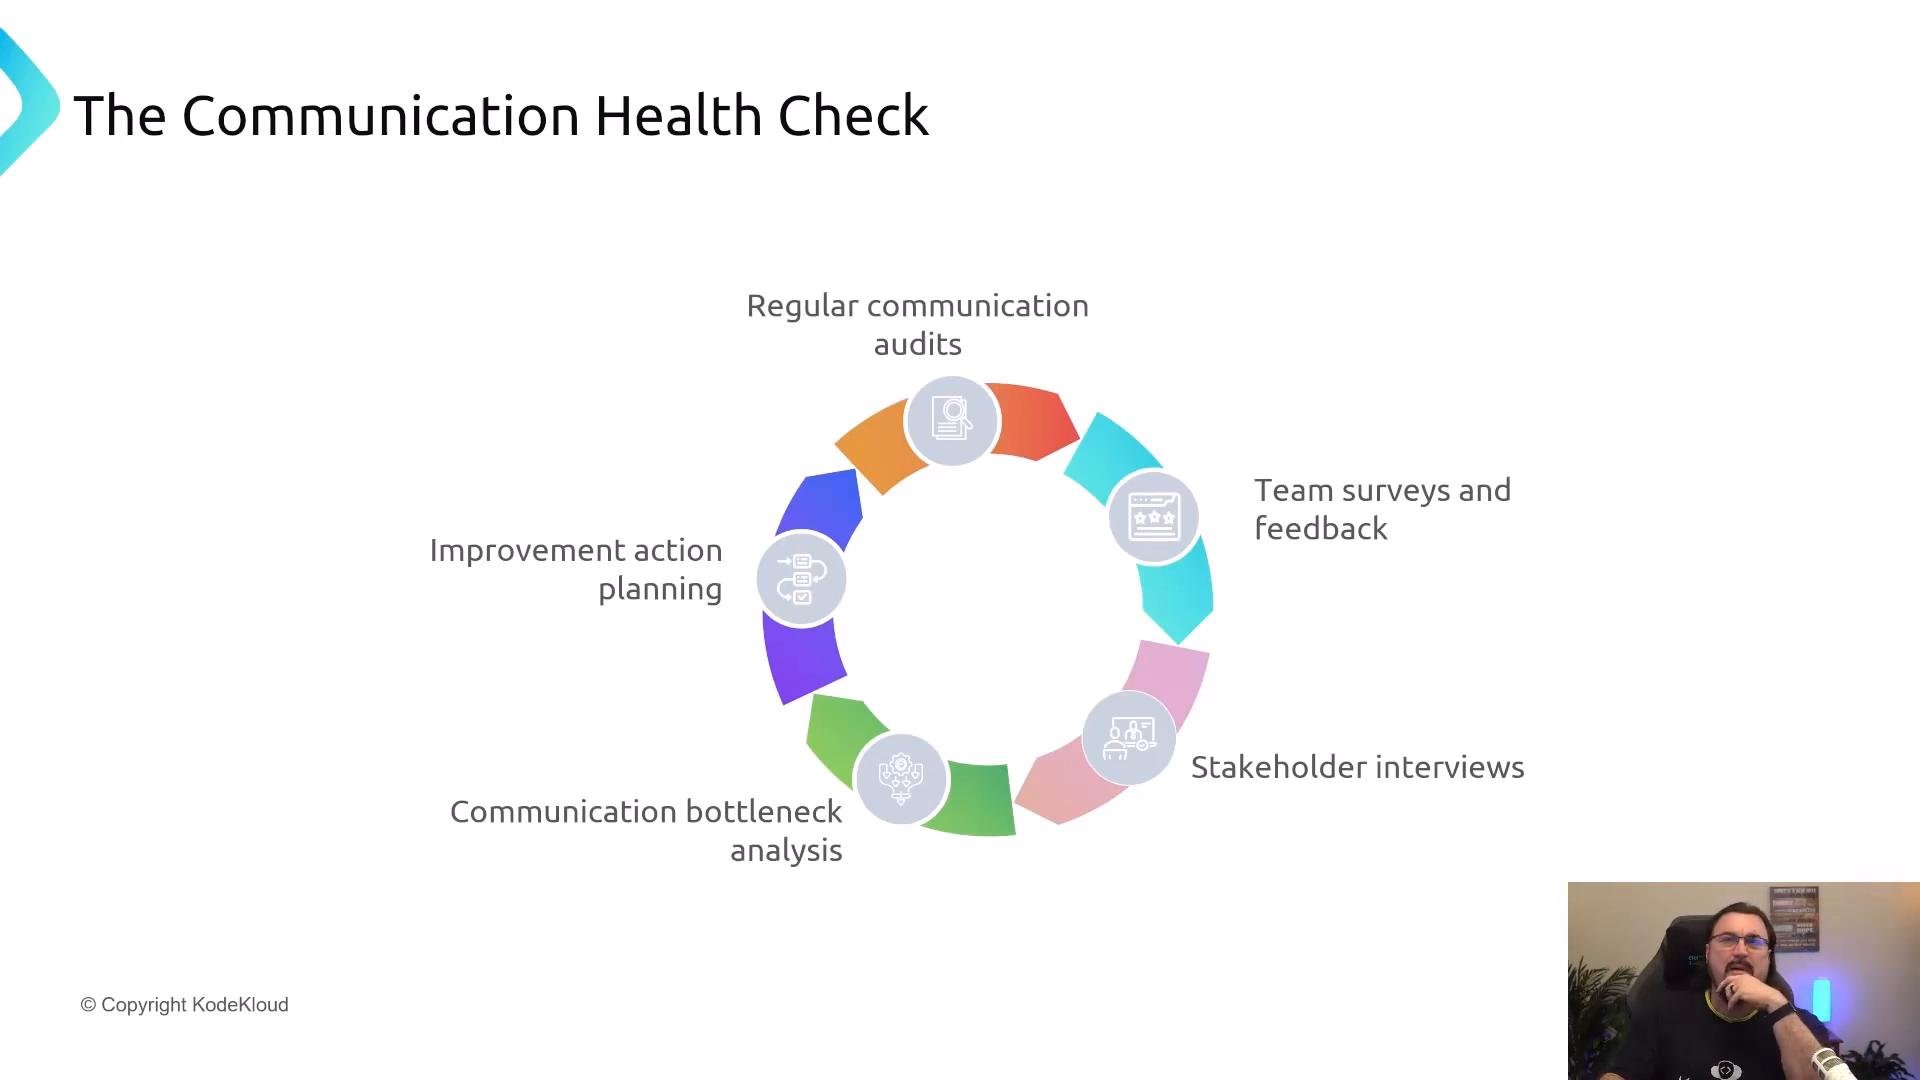
## Running a communication health check (practical steps)

A communication health check is an iterative program you run, typically quarterly or aligned to major releases:

1. Audit current state
   * Inventory channels, documented processes, and on-call rotations.
2. Collect quantitative data
   * Export message metadata, PR timings, ticket cycle times.
3. Gather qualitative context
   * Run short surveys and stakeholder interviews to surface pain points.
4. Analyze bottlenecks
   * Look for zones with long handoff delays or frequent escalations.
5. Plan improvements
   * Prioritize fixes that have the highest expected impact on DORA metrics.
6. Measure effect
   * Re-run the same measurements after implementing changes to validate impact.

This structured loop supports continuous improvement: audit → act → measure → iterate.
<Frame>
  <img src="https://mintcdn.com/kodekloud-c4ac6d9a/I2RNlSZgLhKXJPs-/images/DevOps-Soft-Skills-Speaking-Value-to-Non-Technical-Audiences/Continuous-Improvement/Measuring-the-impact-of-communication-on-DevOps-success/communication-health-check-flowchart-slide.jpg?fit=max&auto=format&n=I2RNlSZgLhKXJPs-&q=85&s=710ce6f91ba665418ef278d1befaf89e" alt="A slide titled &#x22;The Communication Health Check&#x22; showing a colorful circular flowchart of steps like regular communication audits, team surveys and feedback, stakeholder interviews, communication bottleneck analysis, and improvement action planning. A small webcam feed of a person appears in the bottom-right corner." width="1920" height="1080" data-path="images/DevOps-Soft-Skills-Speaking-Value-to-Non-Technical-Audiences/Continuous-Improvement/Measuring-the-impact-of-communication-on-DevOps-success/communication-health-check-flowchart-slide.jpg" />
</Frame>

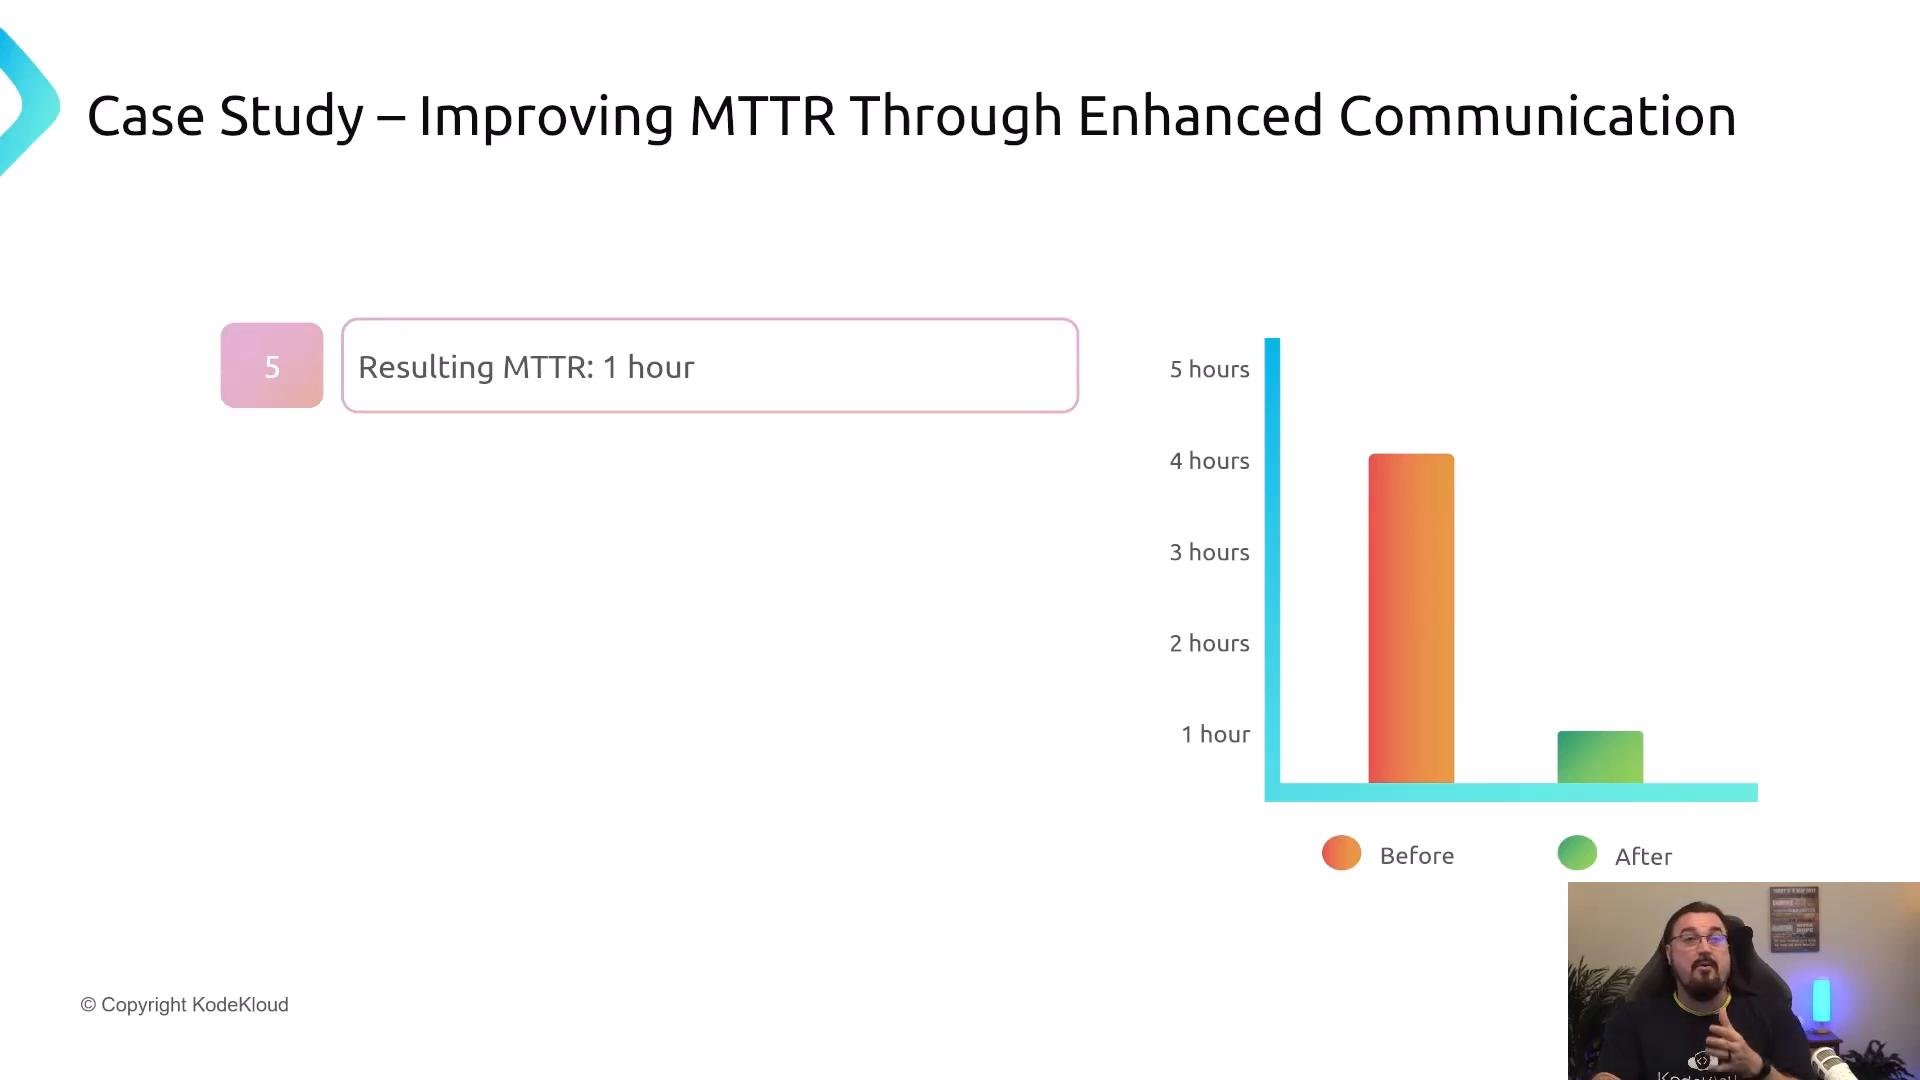
## Case study: reducing MTTR with targeted communication changes

Example summary:

* Problem: Average MTTR ≈ 4 hours with recurring delays caused by unclear escalation paths and slow notification.
* Intervention: Integrated monitoring alerts with the team’s chat platform, introduced standardized incident templates, and formalized a single incident commander role.
* Result: MTTR reduced from \~4 hours to \~1 hour after rollout — demonstrating a measurable improvement tied to communication fixes.

Use this pattern: identify the specific communication failure mode, apply targeted fixes, then measure the DORA metric(s) implicated.
<Frame>
  <img src="https://mintcdn.com/kodekloud-c4ac6d9a/I2RNlSZgLhKXJPs-/images/DevOps-Soft-Skills-Speaking-Value-to-Non-Technical-Audiences/Continuous-Improvement/Measuring-the-impact-of-communication-on-DevOps-success/mttr-1hour-case-study.jpg?fit=max&auto=format&n=I2RNlSZgLhKXJPs-&q=85&s=f1fe0d9ba7d8468ddd1b5474487ecbe2" alt="A presentation slide titled &#x22;Case Study – Improving MTTR Through Enhanced Communication&#x22; with a callout that reads &#x22;Resulting MTTR: 1 hour.&#x22; A bar chart on the right compares before (~4–5 hours) and after (~1 hour) MTTR improvements, and a small video overlay of a presenter appears in the bottom-right." width="1920" height="1080" data-path="images/DevOps-Soft-Skills-Speaking-Value-to-Non-Technical-Audiences/Continuous-Improvement/Measuring-the-impact-of-communication-on-DevOps-success/mttr-1hour-case-study.jpg" />
</Frame>

## Common challenges and how to address them

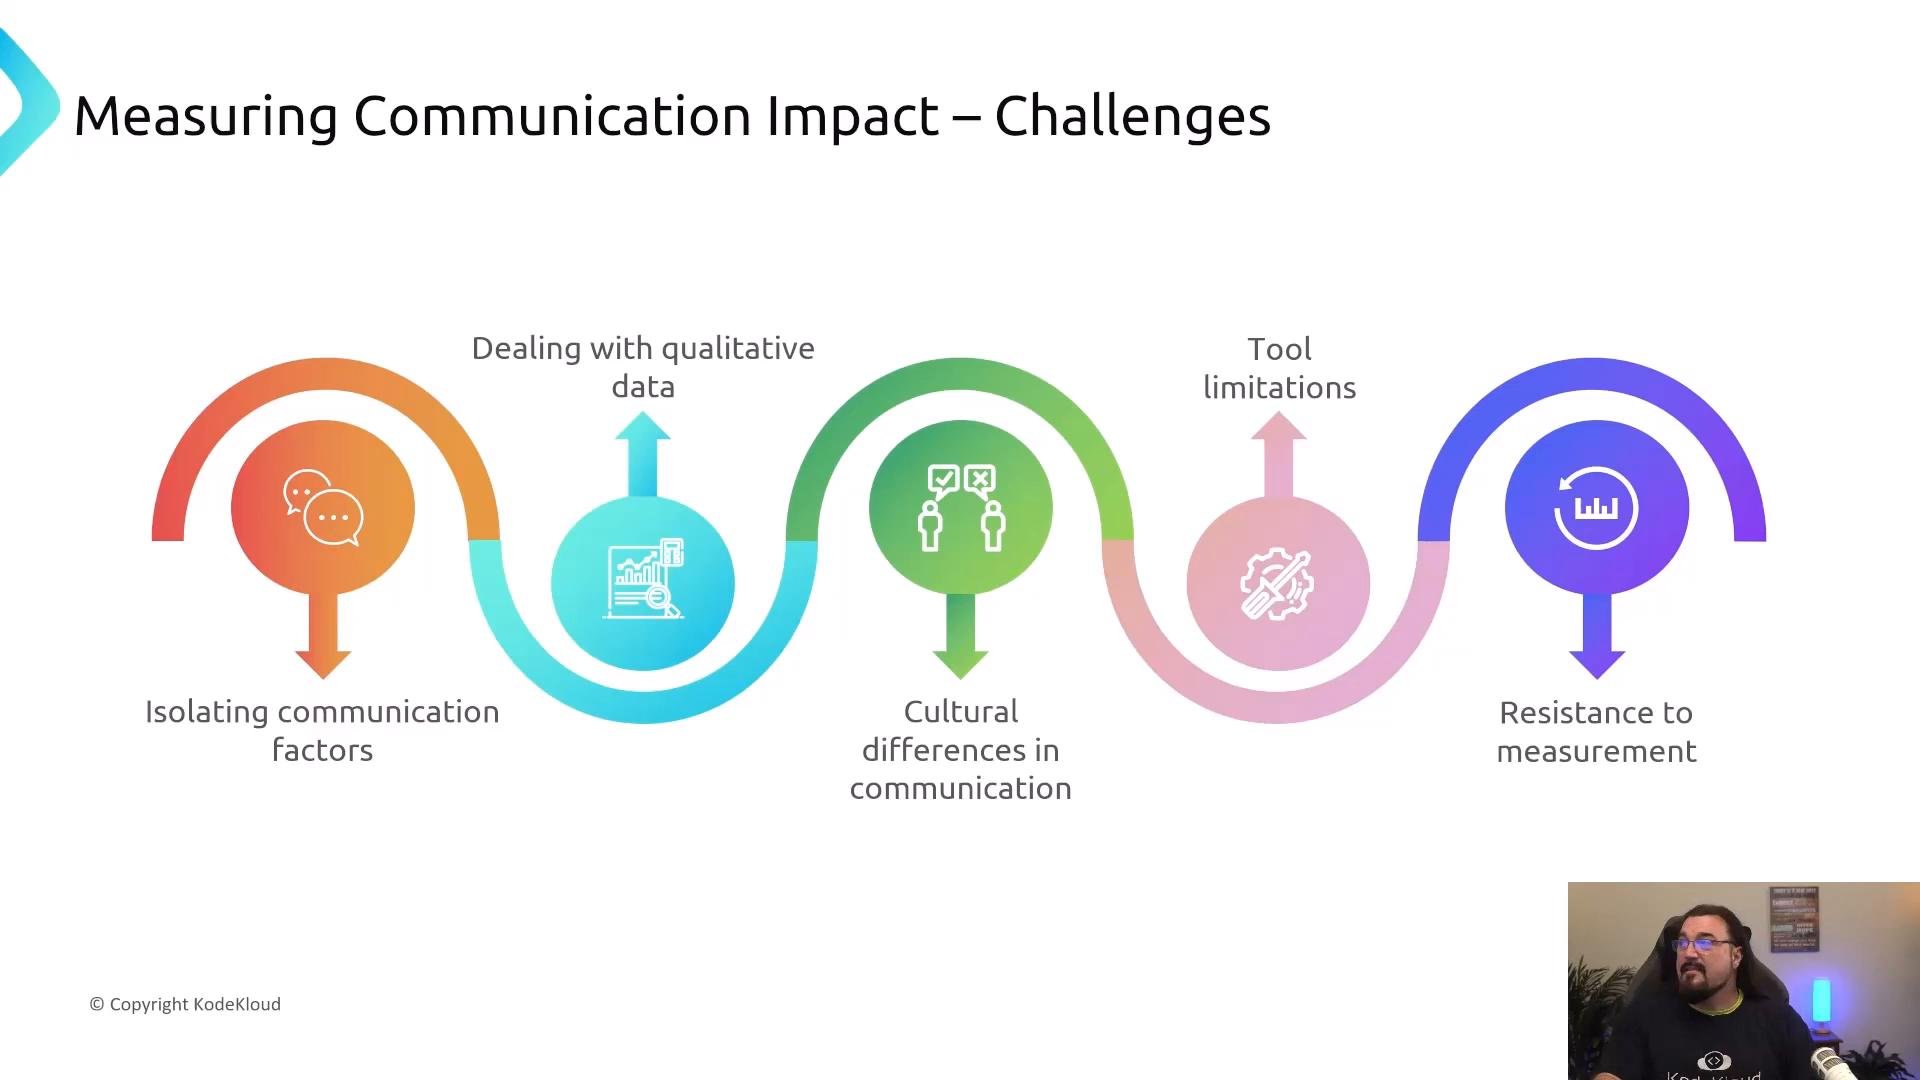
Challenges:

* Many communication attributes are qualitative and resist simple numeric metrics.
* Cultural and regional communication differences affect baseline behavior.
* Tooling limits: some platforms require paid plans to export telemetry.
* Privacy and trust: excessive measurement can erode morale and trust.
* Attribution: isolating communication effects from code, process, or infra changes is hard.

Mitigations:

* Use aggregated, anonymized metrics where possible.
* Complement quantitative signals with interviews and surveys.
* Start small with clearly scoped experiments to test causality.
* Be transparent about measurement goals and how data will be used.
<Frame>
  <img src="https://mintcdn.com/kodekloud-c4ac6d9a/I2RNlSZgLhKXJPs-/images/DevOps-Soft-Skills-Speaking-Value-to-Non-Technical-Audiences/Continuous-Improvement/Measuring-the-impact-of-communication-on-DevOps-success/measuring-communication-impact-challenges.jpg?fit=max&auto=format&n=I2RNlSZgLhKXJPs-&q=85&s=72a01839825088b96567e20d86d45f74" alt="A presentation slide titled &#x22;Measuring Communication Impact – Challenges&#x22; showing a colorful infographic of five challenges (isolating communication factors; dealing with qualitative data; cultural differences in communication; tool limitations; resistance to measurement) with matching icons. A person appears in the lower-right corner, likely the presenter." width="1920" height="1080" data-path="images/DevOps-Soft-Skills-Speaking-Value-to-Non-Technical-Audiences/Continuous-Improvement/Measuring-the-impact-of-communication-on-DevOps-success/measuring-communication-impact-challenges.jpg" />
</Frame>

<Callout icon="warning" color="#FF6B6B">
  When collecting communication data, be transparent with teams about what you measure and why. Prioritize privacy and use aggregated, anonymized metrics whenever possible to maintain trust.
</Callout>

Despite the challenges, combining quantitative analysis with qualitative context produces practical insights that teams can act on to improve DevOps outcomes.

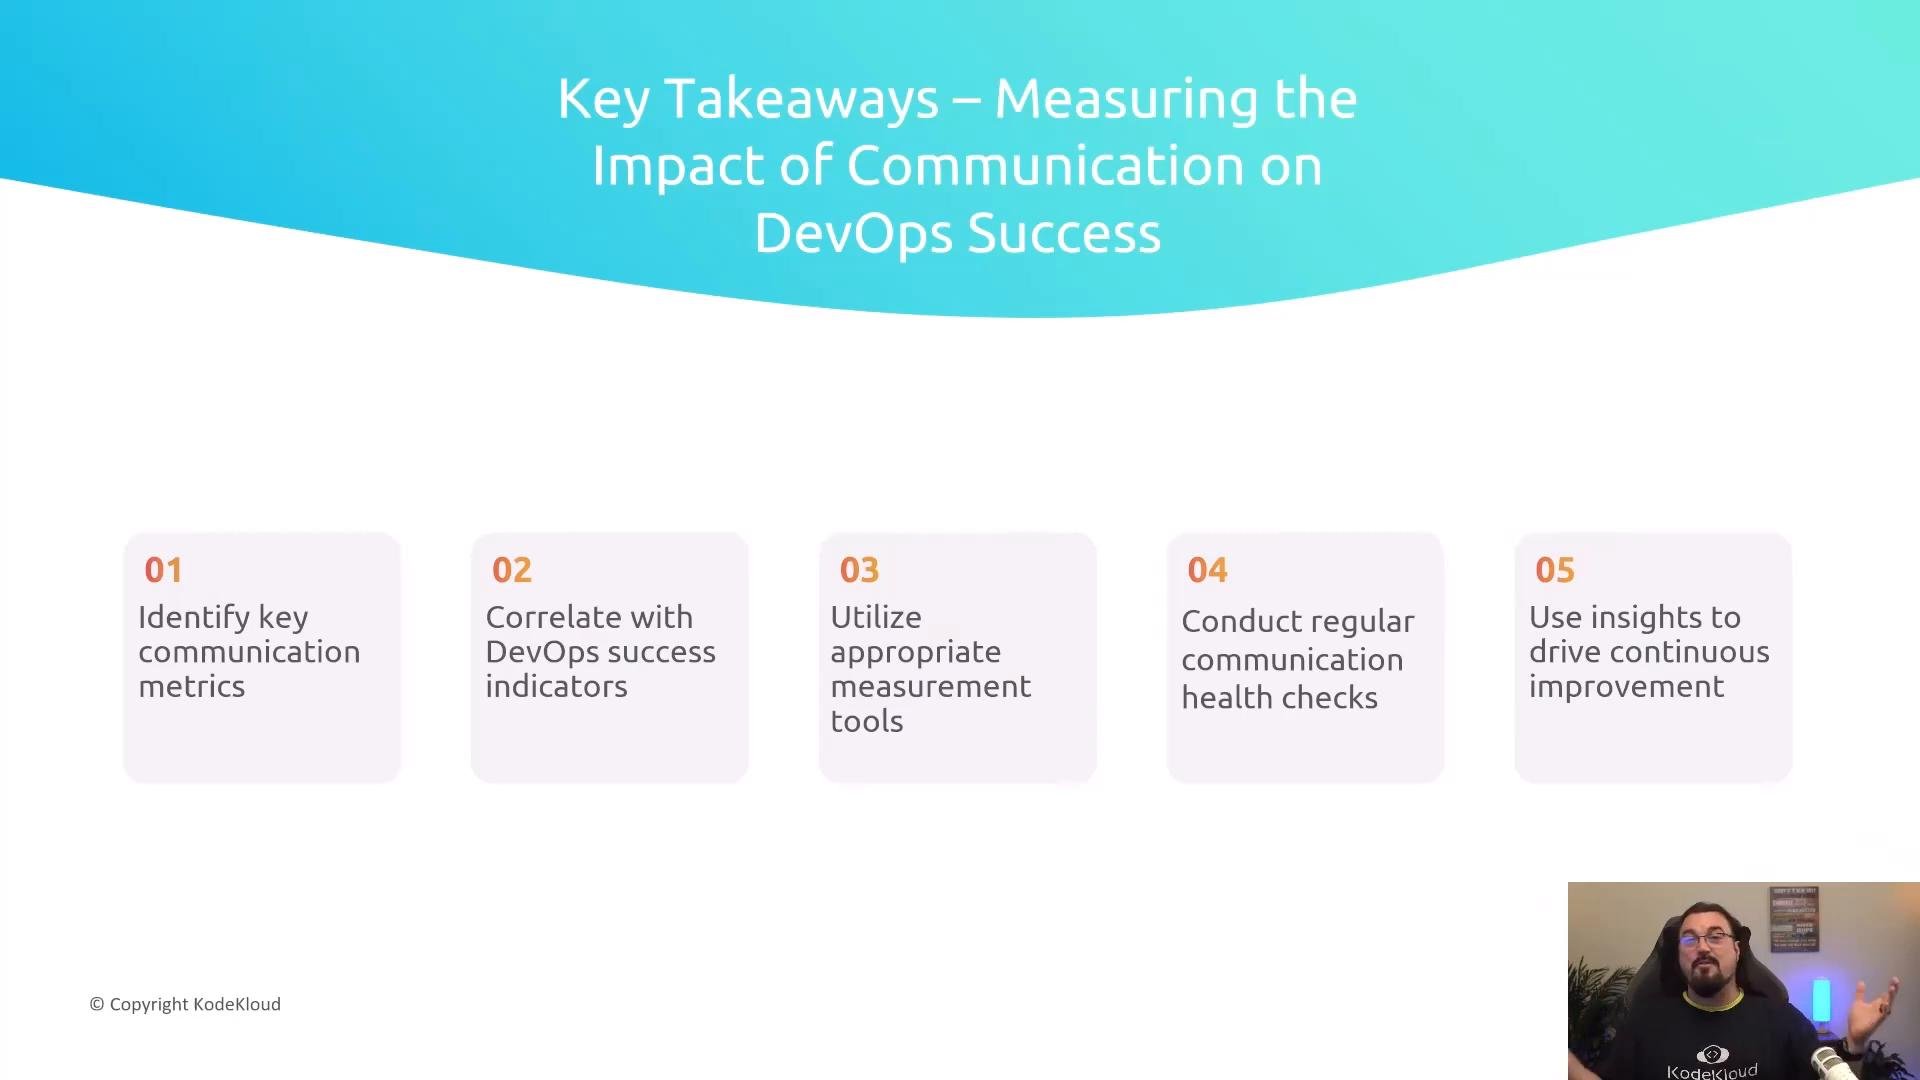
## Key takeaways

1. Choose relevant communication metrics for your organization: interaction frequency, response times, documentation quality, cross-team handoffs, and knowledge sharing.
2. Correlate communication metrics with DevOps outcomes (DORA metrics and customer satisfaction) but avoid over-interpreting correlation as causation.
3. Use reliable tools and data sources—don’t guess when data is available.
4. Conduct regular communication health checks to find patterns and bottlenecks.
5. Iterate: apply targeted changes (e.g., alert integrations, incident templates), measure the effect, and repeat.
<Frame>
  <img src="https://mintcdn.com/kodekloud-c4ac6d9a/I2RNlSZgLhKXJPs-/images/DevOps-Soft-Skills-Speaking-Value-to-Non-Technical-Audiences/Continuous-Improvement/Measuring-the-impact-of-communication-on-DevOps-success/measuring-devops-communication-impact.jpg?fit=max&auto=format&n=I2RNlSZgLhKXJPs-&q=85&s=ccbf6f423315d43d78e79c9feddee8ef" alt="A presentation slide titled &#x22;Key Takeaways – Measuring the Impact of Communication on DevOps Success&#x22; showing five numbered points about identifying communication metrics, correlating them with DevOps success, using measurement tools, conducting health checks, and driving continuous improvement. A small inset video of a person speaking appears in the bottom-right corner." width="1920" height="1080" data-path="images/DevOps-Soft-Skills-Speaking-Value-to-Non-Technical-Audiences/Continuous-Improvement/Measuring-the-impact-of-communication-on-DevOps-success/measuring-devops-communication-impact.jpg" />
</Frame>

Further reading and tools:

* DORA research and metrics: [https://devops-research.com/research.html](https://devops-research.com/research.html)
* Jira: [https://www.atlassian.com/software/jira](https://www.atlassian.com/software/jira)
* Slack: [https://slack.com](https://slack.com)
* Microsoft Teams: [https://www.microsoft.com/en/microsoft-teams/group-chat-software](https://www.microsoft.com/en/microsoft-teams/group-chat-software)
* Git documentation: [https://git-scm.com](https://git-scm.com)

I'm Michael Forrester. Thank you for reading.

<CardGroup>
  <Card title="Watch Video" icon="video" cta="Learn more" href="https://learn.kodekloud.com/user/courses/devops-soft-skills-speaking-value-to-non-technical-audiences/module/e70373ca-d7e0-4912-aed0-8485b2e09655/lesson/2b255a82-fdad-4239-8afe-553af5d86a50" />
</CardGroup>


This documentation is built and hosted on [Mintlify](https://mintlify.com), a developer documentation platform.