> ## Documentation Index
> Fetch the complete documentation index at: https://notes.kodekloud.com/llms.txt
> Use this file to discover all available pages before exploring further.
# Demo Prometheus Alert Manager Alerts Slack Notifications
> This tutorial covers integrating Prometheus with Alertmanager and configuring Slack notifications for alerts.
In this tutorial, you’ll learn how to integrate Prometheus (deployed by Istio) with Alertmanager, define custom alerting rules, and send notifications to Slack. We’ll cover:
* Inspecting Istio’s default Prometheus configuration
* Adding Alertmanager to Prometheus
* Writing and applying alerting rules
* Configuring Slack notifications in Alertmanager
* Testing alerts and silencing notifications
## 1 Inspect the default Istio Prometheus configuration
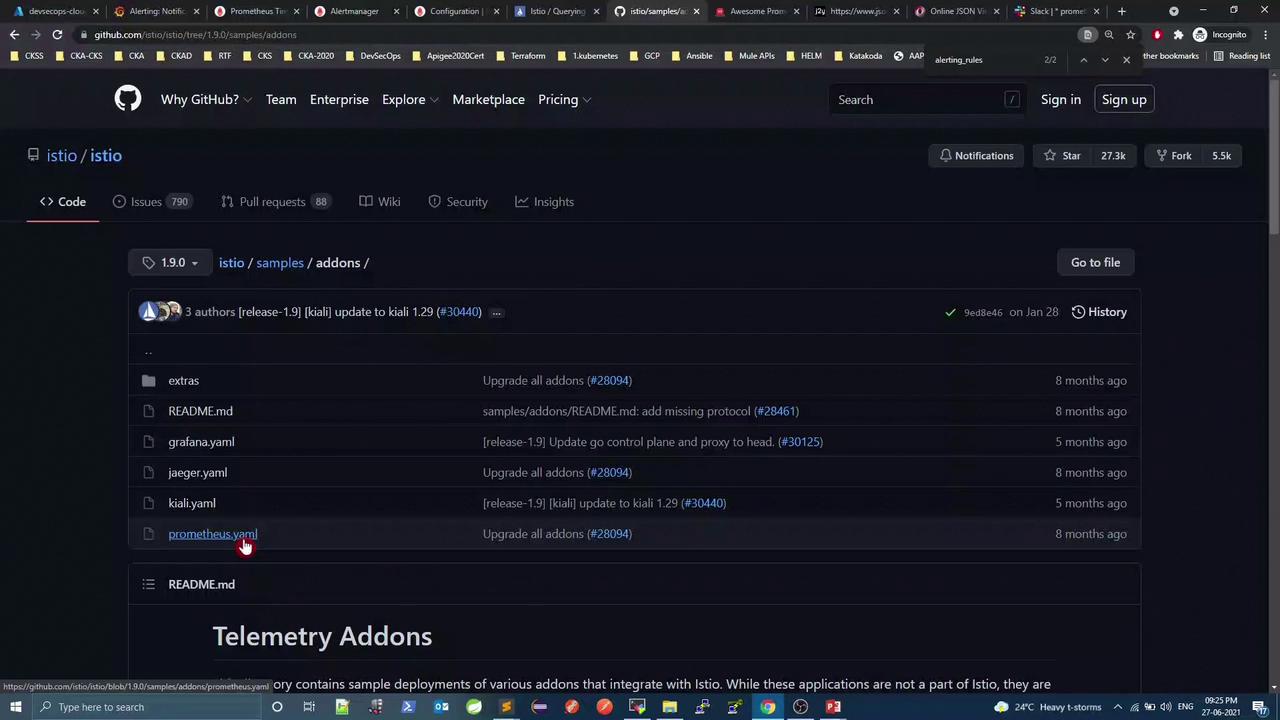
Istio’s add-ons include a Prometheus deployment whose `ConfigMap` defines scrape targets and placeholder alerts. It also deploys:
* A ServiceAccount for Prometheus
* A ConfigMap containing `prometheus.yml` and `alerting_rules.yml`
* ClusterRoles, RoleBindings, Service, and Deployment specs
Browse the Istio v1.9.0 repository on GitHub:

Under `samples/addons`, you’ll find the Prometheus example:
Excerpt from the default `ConfigMap`:
```yaml theme={null}
apiVersion: v1
kind: ConfigMap
metadata:
name: prometheus
namespace: istio-system
labels:
component: "server"
app: prometheus
data:
alerting_rules.yml: |
alerts: {}
prometheus.yml: |
global:
evaluation_interval: 1m
scrape_interval: 15s
scrape_timeout: 10s
rule_files:
- /etc/config/recording_rules.yml
- /etc/config/alerting_rules.yml
- /etc/config/rules
- /etc/config/alerts
scrape_configs:
- job_name: prometheus
static_configs:
- targets: ["localhost:9090"]
bearer_token_file: /var/run/secrets/kubernetes.io/serviceaccount/token
# …additional scrape_configs…
```
By default, there is no `alerting:` section in `prometheus.yml` pointing to Alertmanager.
## 2 Integrate Prometheus with Alertmanager
1. Open the Prometheus `ConfigMap` in the `istio-system` namespace:
```bash theme={null}
kubectl -n istio-system edit configmap prometheus
```
2. Under `prometheus.yml`, add:
```yaml theme={null}
alerting:
alertmanagers:
- static_configs:
- targets:
- devsecops_demo.eastus.cloudapp.azure.com:9093
```
3. Save, then restart Prometheus:
```bash theme={null}
kubectl -n istio-system delete pod -l app=prometheus
```
4. In the Prometheus UI, go to **Status → Configuration** to verify the Alertmanager endpoint.
## 3 Define custom alerting rules
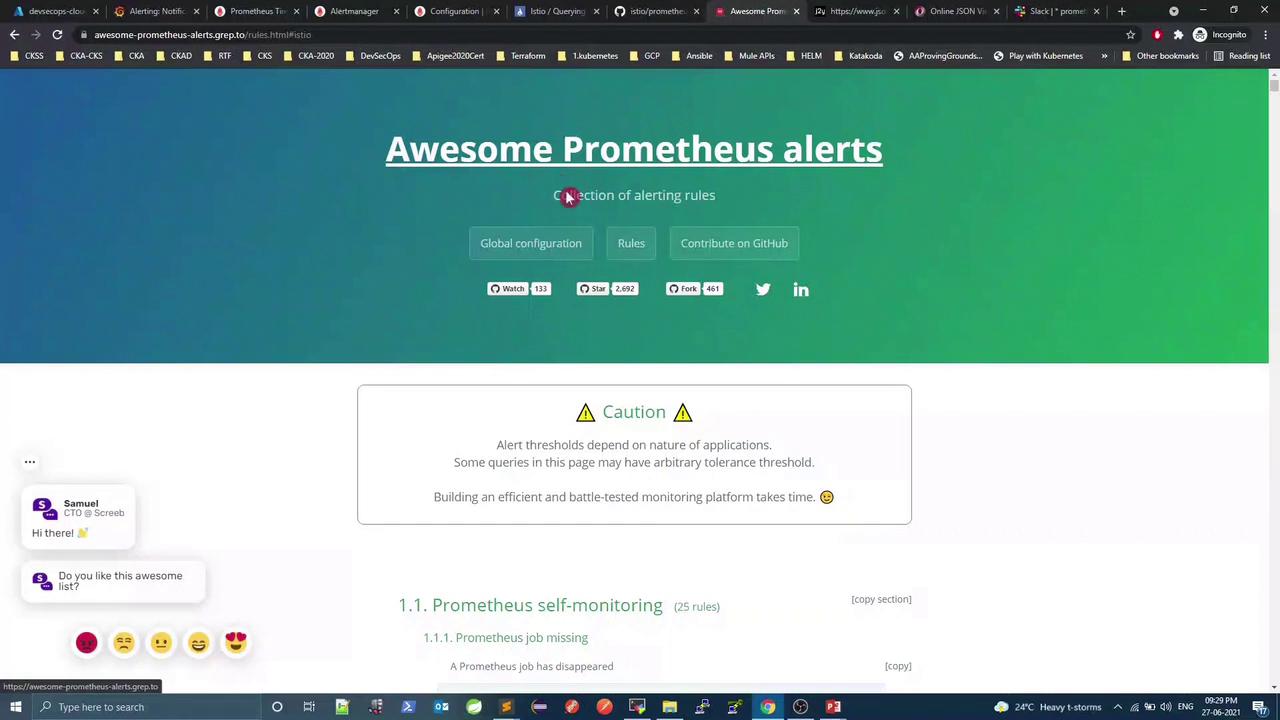
Edit `alerting_rules.yml` in the same `ConfigMap` to add your rules. For inspiration, see [Awesome Prometheus Alerts](https://github.com/samber/awesome-prometheus-alerts):
### 3.1 Example rule group
```yaml theme={null}
groups:
- name: Infrastructure
rules:
- alert: InstanceDown
expr: up == 0
for: 1m
labels:
severity: critical
annotations:
title: "Instance {{ $labels.instance }} down"
description: "{{ $labels.instance }} of job {{ $labels.job }} has been down for more than 1 minute."
- alert: KubernetesPodClientError
expr: istio_requests_total{reporter="destination",response_code="403"} > 10
for: 1m
labels:
severity: warning
annotations:
summary: "Kubernetes pod client error (instance {{ $labels.instance }})"
description: "Pod {{ $labels.instance }} of job {{ $labels.job }} reported client-side errors"
```
Apply the rules and restart Prometheus:
```bash theme={null}
kubectl -n istio-system delete pod -l app=prometheus
```
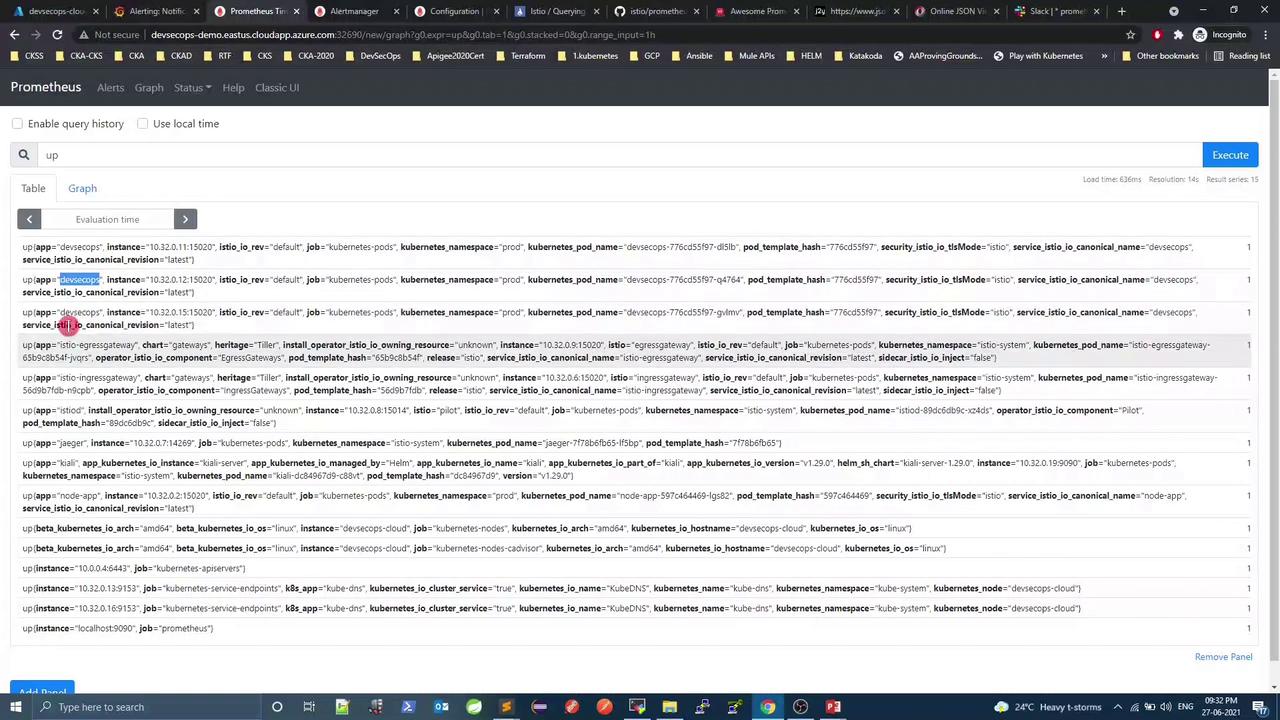
In the Prometheus UI under **Alerts** or **Rules**, you should see both alerts listed (initially *inactive*):
## 4 Configure Alertmanager for Slack notifications
Update your `alertmanager.yml`:
```yaml theme={null}
global:
resolve_timeout: 1m
slack_api_url: 'https://hooks.slack.com/services/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'
route:
receiver: 'slack-notifications'
receivers:
- name: 'slack-notifications'
slack_configs:
- send_resolved: true
channel: '#prometheus'
icon_url: 'https://avatars3.githubusercontent.com/u/3380462'
title: >
{{ if eq .Status "firing" }}
{{ .Alerts.Firing | len }} {{ .CommonLabels.alertname }} firing
{{ else }}
{{ .CommonLabels.alertname }} resolved
{{ end }}
title_link: '{{ template "slack.default.titlelink" . }}'
text: |
{{ range .Alerts }}
*Alert:* {{ .Annotations.summary }} {{ if .Labels.severity }}- `{{ .Labels.severity }}`{{ end }}
*Description:* {{ .Annotations.description }}
*Details:*
{{ range .Labels.SortedPairs }} • *{{ .Name }}:* {{ .Value }}
{{ end }}
{{ end }}
```
Reload Alertmanager:
```bash theme={null}
curl -X POST http://:9093/-/reload
```
## 5 Test end-to-end alerting
### 5.1 Simulate HTTP 403 errors
1. Deploy an Nginx pod and service in namespace `prod`:
```bash theme={null}
kubectl -n prod run nginx-403-demo --image=nginx --port=80
kubectl -n prod expose pod nginx-403-demo --port=80
```
2. Disable Istio mTLS:
```bash theme={null}
kubectl -n istio-system patch peerauthentication default \
--type merge \
-p '{"spec":{"mtls":{"mode":"DISABLE"}}}'
```
3. Remove the default page to force 403 responses:
```bash theme={null}
kubectl -n prod exec -it nginx-403-demo -- bash -c 'rm /usr/share/nginx/html/index.html'
```
4. Flood the pod with requests:
```bash theme={null}
kubectl -n prod exec -it nginx-403-demo -- bash -c 'while true; do curl -s localhost; sleep 0.1; done'
```
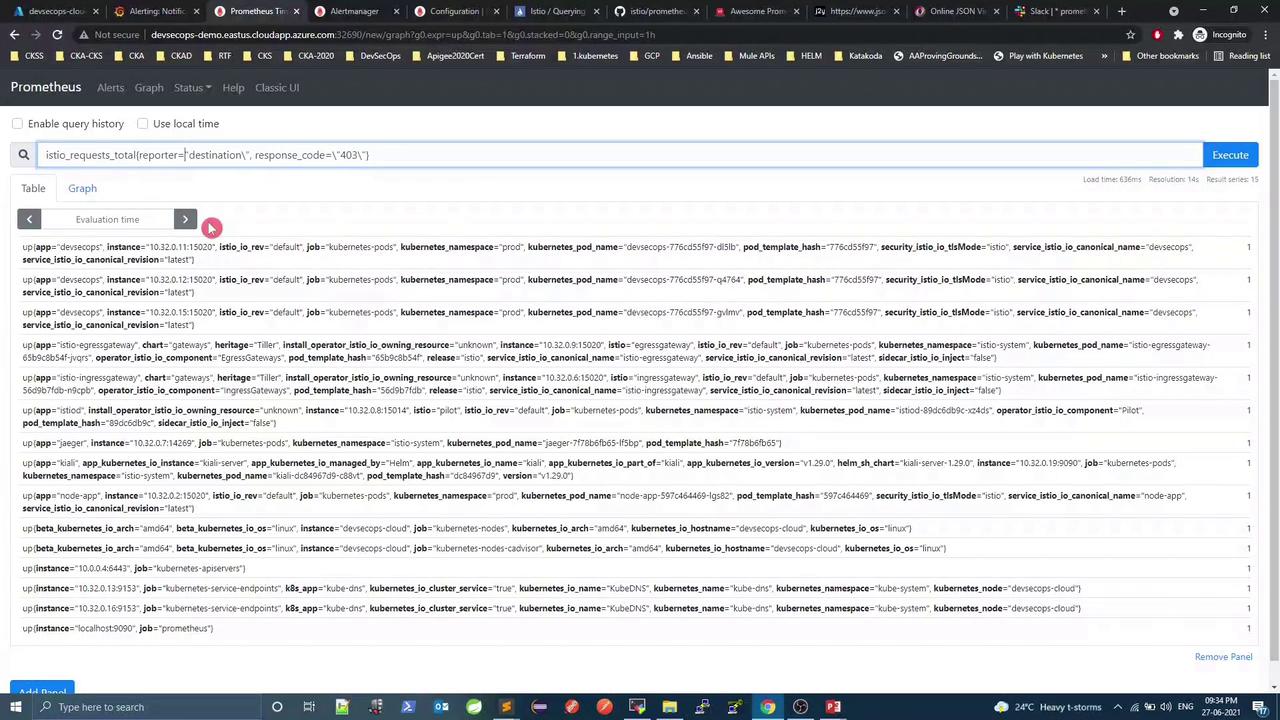
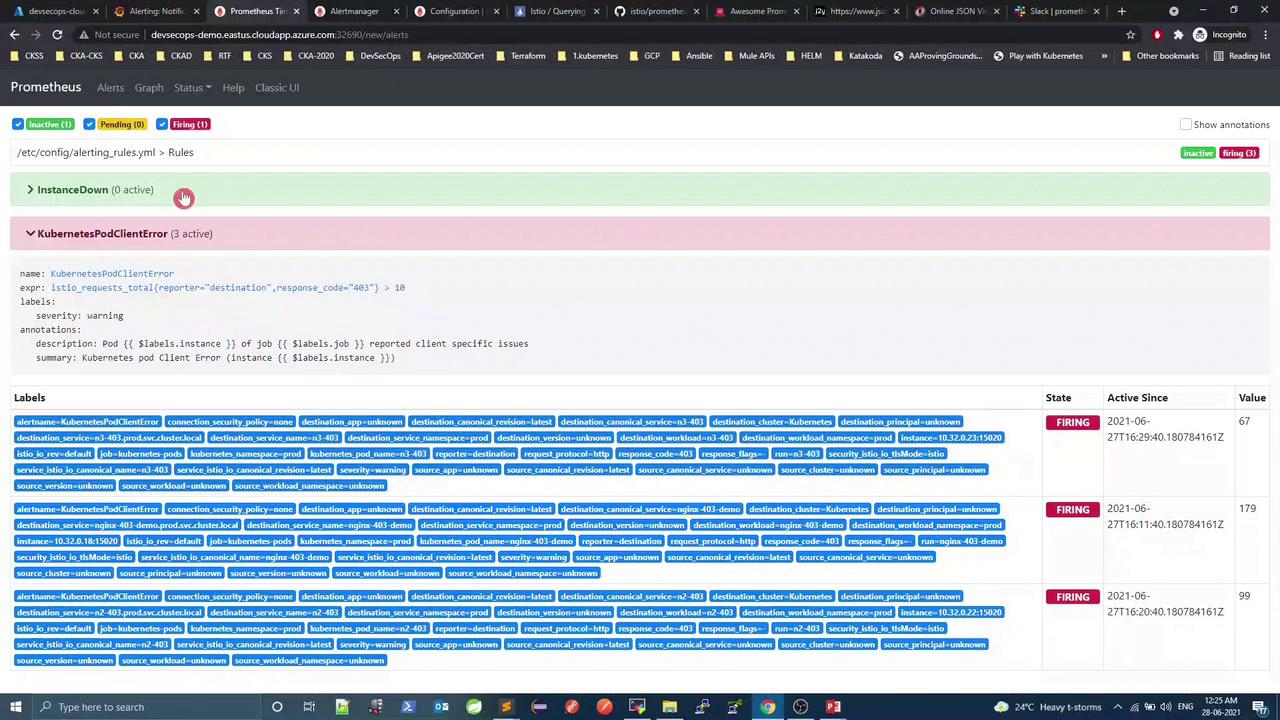
After \~60 s, **KubernetesPodClientError** should fire:
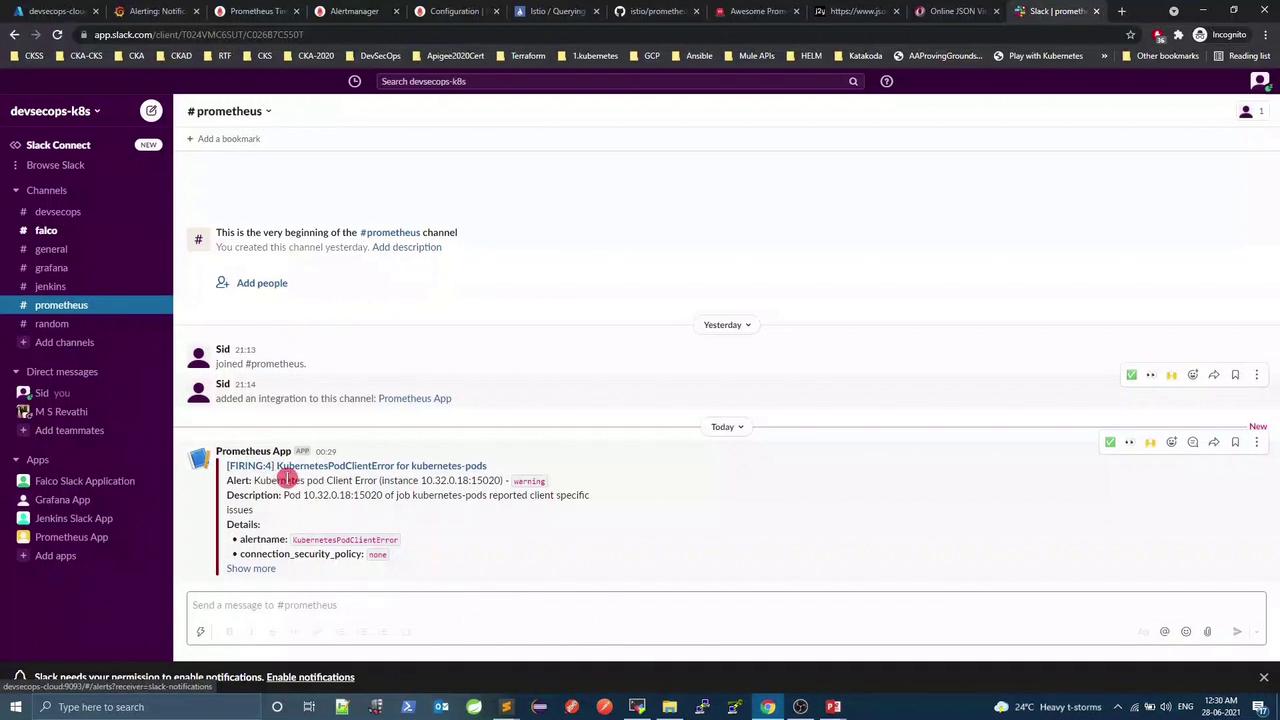
Check Alertmanager for firing alerts, then inspect Slack:
### 5.2 Silence active alerts
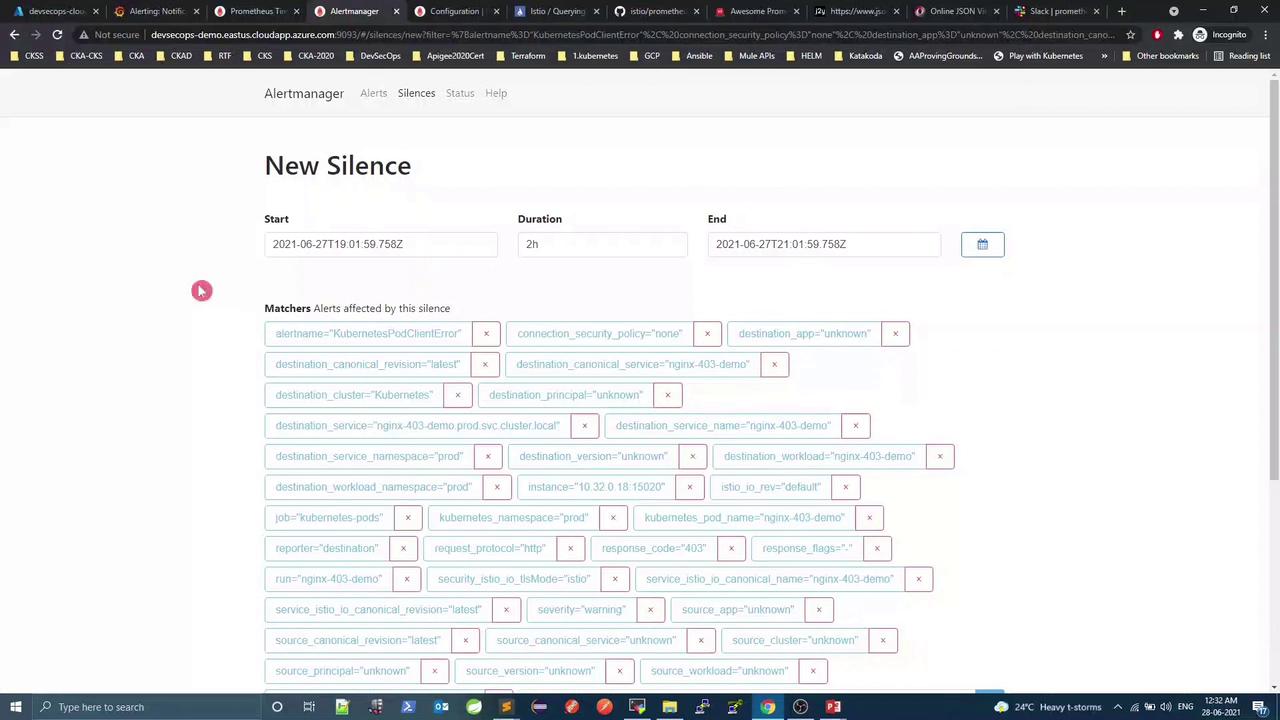
1. In Alertmanager, go to **Silences → New Silence**
2. Add matchers (e.g., `alertname="KubernetesPodClientError"`)
3. Set the duration and save
View active silences:
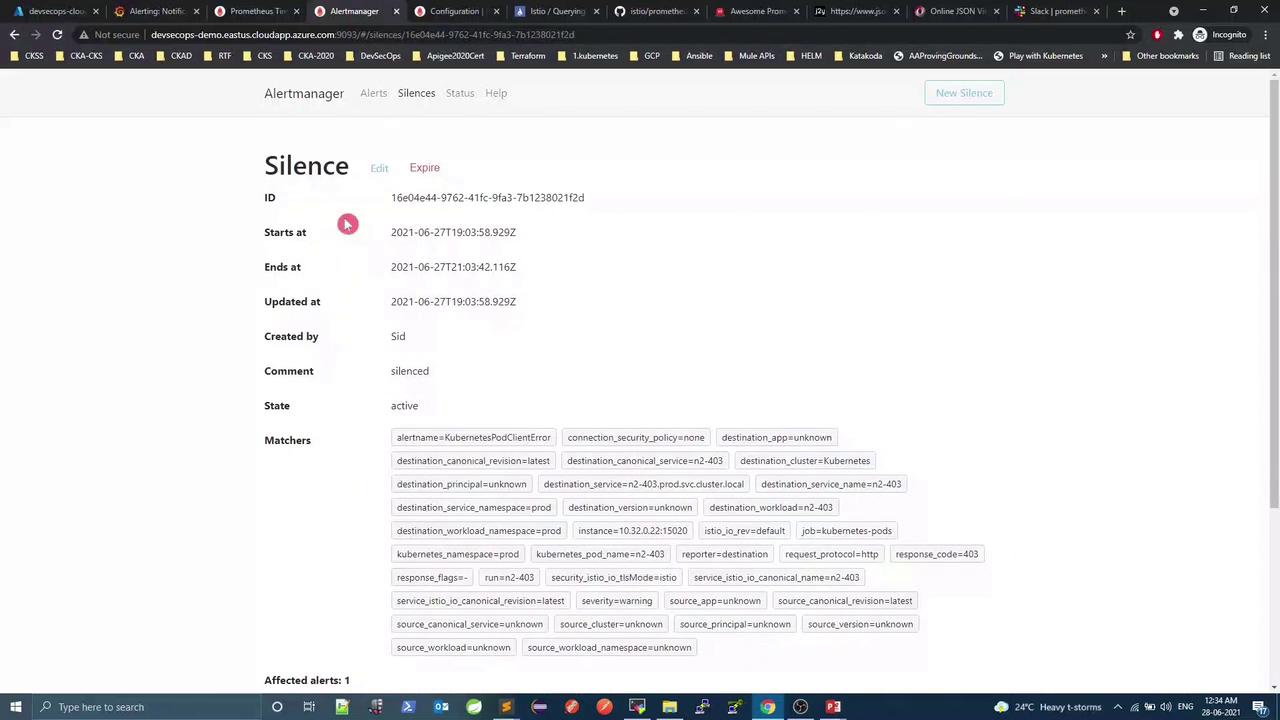
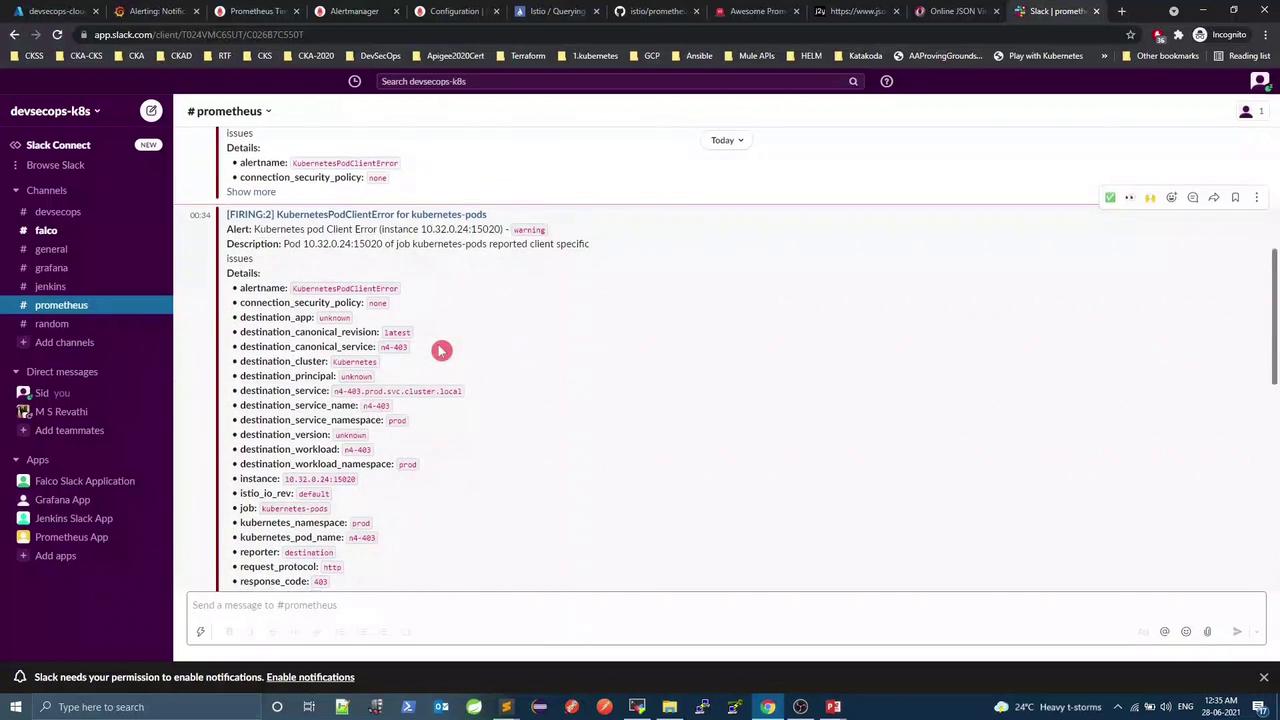
Deploy additional pods (`n2-403`, `n3-403`, `n4-403`); only unsilenced alerts will appear in Slack:
### 5.3 Test the InstanceDown alert
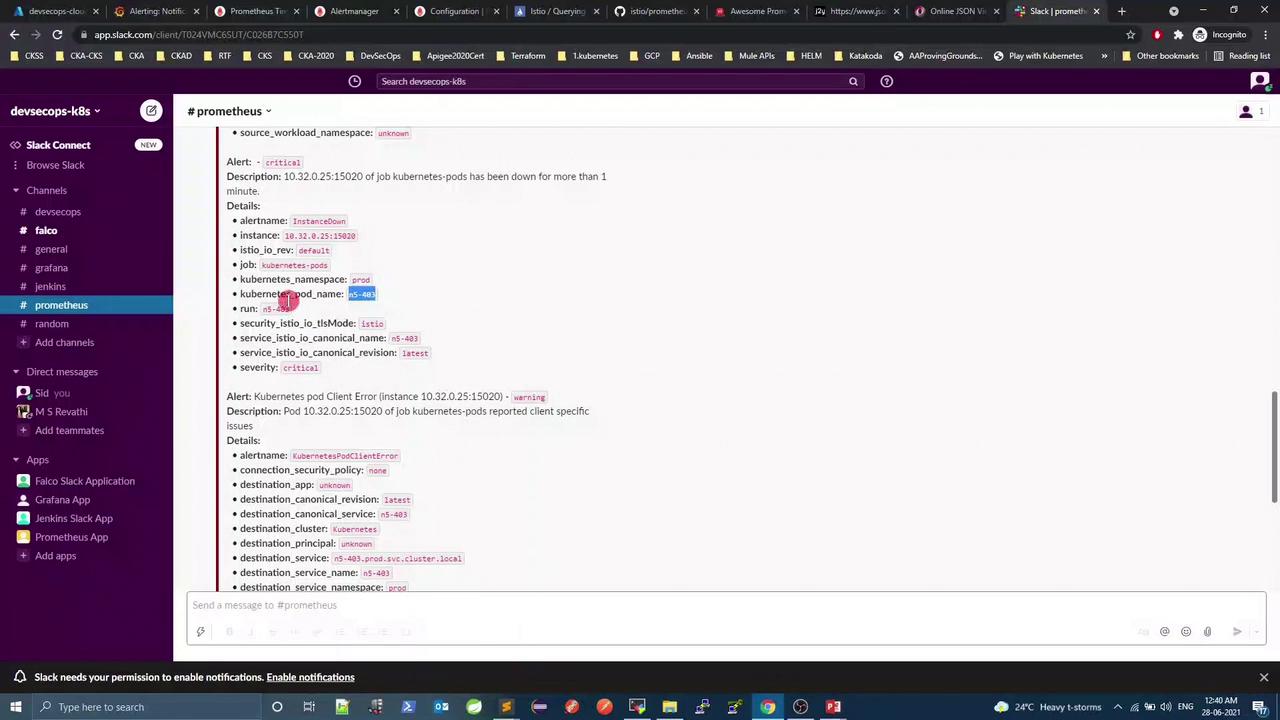
Delete one of the demo pods to trigger **InstanceDown**:
```bash theme={null}
kubectl -n prod delete pod n5-403-demo
```
After \~1 min, **InstanceDown** will fire and send a Slack notification:
## Conclusion
You have now:
1. Updated Istio’s Prometheus `ConfigMap` to point at Alertmanager
2. Defined custom alerting rules in Prometheus
3. Configured Alertmanager to send Slack notifications
4. Tested alert firing, notification delivery, and silencing
Extend this setup with other receivers such as email, PagerDuty, or OpsGenie.
## Links and References
* [Istio Prometheus Add-ons](https://istio.io/latest/docs/ops/integrations/prometheus/)
* [Alertmanager Slack Integration](https://prometheus.io/docs/alerting/latest/configuration/#slack_config)
* [Awesome Prometheus Alerts](https://github.com/samber/awesome-prometheus-alerts/)
* [Kubernetes Documentation](https://kubernetes.io/docs/)
* [Slack Incoming Webhooks](https://api.slack.com/messaging/webhooks/)