> ## Documentation Index
> Fetch the complete documentation index at: https://notes.kodekloud.com/llms.txt
> Use this file to discover all available pages before exploring further.
# Demo KubeScan
> This guide explains how to deploy OctarineSec KubeScan for continuous assessment and monitoring of Kubernetes workloads.
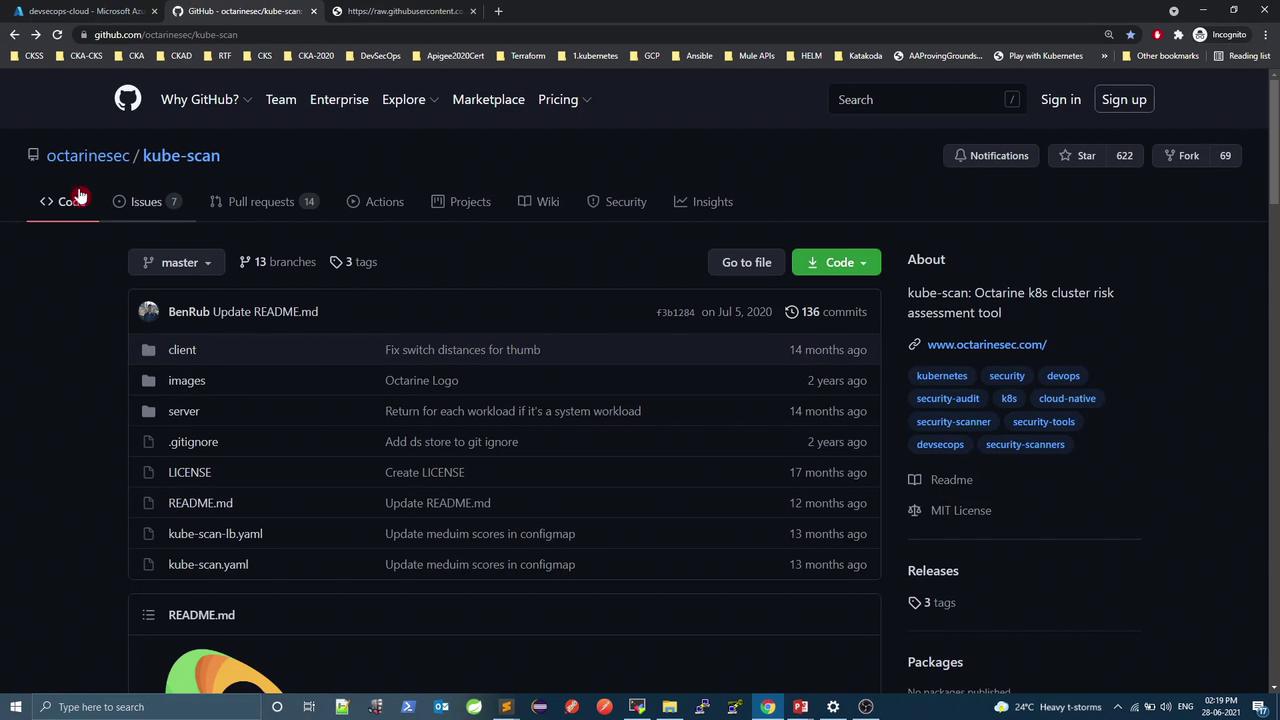
In this guide, you’ll learn how to deploy OctarineSec KubeScan to continuously assess and monitor Kubernetes workloads. KubeScan computes a risk score between **0 (no risk)** and **10 (high risk)** for each workload based on configurable runtime rules.
## Prerequisites
* A Kubernetes cluster (v1.16+)
* `kubectl` configured for your cluster
* Docker CLI for building and pushing images
* Git for cloning the repository
## 1. Clone & Build
Since the official images might not be publicly pullable, clone the source and build both UI and server components:
```bash theme={null}
git clone https://github.com/octarinesec/kube-scan.git
cd kube-scan
# Build the UI client
cd client
docker build -t .
docker push
# Build the server
cd ../server
docker build -t .
docker push
```
## 2. Configure Risk Scoring
Open `kube-scan.yaml` and locate the ConfigMap under the `kube-scan` namespace. Adjust thresholds or add rules to match your security policy:
```yaml theme={null}
apiVersion: v1
kind: Namespace
metadata:
name: kube-scan
---
apiVersion: v1
kind: ConfigMap
metadata:
name: kube-scan
namespace: kube-scan
data:
risk-config.yaml: |
expConst: 9 # Exploitability weight
impactConst: 3 # Impact weight
low: 3 # Low risk threshold
medium: 5 # Medium risk threshold
max: 10 # Maximum score
basic:
- name: "privileged"
title: "Workload is privileged"
shortDescription: "Privileged containers get full host access"
description: "Privileged containers can compromise host confidentiality."
integrity: "Low"
availability: "Low"
exploitability: "Moderate"
attackVector: "Local"
scope: "Host"
handler: "IsPrivileged"
```
You can extend `basic` or create new rule sets for network, resource limits, or Pod security policies.
## 3. Deploy KubeScan
Update the Deployment spec in `kube-scan.yaml` to use your built images:
```yaml theme={null}
apiVersion: apps/v1
kind: Deployment
metadata:
name: kube-scan
namespace: kube-scan
spec:
template:
spec:
containers:
- name: kube-scan-ui
image:
env:
- name: API_SERVER_PORT
value: "80"
- name: kube-scan
image:
env:
- name: KUBESCAN_RISK_CONFIG_FILE_PATH
value: "/etc/kubescan/risk-config.yaml"
volumeMounts:
- name: config
mountPath: /etc/kubescan
volumes:
- name: config
configMap:
name: kube-scan
```
Apply the complete manifest:
```bash theme={null}
kubectl apply -f kube-scan.yaml
kubectl -n kube-scan get all
```
## 4. Expose the UI Service
By default, the UI Service is `ClusterIP`. To access it externally, switch to `LoadBalancer` or `NodePort`:
```yaml theme={null}
apiVersion: v1
kind: Service
metadata:
name: kube-scan-ui
namespace: kube-scan
spec:
type: LoadBalancer
selector:
app: kube-scan
ports:
- port: 80
targetPort: 80
protocol: TCP
```
Reapply and get the external endpoint:
```bash theme={null}
kubectl apply -f kube-scan.yaml
kubectl -n kube-scan get svc kube-scan-ui
```
## 5. Access the Dashboard
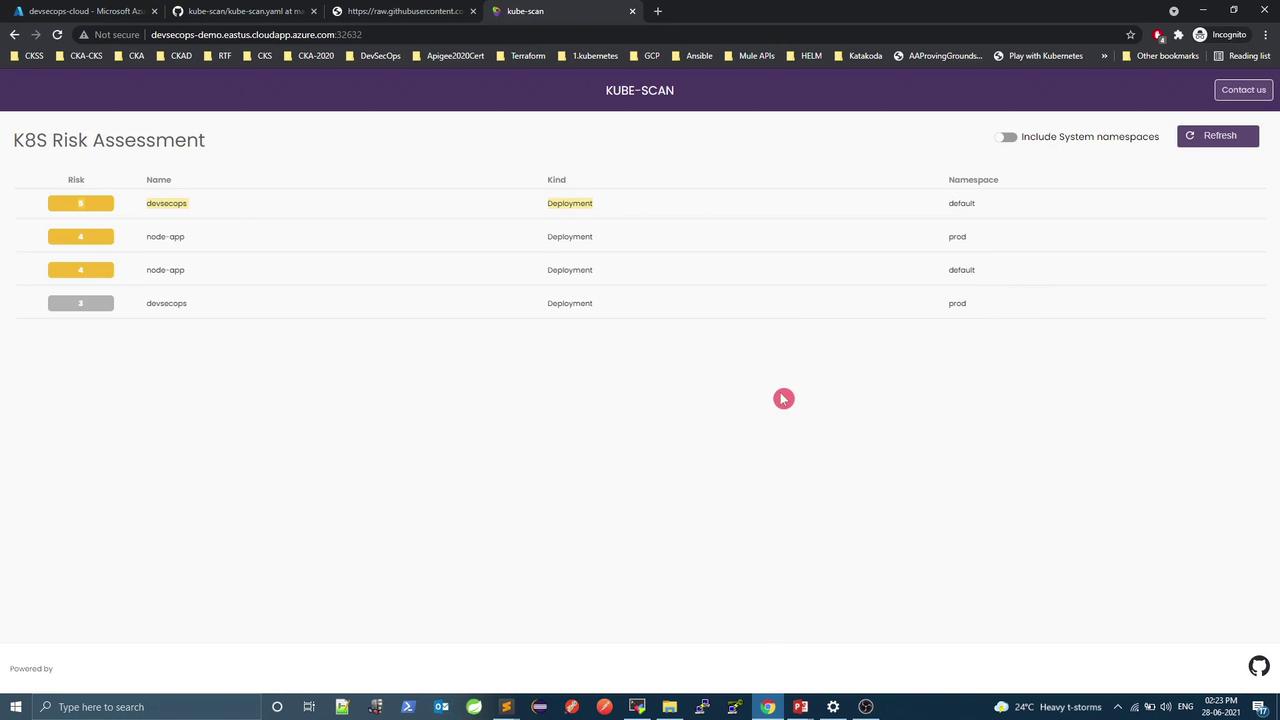
Open your browser at `http://:`. The **K8S Risk Assessment** dashboard displays all workloads with their risk scores.
## 6. Workload Risk Comparison
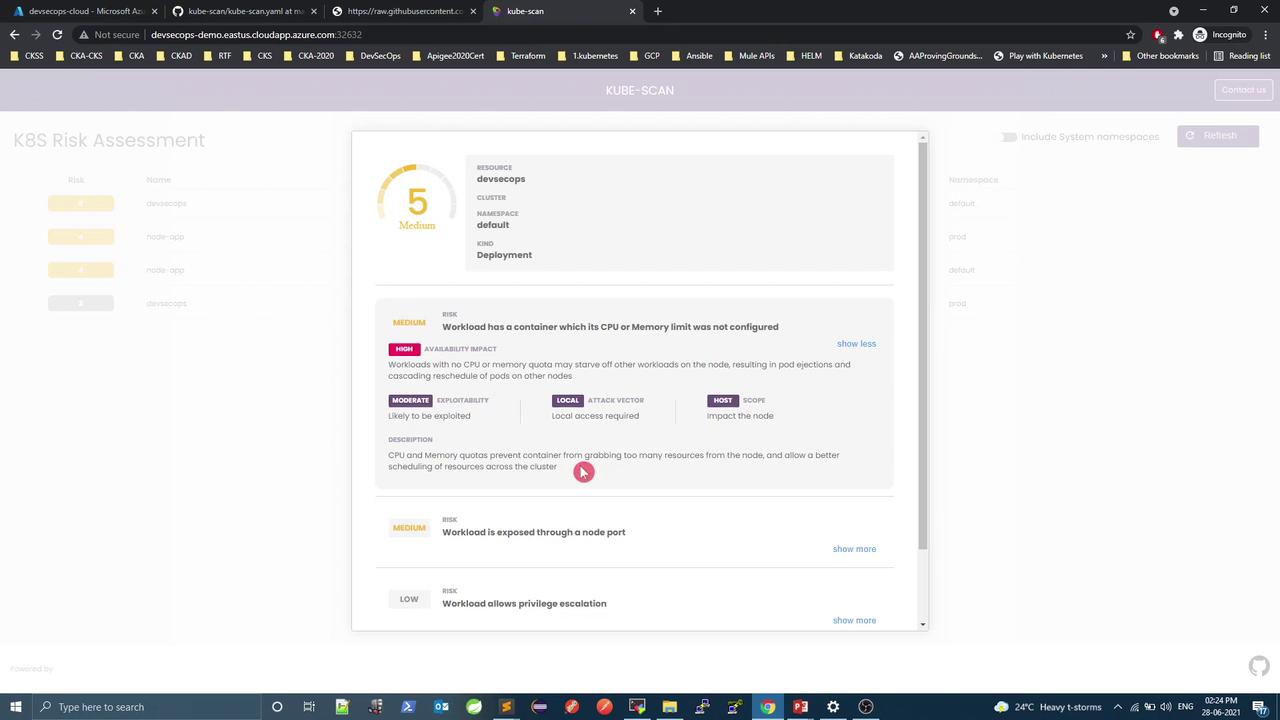
Compare two deployments of the same `DevSecOps` application:
| Environment | Risk Score | Security Context | Resource Limits |
| ----------- | ---------- | ----------------------------------------------------------- | -------------------------------------------------------------------- |
| Default | 5 (Medium) | None | None |
| Production | 3 (Low) | runAsNonRoot, noPrivilegeEscalation, readOnlyRootFilesystem | requests: cpu=200m, memory=256Mi
limits: cpu=500m, memory=512Mi |
### Default Deployment (Higher Risk)
```yaml theme={null}
apiVersion: apps/v1
kind: Deployment
metadata:
name: devsecops
spec:
template:
spec:
containers:
- name: devsecops-container
image: replace
```
### Production Deployment (Lower Risk)
```yaml theme={null}
apiVersion: apps/v1
kind: Deployment
metadata:
name: devsecops
namespace: prod
spec:
template:
spec:
containers:
- name: devsecops-container
image: replace
securityContext:
runAsNonRoot: true
allowPrivilegeEscalation: false
readOnlyRootFilesystem: true
resources:
requests:
cpu: "200m"
memory: "256Mi"
limits:
cpu: "500m"
memory: "512Mi"
```
## 7. System Namespace Pods
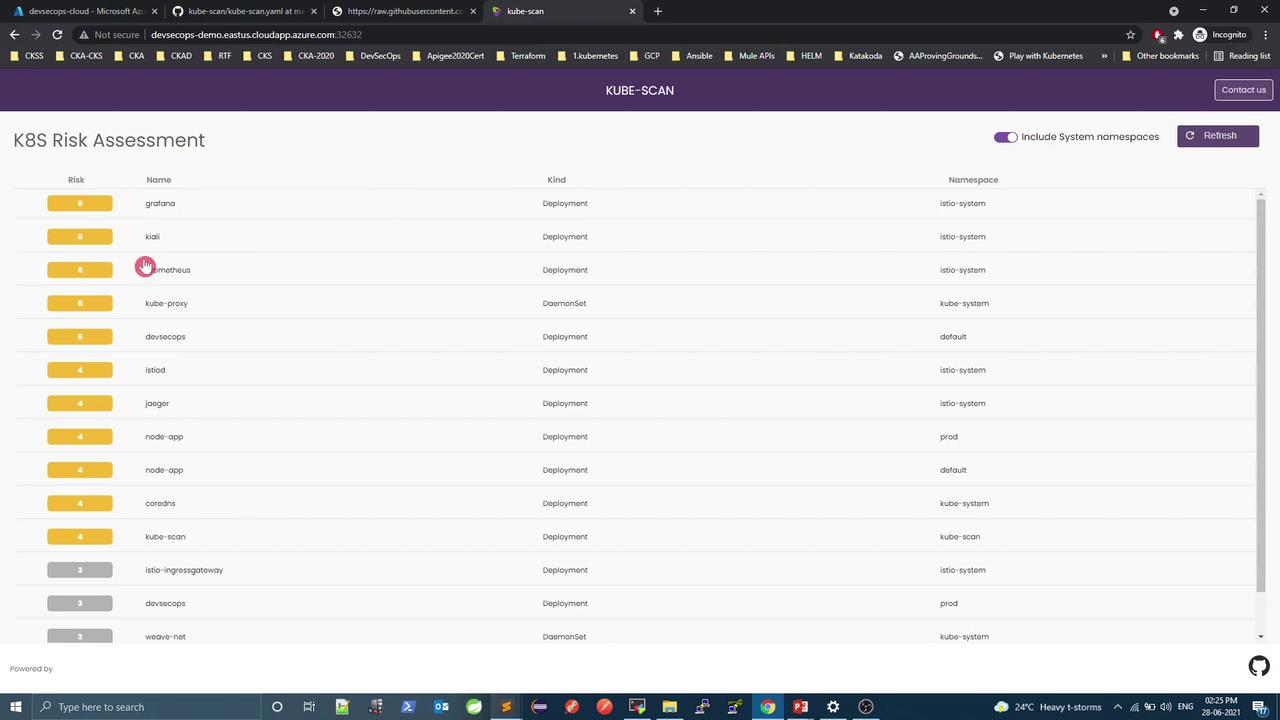
Enable “Show system pods” to include core components (e.g., `grafana`, `prometheus`) in the assessment.
## 8. Risky Nginx Pod Demo
Create a deliberately risky Pod and Service in both `default` and `prod` namespaces:
```yaml theme={null}
apiVersion: v1
kind: Pod
metadata:
name: nginx-risky-pod
labels:
run: nginx-risky-pod
spec:
shareProcessNamespace: true
volumes:
- name: vol
hostPath:
path: /etc
containers:
- name: nginx-risky-pod
image: nginx
securityContext:
allowPrivilegeEscalation: true
readOnlyRootFilesystem: false
capabilities:
add: ["ALL"]
volumeMounts:
- name: vol
mountPath: /opt
---
apiVersion: v1
kind: Service
metadata:
name: risky-pod-svc
spec:
selector:
run: nginx-risky-pod
ports:
- port: 80
targetPort: 80
protocol: TCP
```
Apply and force an immediate scan:
```bash theme={null}
kubectl apply -f risk-pod.yaml
kubectl apply -f risk-pod.yaml -n prod
kubectl -n kube-scan delete pod -l app=kube-scan
```
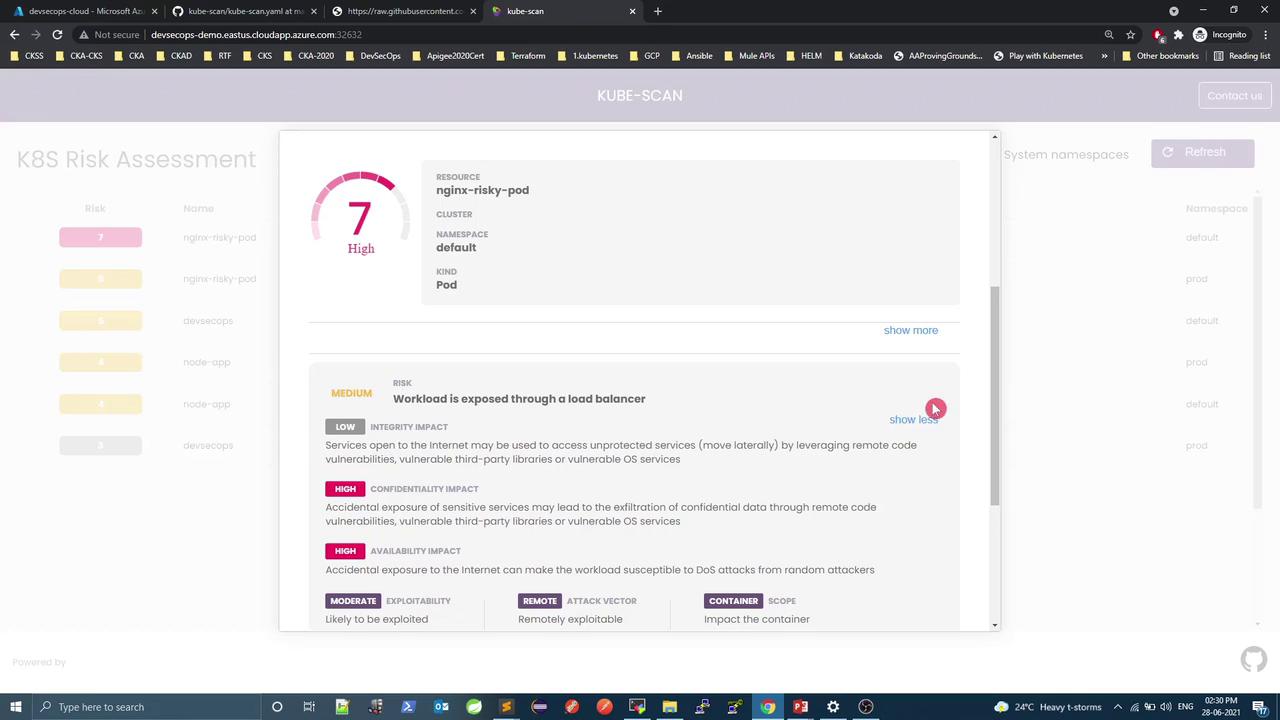
* In **default**, `nginx-risky-pod` scores **7 (High)** due to `hostPath`, `ALL` capabilities, missing limits, and LoadBalancer exposure.
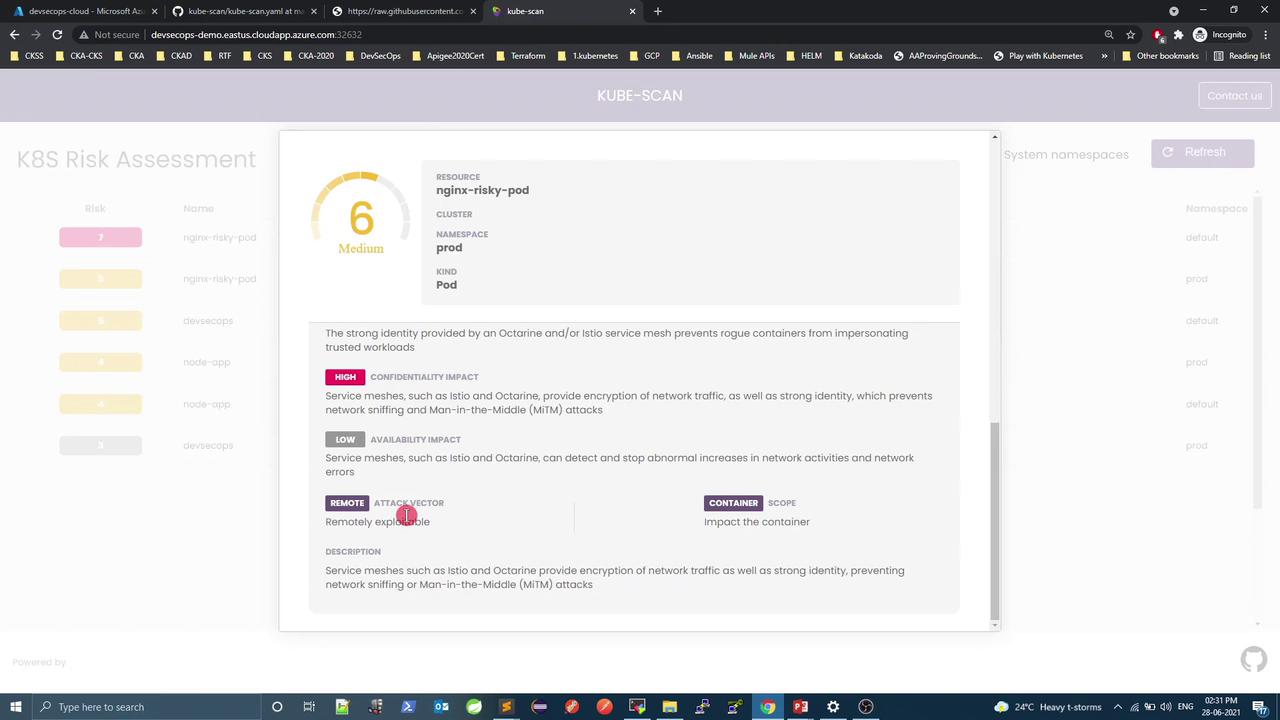
* In **prod** with an [Istio](https://istio.io) sidecar, the score drops to **6 (Medium)** thanks to service-mesh encryption and identity features.
## Conclusion
KubeScan provides an automated scoring engine to surface misconfigurations and risk hotspots. By reviewing scores and iteratively adding Pod security contexts, resource constraints, or service meshes, you can drive your cluster toward a more secure posture.
***
## Links and References
* [Kubernetes Concepts](https://kubernetes.io/docs/concepts/)
* [Docker Hub](https://hub.docker.com/)
* [Istio Service Mesh](https://istio.io/)
* [OctarineSec KubeScan GitHub](https://github.com/octarinesec/kube-scan)