> ## Documentation Index
> Fetch the complete documentation index at: https://notes.kodekloud.com/llms.txt
> Use this file to discover all available pages before exploring further.

# Demo Prometheus Grafana

> This guide explains how to monitor Kubernetes using Prometheus, Grafana, and Alertmanager, including setup, metrics querying, visualization, and alert configuration.

In this guide, you’ll learn how to integrate **Prometheus**, **Grafana**, and **Alertmanager** to monitor Kubernetes resources and push alerts to external services like Slack. We’ll cover:

* Exposing Grafana & Prometheus via NodePort
* Querying metrics with Prometheus (PromQL)
* Visualizing Istio data in Grafana dashboards
* Configuring alerting channels in Grafana
* Defining Prometheus alert rules and using Alertmanager
<Frame>
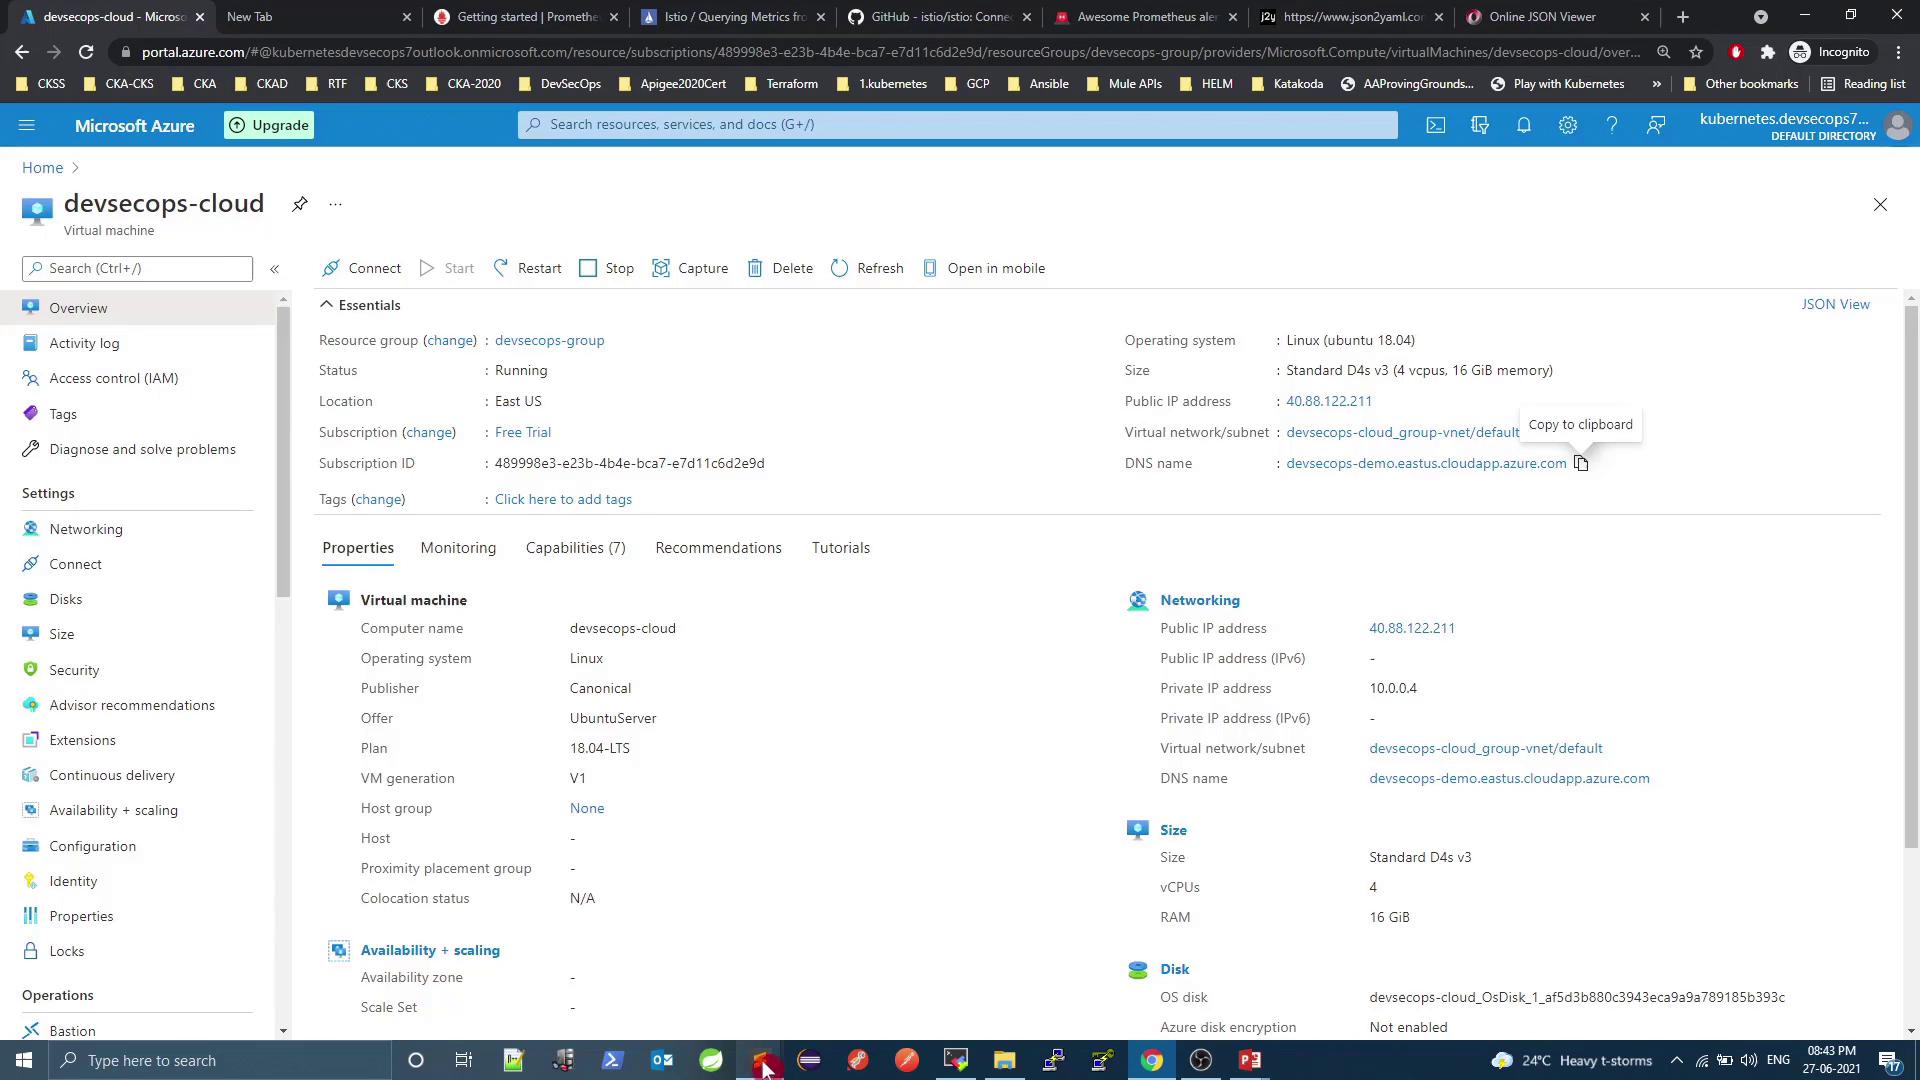
  ![The image shows the Azure portal interface displaying details of a virtual machine named "devsecops-cloud." It includes information such as the operating system, size, location, IP addresses, and subscription details.](https://kodekloud.com/kk-media/image/upload/v1752873770/notes-assets/images/DevSecOps-Kubernetes-DevOps-Security-Demo-Prometheus-Grafana/azure-portal-virtual-machine-details.jpg)
</Frame>

***

## 1. Exposing Grafana & Prometheus

By default, both services are deployed as `ClusterIP`, which prevents external access. To view dashboards from outside the cluster, change the Service type to `NodePort`.

| Service    | Default Type | NodePort Port | Access URL                       |
| ---------- | ------------ | ------------- | -------------------------------- |
| Grafana    | ClusterIP    | 3000:32556    | http\://\<VM\_PUBLIC\_DNS>:32556 |
| Prometheus | NodePort     | 9090:32690    | http\://\<VM\_PUBLIC\_DNS>:32690 |

<Callout icon="lightbulb" color="#1CB2FE">
  A `NodePort` service maps a port on each node’s IP to your service, allowing external HTTP/S access without an Ingress.
</Callout>

### 1.1 Expose Grafana

Check current services:

```bash theme={null}
kubectl -n istio-system get svc
# NAME       TYPE        CLUSTER-IP     PORT(S)
# grafana    ClusterIP   10.106.90.144  3000/TCP
# prometheus NodePort    10.108.8.197   9090:32458/TCP,20001:13086/TCP
```

Edit the Grafana Service and set `type: NodePort`:

```yaml theme={null}
apiVersion: v1
kind: Service
metadata:
  name: grafana
  namespace: istio-system
spec:
  type: NodePort
  selector:
    app.kubernetes.io/name: grafana
  ports:
    - port: 3000
      targetPort: 3000
      protocol: TCP
      name: service
```

Apply and verify:

```bash theme={null}
kubectl -n istio-system apply -f grafana-service.yaml
kubectl -n istio-system get svc grafana
# NAME      TYPE       CLUSTER-IP      PORT(S)
# grafana   NodePort   10.106.90.144   3000:32556/TCP
```

Access Grafana at `http://\<VM_PUBLIC_DNS>:32556`.\
Prometheus is already listening on `http://\<VM_PUBLIC_DNS>:32690`.

***

## 2. Exploring Metrics with Prometheus

Prometheus scrapes metrics at intervals defined in `prometheus.yml`:

```yaml theme={null}
global:
  scrape_interval: 15s  # scrape every 15 seconds
```

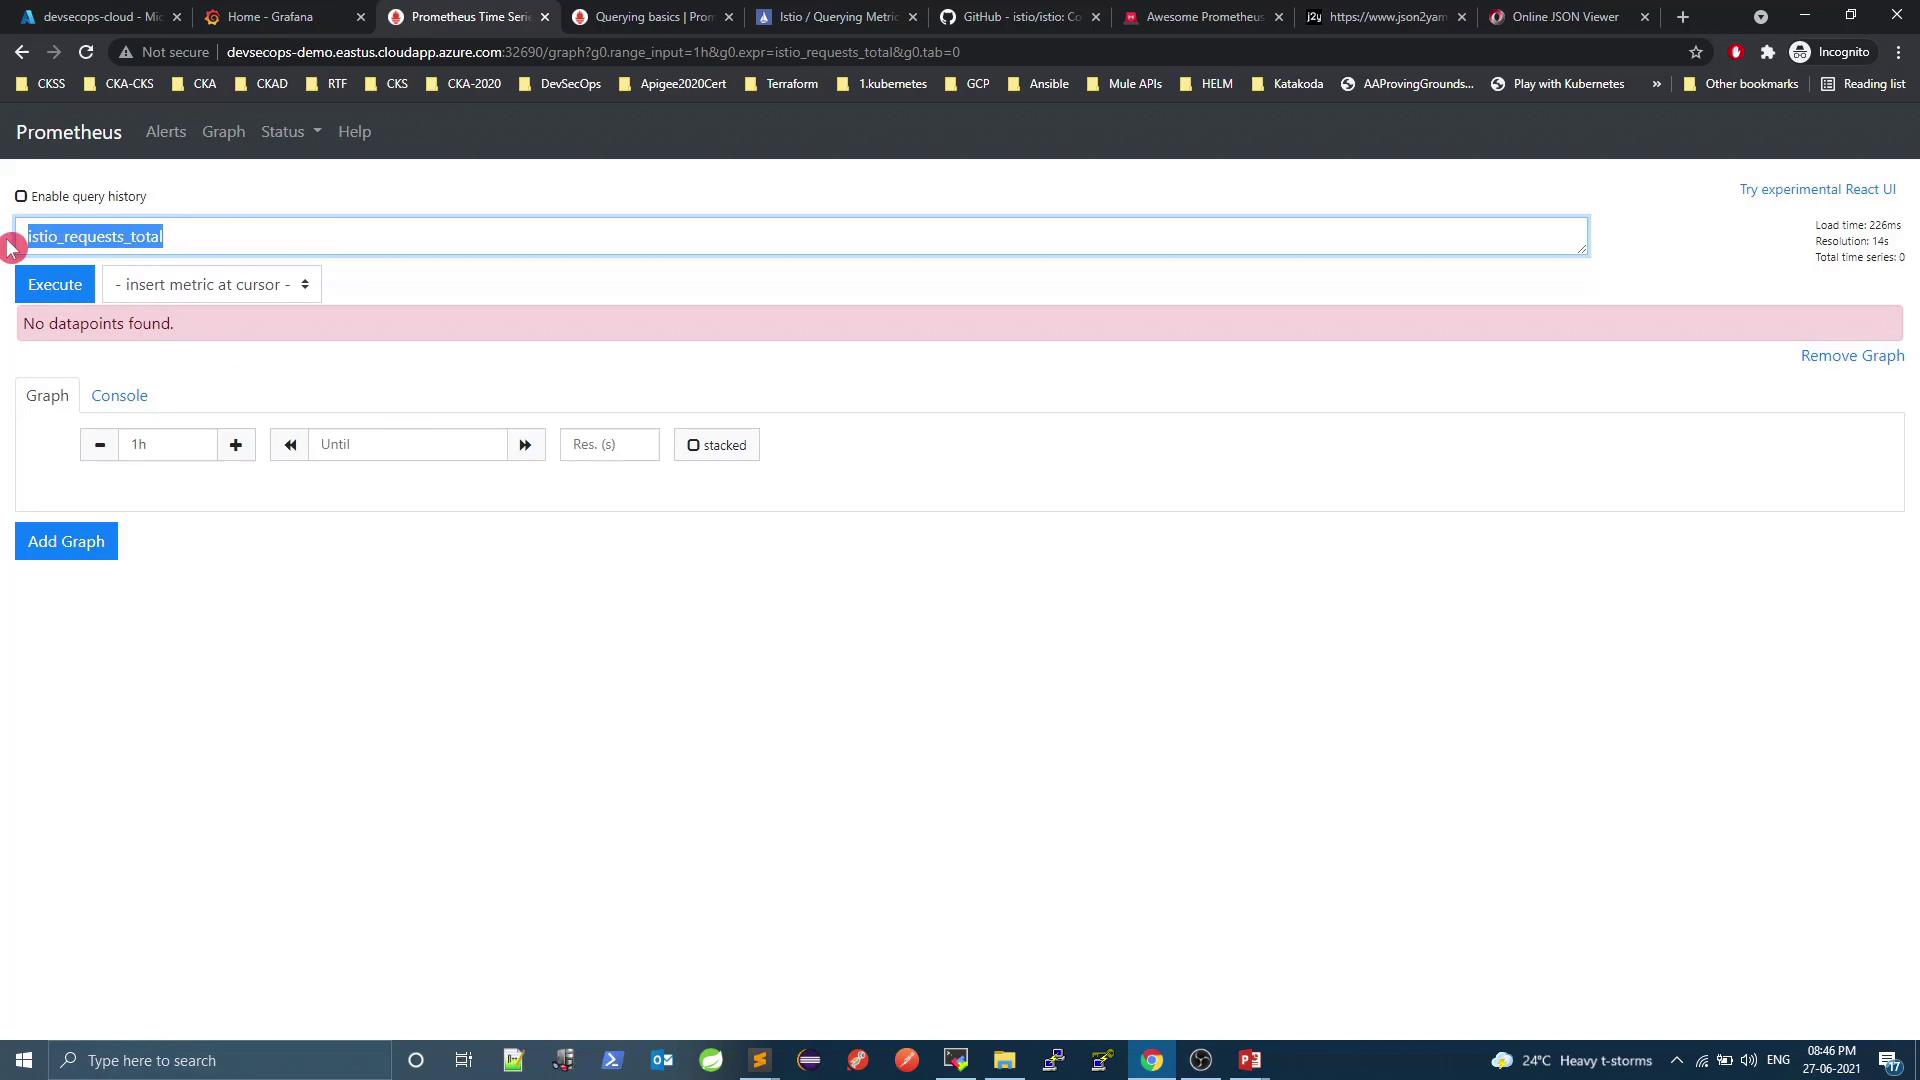
Since Istio injects service metrics automatically, you can use built-in dashboards or craft PromQL queries. For example:

```promql theme={null}
istio_requests_total
```
<Frame>
  ![The image shows a Prometheus interface with a query for "istio\_requests\_total" executed, but no data points are found. The interface includes options for graphing and console output.](https://kodekloud.com/kk-media/image/upload/v1752873771/notes-assets/images/DevSecOps-Kubernetes-DevOps-Security-Demo-Prometheus-Grafana/prometheus-istio-requests-query-no-data.jpg)
</Frame>

### 2.1 Generating Traffic

To populate metrics, send continuous HTTP requests via the Istio Ingress Gateway:

<Callout icon="triangle-alert" color="#FF6B6B">
  This loop will run indefinitely until you stop it (`Ctrl+C`). Ensure you target the correct host and port to avoid unintended load.
</Callout>

```bash theme={null}
while true; do
  curl -s http://<INGRESS_HOST>:<INGRESS_PORT>/increment/99
  sleep 0.1
done
```

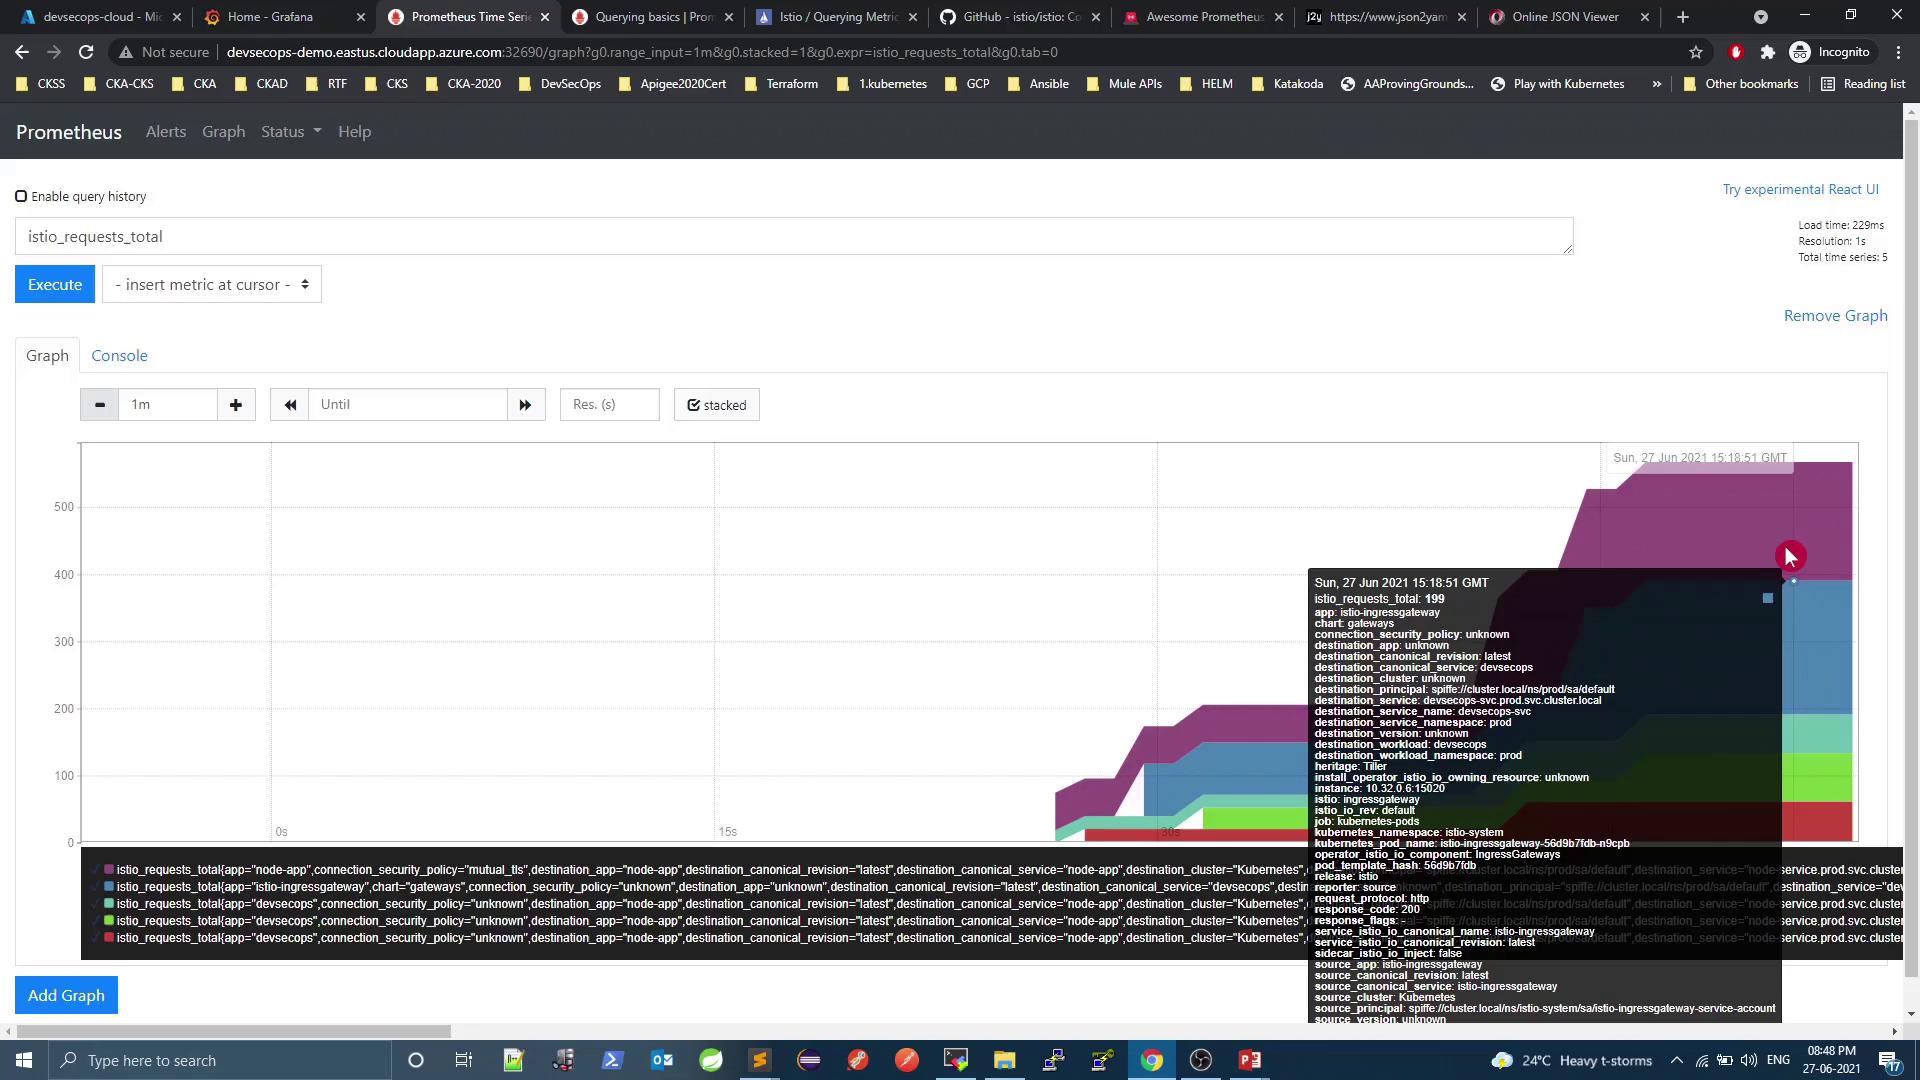
After a few seconds, refresh Prometheus and switch to **Graph** view. You should see:
<Frame>
  ![The image shows a Prometheus dashboard displaying a stacked graph of "istio\_requests\_total" metrics over time, with a tooltip providing detailed information about a specific data point.](https://kodekloud.com/kk-media/image/upload/v1752873772/notes-assets/images/DevSecOps-Kubernetes-DevOps-Security-Demo-Prometheus-Grafana/prometheus-dashboard-istio-requests-graph.jpg)
</Frame>

***

## 3. Visualizing Data in Grafana

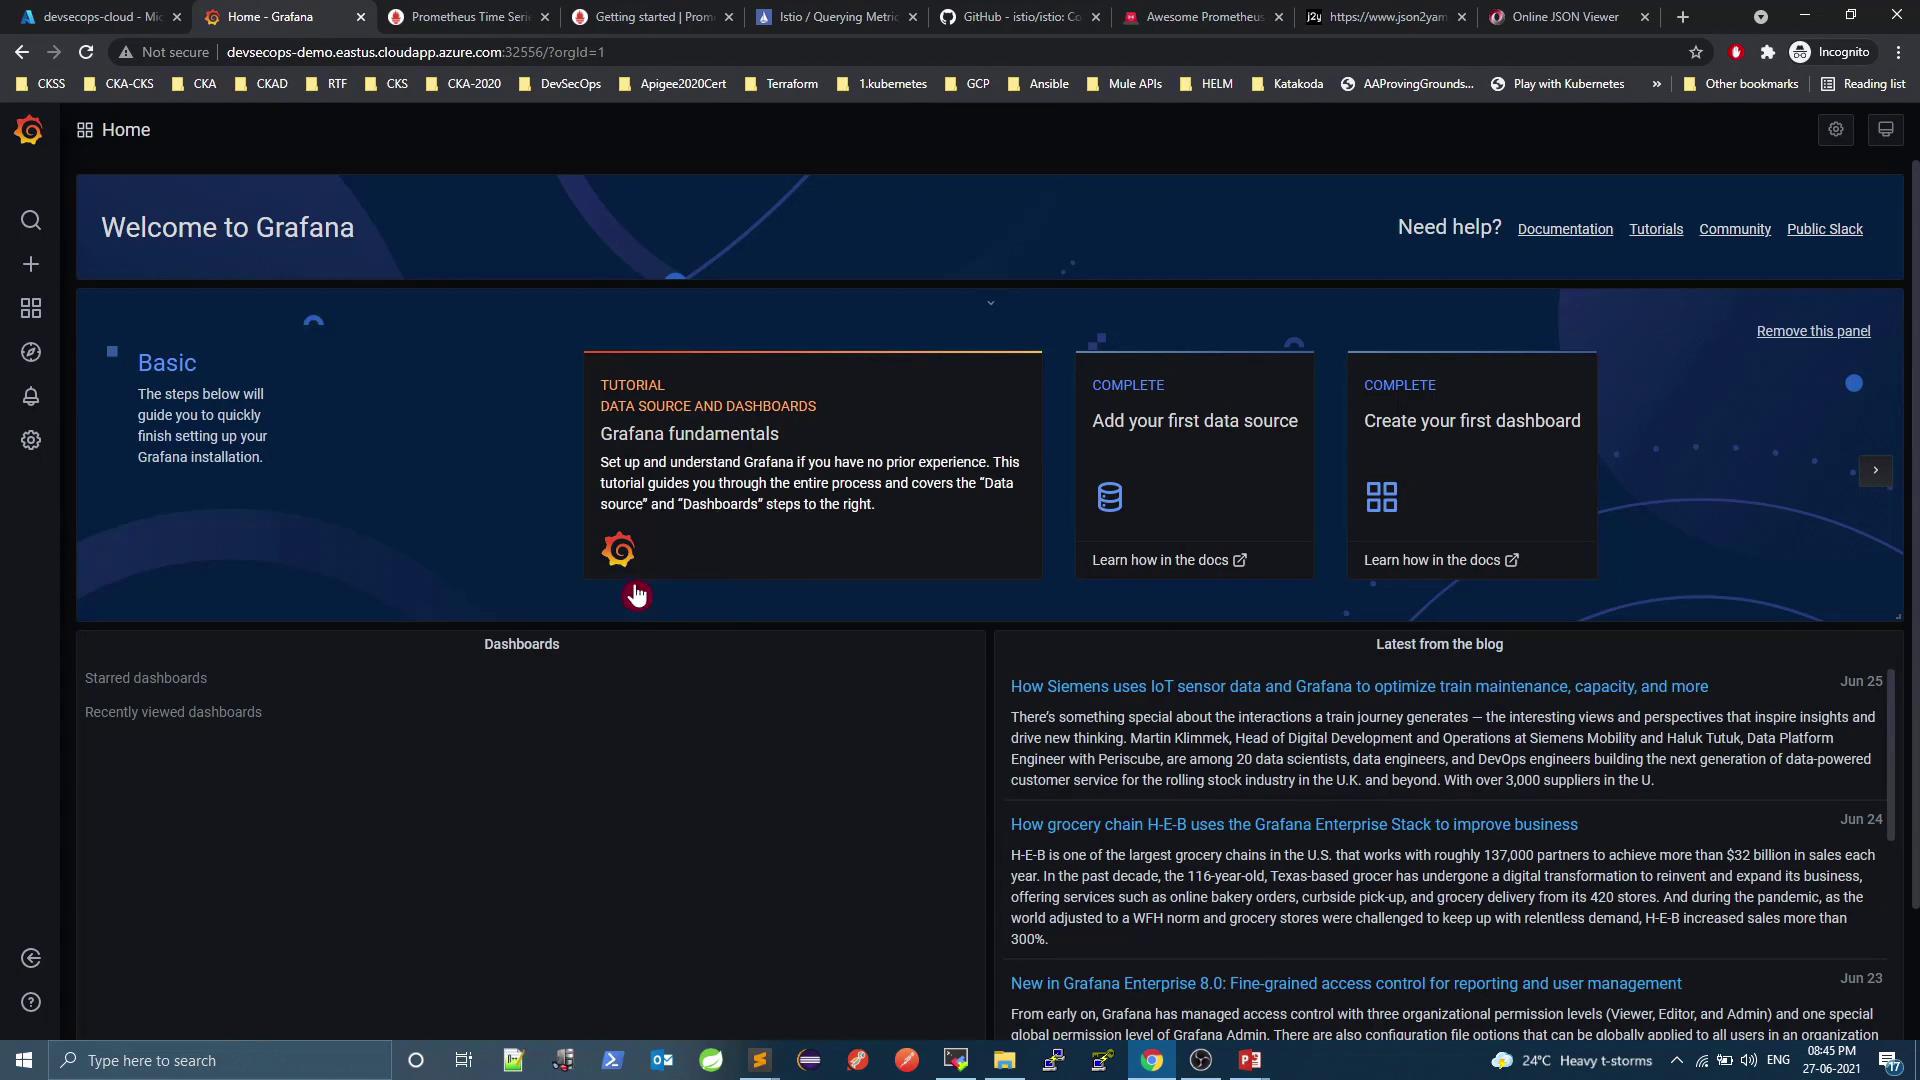
Grafana provides prebuilt dashboards for Istio monitoring. Log in at `http://\<VM_PUBLIC_DNS>:32556`, then configure your data source (Prometheus) and explore:
<Frame>
  ![The image shows a Grafana dashboard interface with sections for tutorials, data source setup, and dashboard creation. It also includes a blog section with recent articles.](https://kodekloud.com/kk-media/image/upload/v1752873773/notes-assets/images/DevSecOps-Kubernetes-DevOps-Security-Demo-Prometheus-Grafana/grafana-dashboard-tutorials-data-sources.jpg)
</Frame>

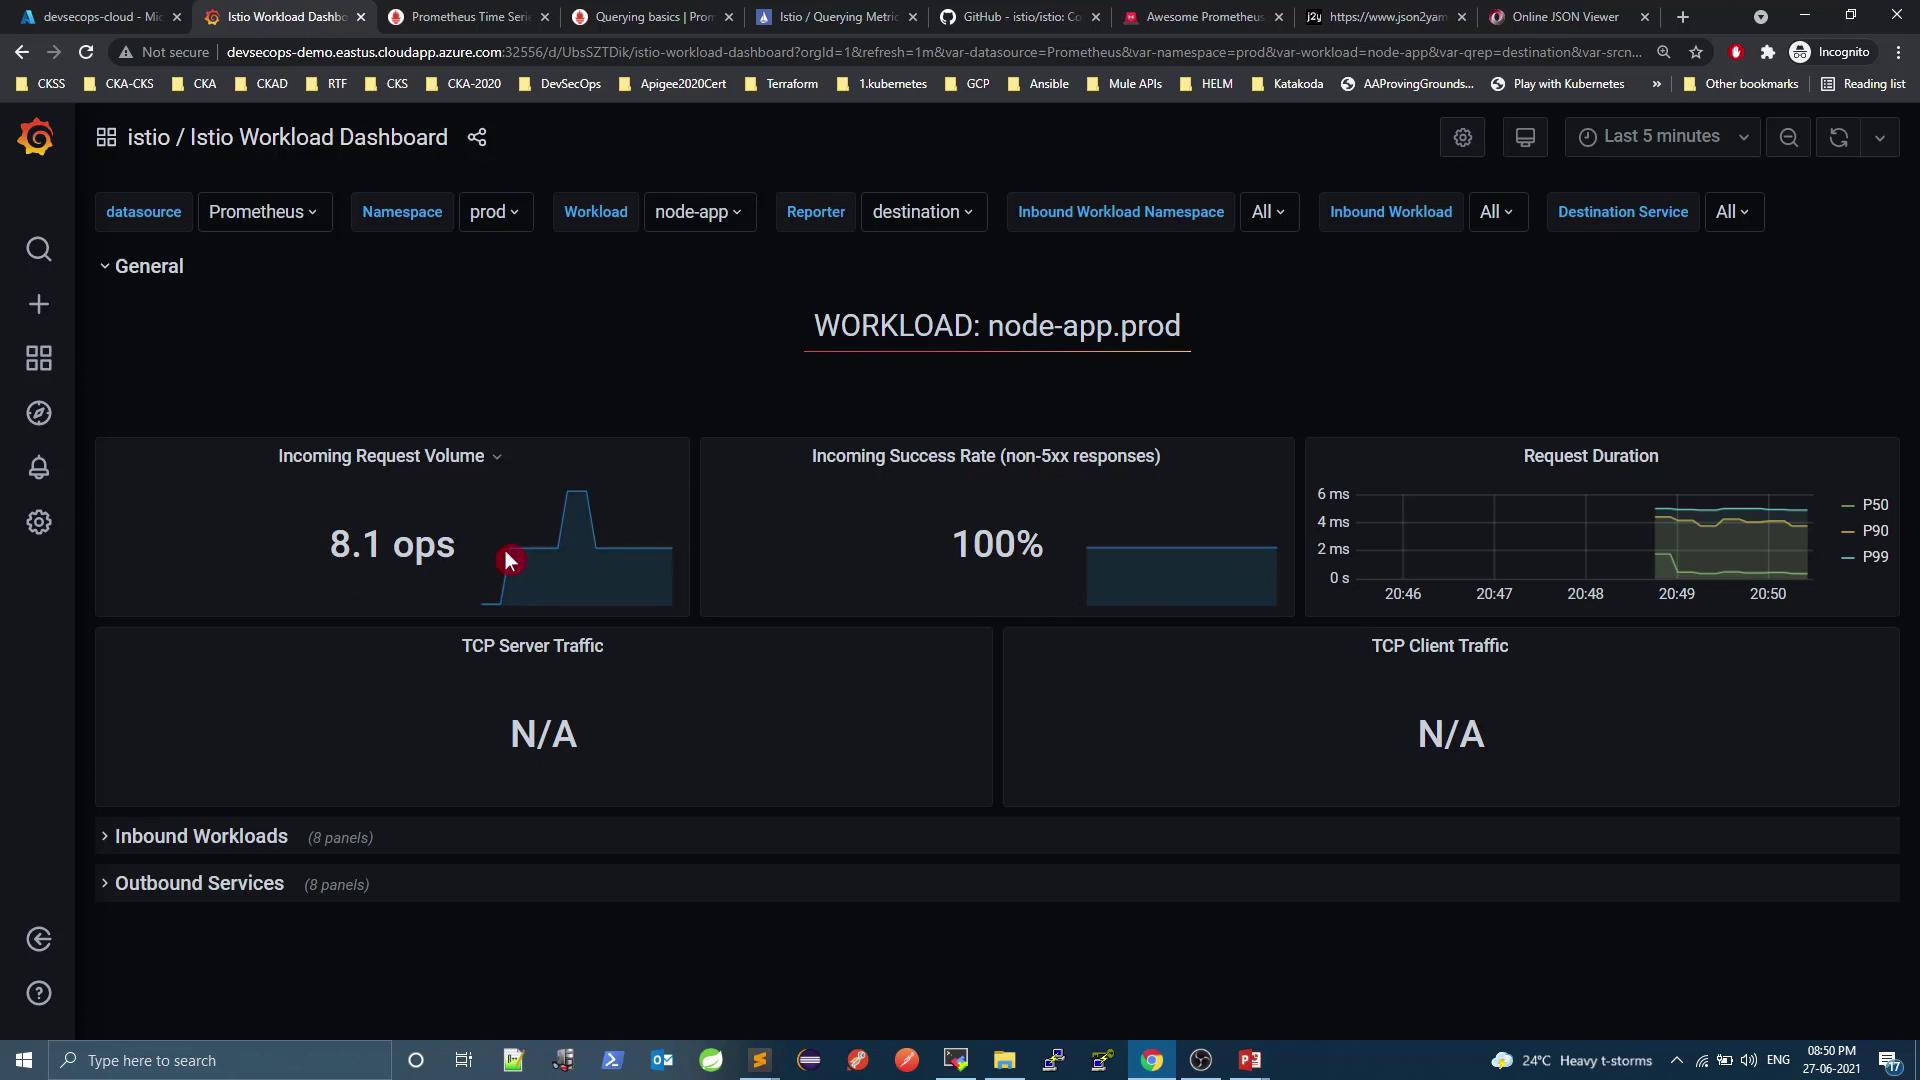
### 3.1 Istio Workload Dashboard

Shows per‐workload metrics (request rate, success rate, latency). Example for `node-app.prod`:
<Frame>
  ![The image shows an Istio Workload Dashboard displaying metrics such as incoming request volume, success rate, and request duration for a workload named "node-app.prod." The dashboard indicates an incoming request volume of 8.1 ops and a 100% success rate.](https://kodekloud.com/kk-media/image/upload/v1752873774/notes-assets/images/DevSecOps-Kubernetes-DevOps-Security-Demo-Prometheus-Grafana/istio-workload-dashboard-node-app-metrics.jpg)
</Frame>

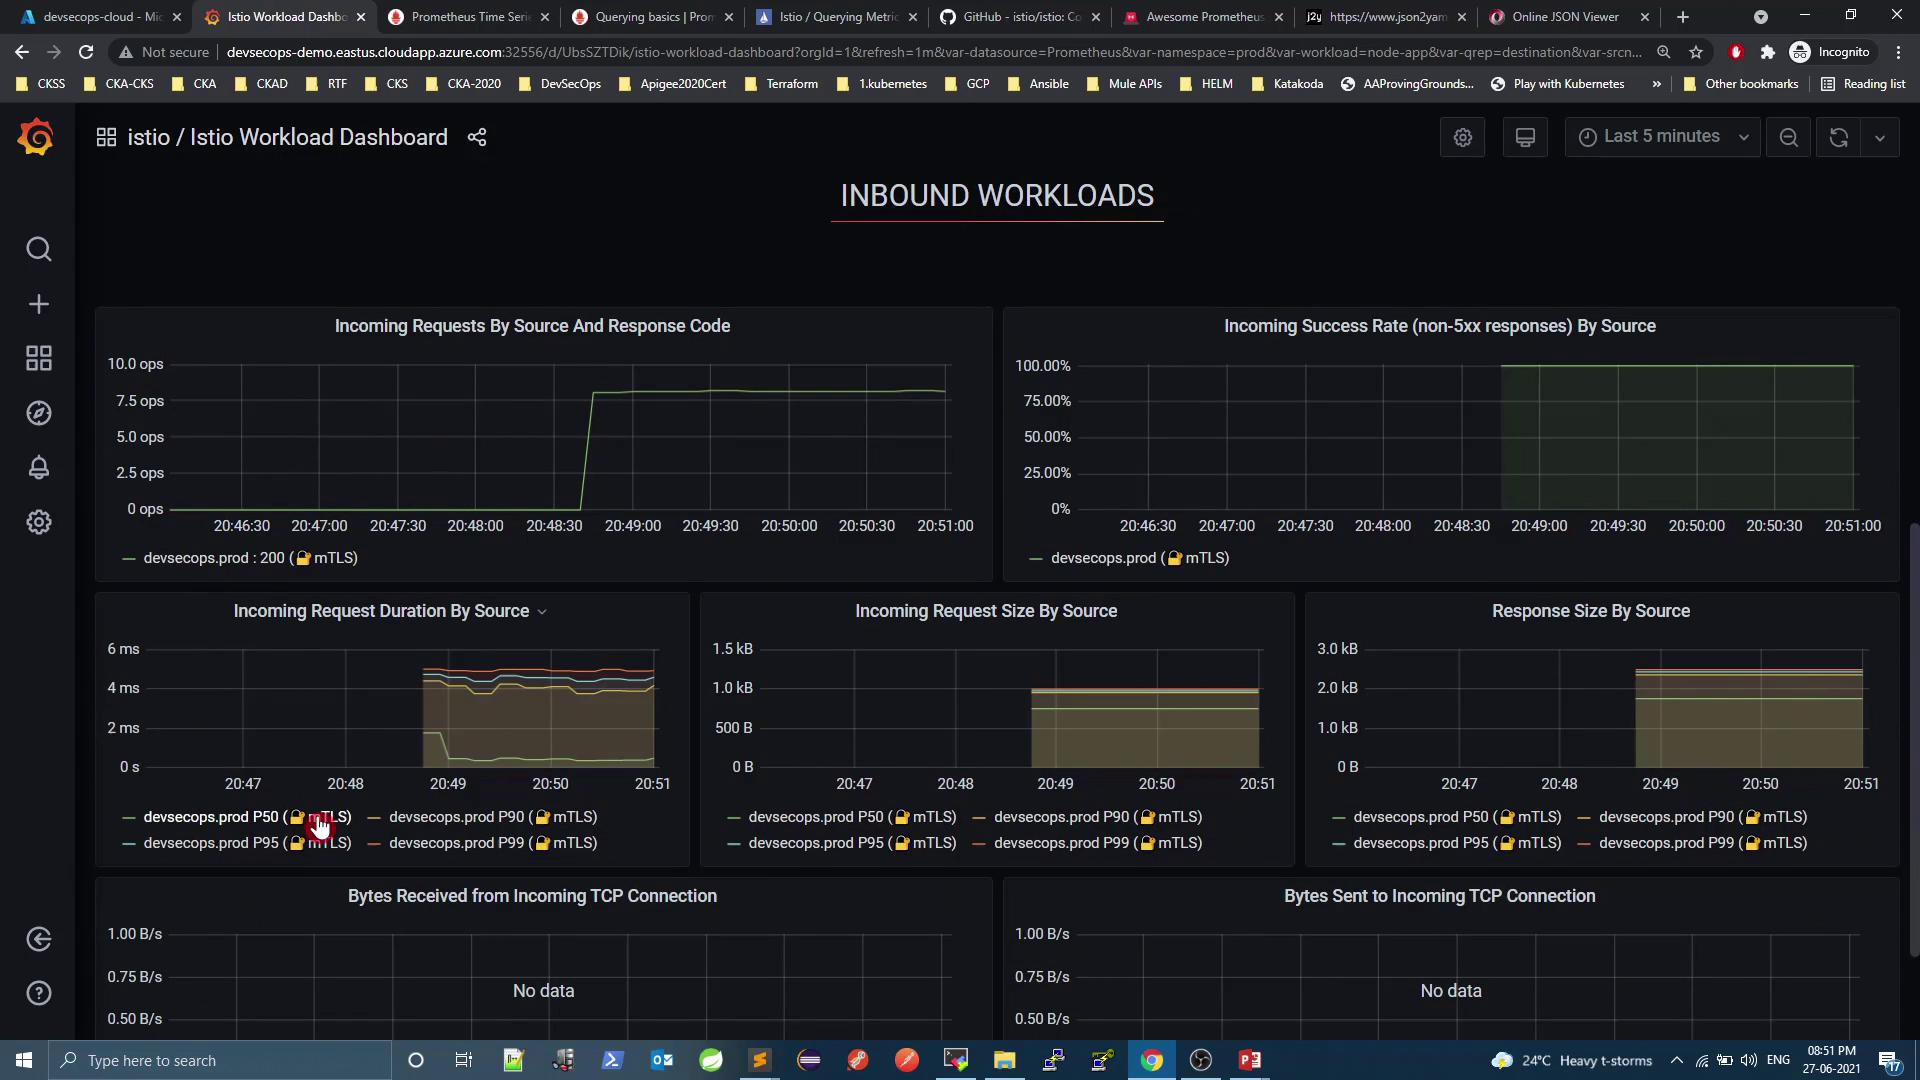
### 3.2 Inbound Workloads

Detailed inbound metrics: request/response sizes, mTLS usage, error rates:
<Frame>
  ![The image shows a dashboard from Grafana displaying various metrics related to inbound workloads, such as incoming requests, success rates, request duration, and data sizes. The graphs provide visual insights into the performance and traffic of a service using Istio.](https://kodekloud.com/kk-media/image/upload/v1752873775/notes-assets/images/DevSecOps-Kubernetes-DevOps-Security-Demo-Prometheus-Grafana/grafana-dashboard-inbound-workloads-metrics.jpg)
</Frame>

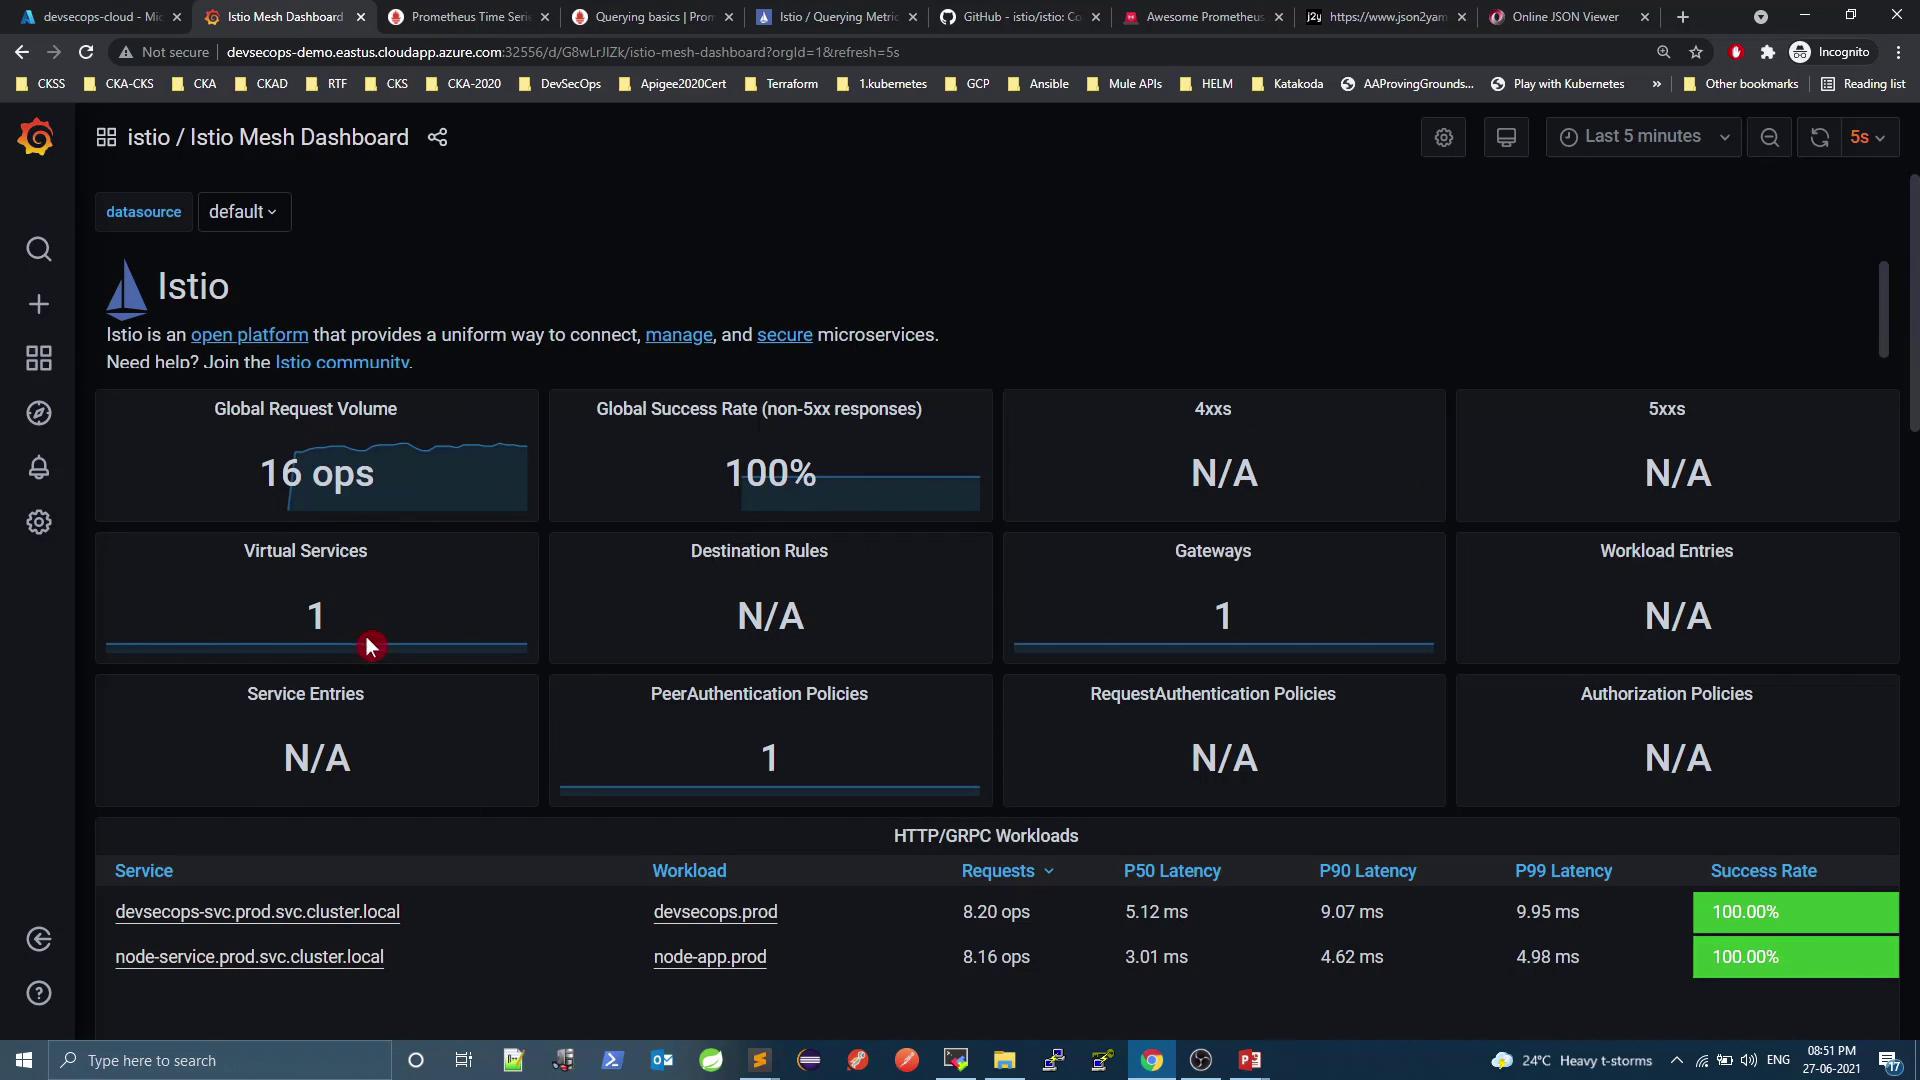
### 3.3 Mesh Dashboard

Get global insights: overall request volume, success rate, virtual services, gateways:
<Frame>
  ![The image shows an Istio Mesh Dashboard displaying metrics such as global request volume, success rate, and details about virtual services and gateways. It includes performance data for specific services, highlighting request rates and latency.](https://kodekloud.com/kk-media/image/upload/v1752873776/notes-assets/images/DevSecOps-Kubernetes-DevOps-Security-Demo-Prometheus-Grafana/istio-mesh-dashboard-metrics-performance.jpg)
</Frame>

***

## 4. Alerting with Grafana

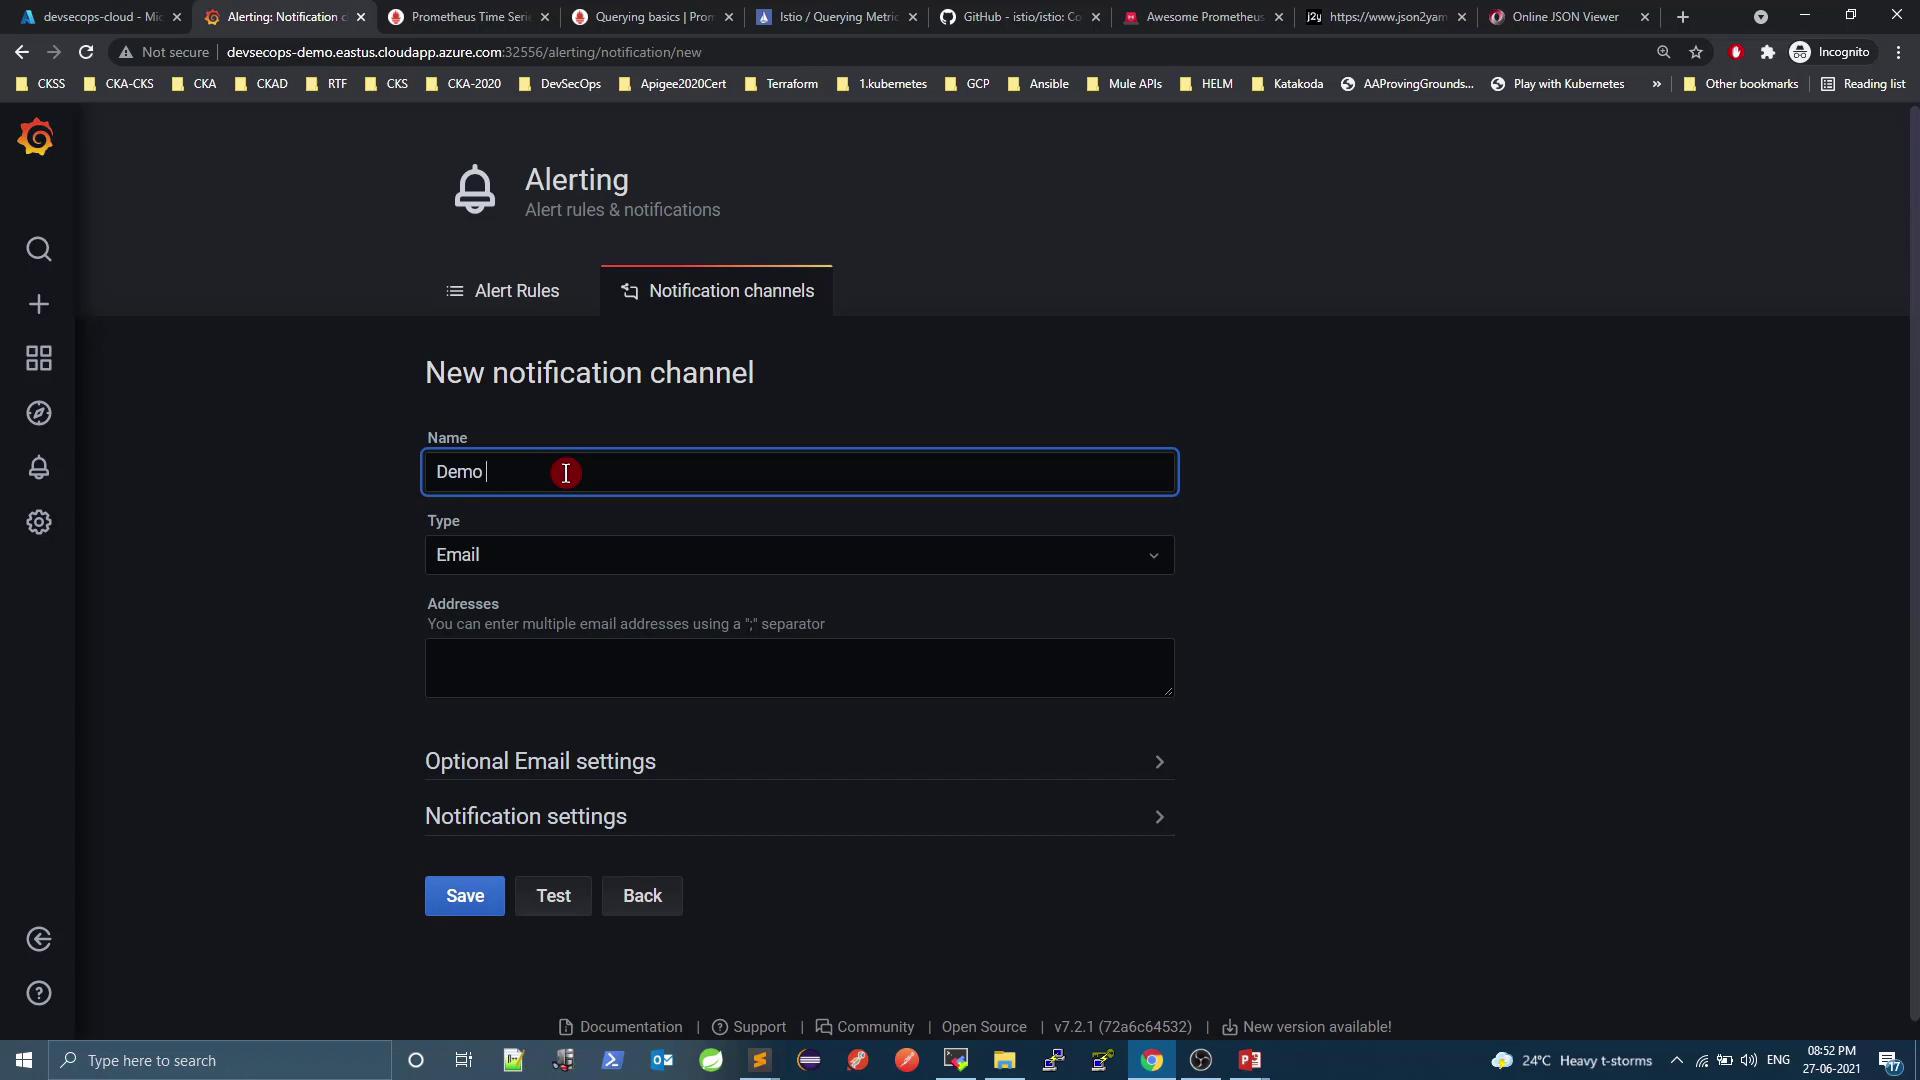
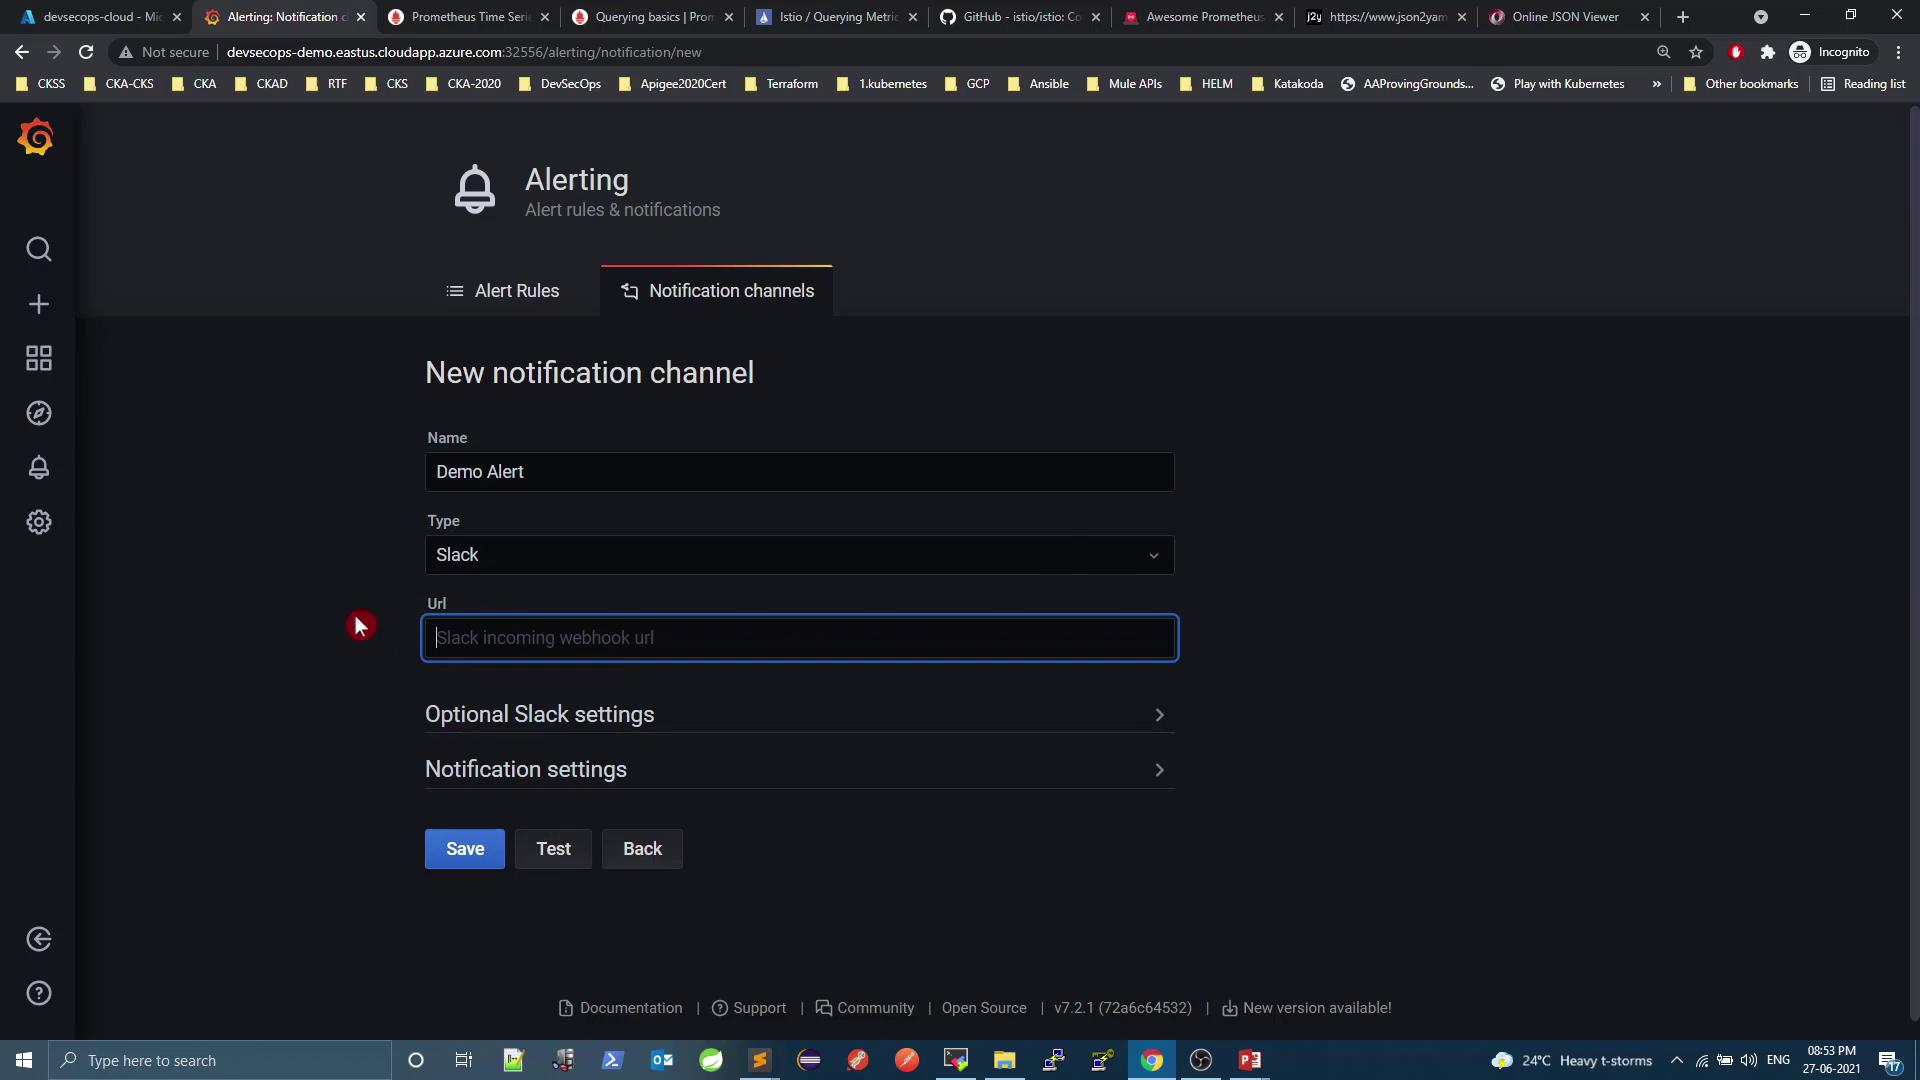
Grafana supports built-in alert rules and notification channels (Slack, email, PagerDuty, etc.). To create a Slack channel:

1. **Notification channel** → **New channel**
<Frame>
  ![The image shows a web interface for creating a new notification channel, with fields for name, type, and addresses. The interface is part of an alerting system, likely related to monitoring or DevOps tools.](https://kodekloud.com/kk-media/image/upload/v1752873777/notes-assets/images/DevSecOps-Kubernetes-DevOps-Security-Demo-Prometheus-Grafana/notification-channel-creation-interface.jpg)
</Frame>

2. Select **Slack** and add your webhook URL.
<Frame>
  ![The image shows a web interface for setting up a new notification channel, specifically for a "Demo Alert" using Slack, with fields for entering a Slack webhook URL and optional settings.](https://kodekloud.com/kk-media/image/upload/v1752873778/notes-assets/images/DevSecOps-Kubernetes-DevOps-Security-Demo-Prometheus-Grafana/slack-notification-channel-setup-demo.jpg)
</Frame>

3. Approve the Grafana app in Slack.

<Frame>
  ![The image shows a Slack authorization page where the Grafana App is requesting permission to access the "devsecops-k8s" Slack workspace, with options to cancel or allow the request.](https://kodekloud.com/kk-media/image/upload/v1752873779/notes-assets/images/DevSecOps-Kubernetes-DevOps-Security-Demo-Prometheus-Grafana/slack-authorization-grafana-app-devsecops.jpg)
</Frame>

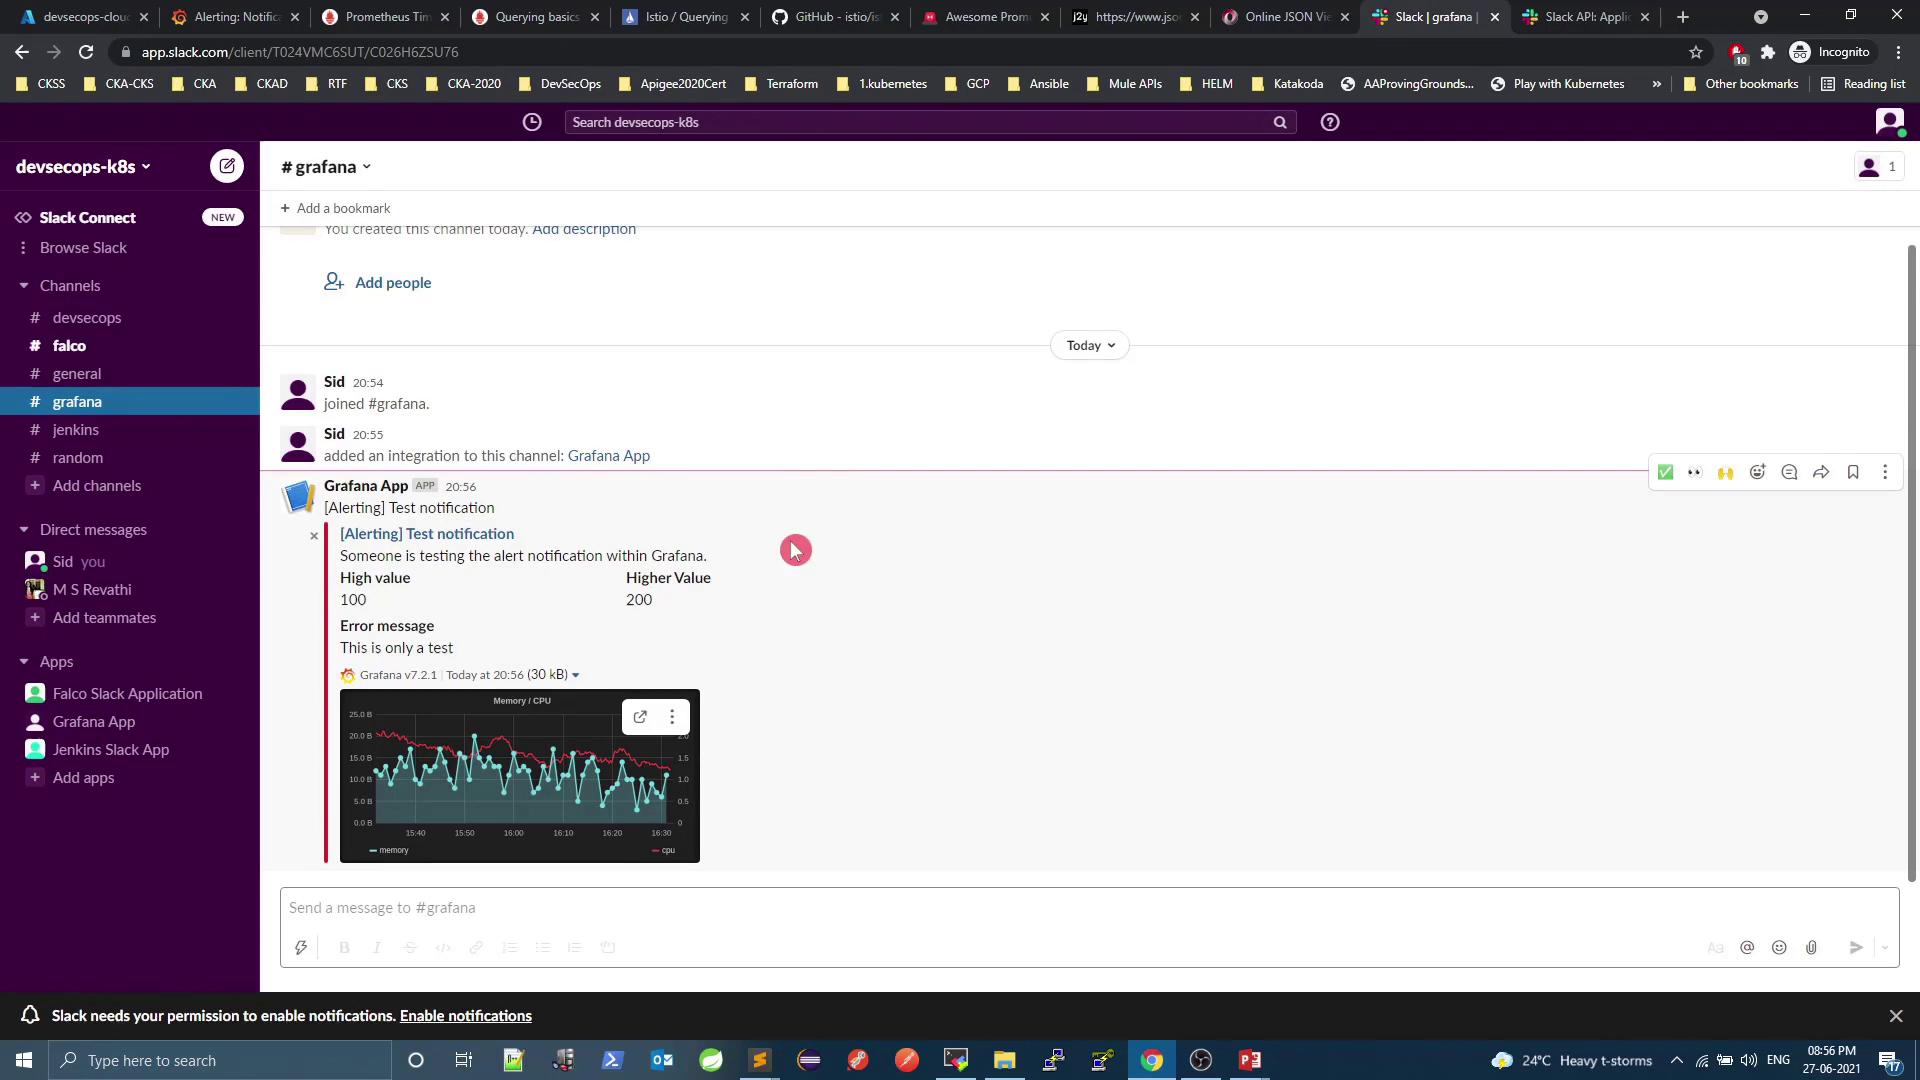
4. Test the channel and watch alerts roll in:
<Frame>
  ![The image shows a Slack channel with a Grafana alert notification, including a graph displaying memory and CPU usage. The notification indicates a test alert with specified high values.](https://kodekloud.com/kk-media/image/upload/v1752873781/notes-assets/images/DevSecOps-Kubernetes-DevOps-Security-Demo-Prometheus-Grafana/slack-grafana-alert-notification-graph.jpg)
</Frame>

***

## 5. Prometheus Alerts & Alertmanager

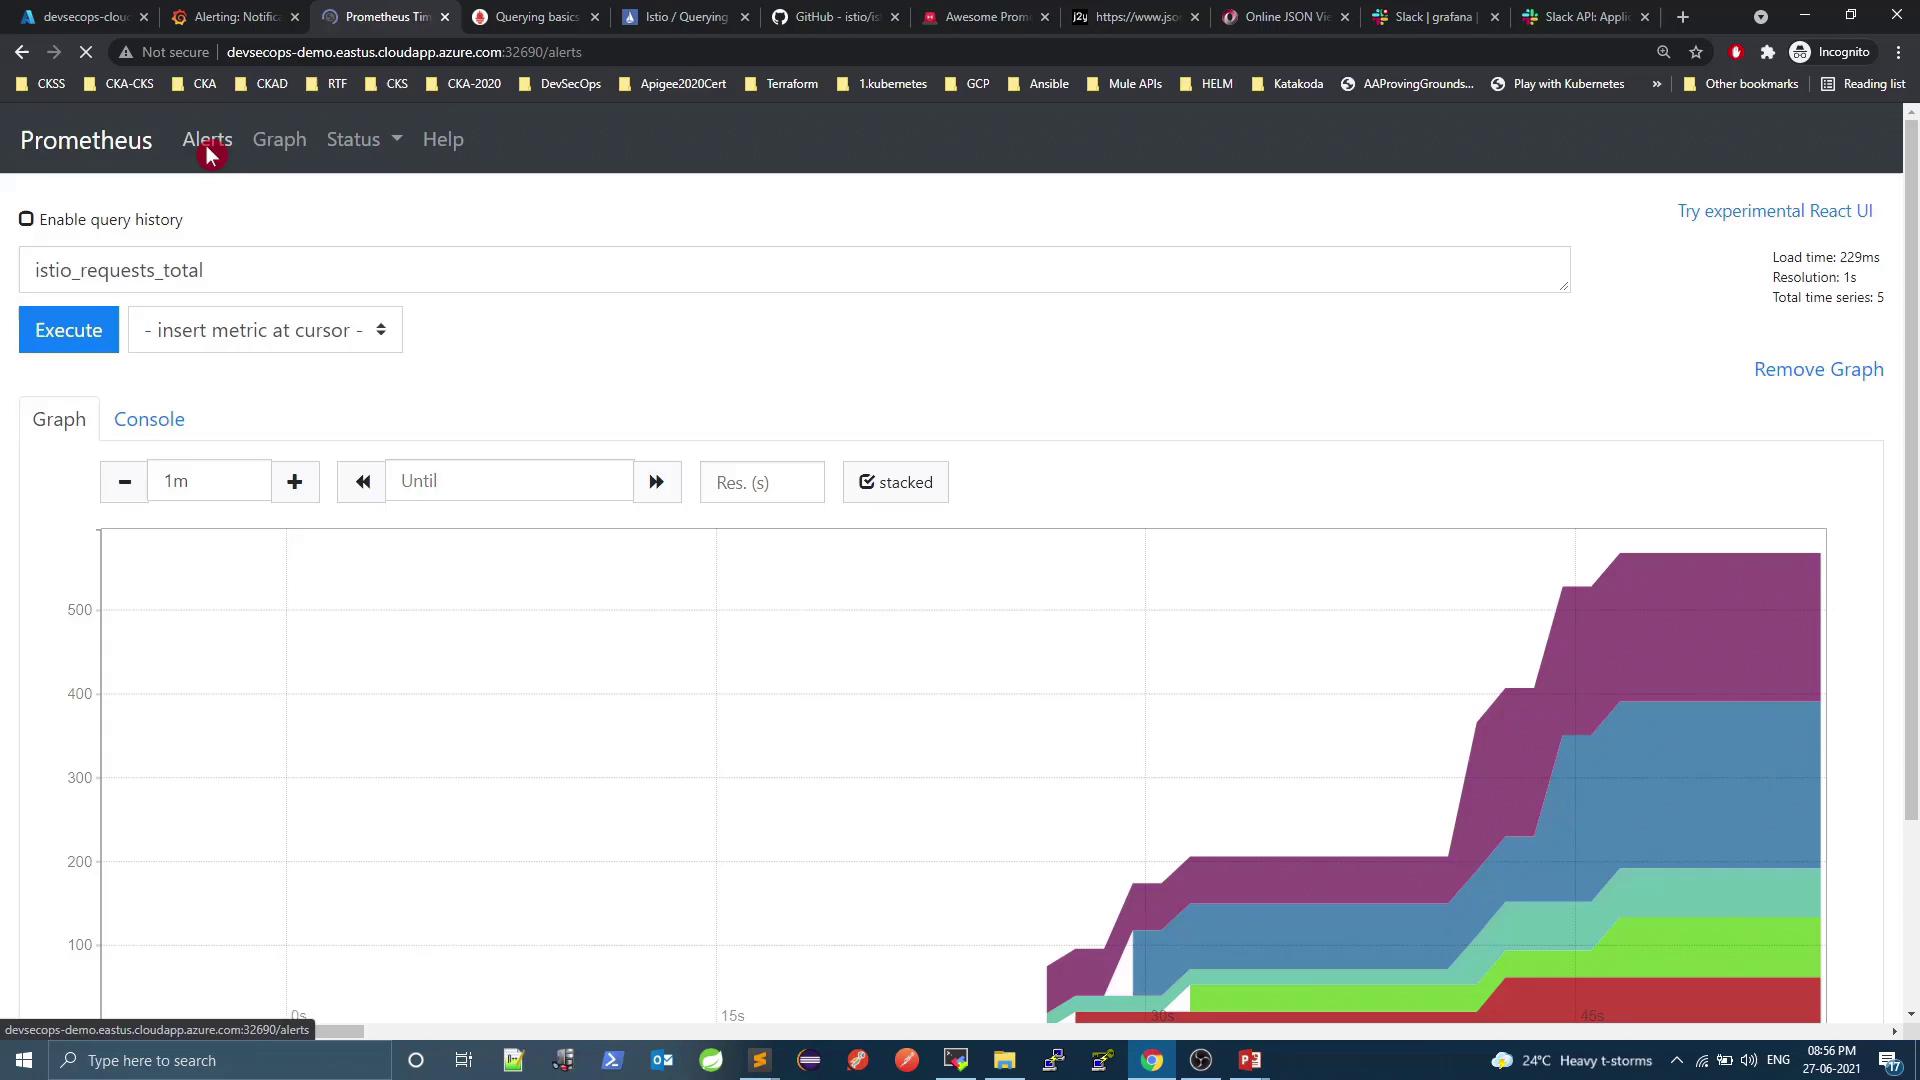
Out of the box, Prometheus doesn’t ship with alert rules. Let’s integrate **Alertmanager** and define rules:

1. **Verify current state**
<Frame>
  ![The image shows a Prometheus dashboard with a stacked area graph displaying the metric "istio\_requests\_total" over time. The graph illustrates the cumulative number of requests with different colored segments representing various components or services.](https://kodekloud.com/kk-media/image/upload/v1752873782/notes-assets/images/DevSecOps-Kubernetes-DevOps-Security-Demo-Prometheus-Grafana/prometheus-dashboard-istio-requests-graph-2.jpg)
</Frame>

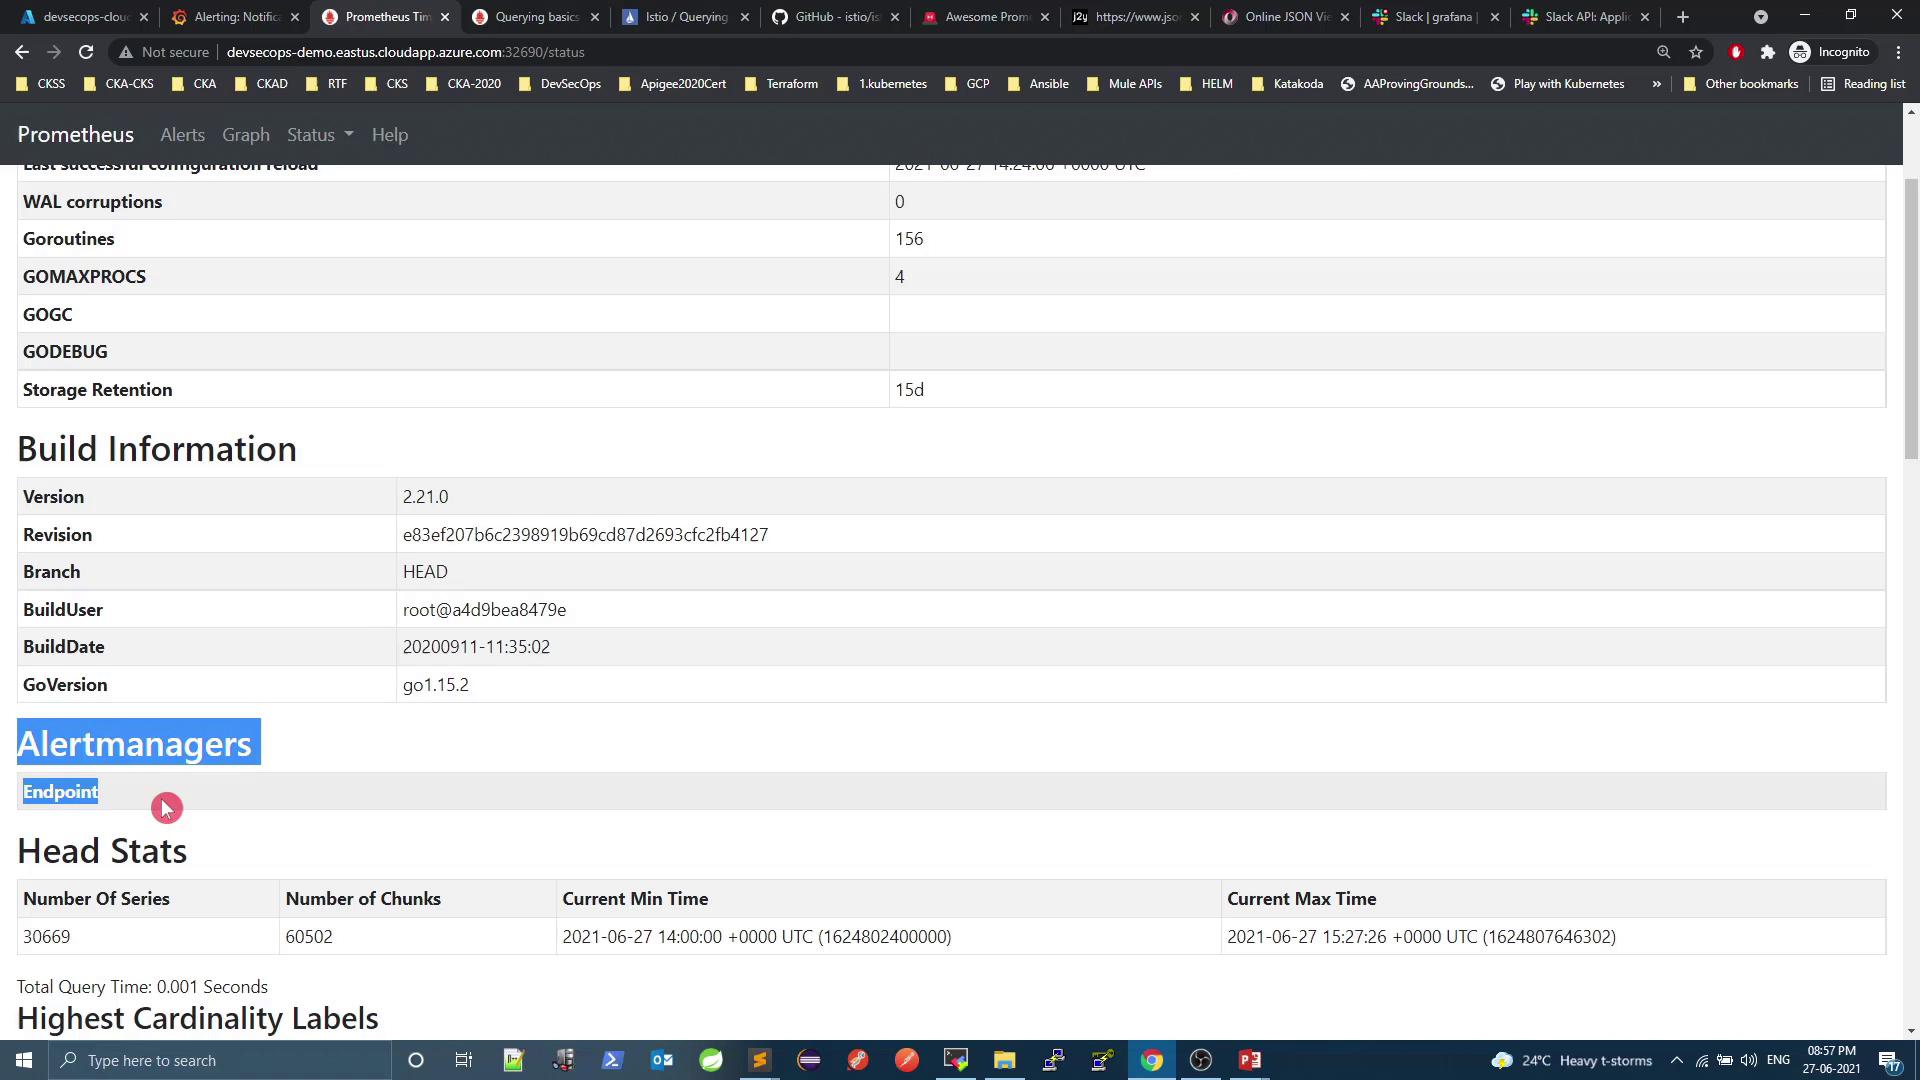
2. **Check Alertmanager integration**
<Frame>
  ![The image shows a Prometheus status page displaying build information, alert manager details, and head stats. It includes version, revision, and build date information.](https://kodekloud.com/kk-media/image/upload/v1752873783/notes-assets/images/DevSecOps-Kubernetes-DevOps-Security-Demo-Prometheus-Grafana/prometheus-status-page-build-info.jpg)
</Frame>

Next, install Alertmanager, create custom alert rules, and configure routing (Slack, email, etc.) in `alertmanager.yml` and your Prometheus `rules` files.

***

## Links & References

* [Kubernetes Services Overview](https://kubernetes.io/docs/concepts/services-networking/service/)
* [Istio Metrics & Telemetry](https://istio.io/latest/docs/ops/integrations/prometheus/)
* [Grafana Alerting](https://grafana.com/docs/grafana/latest/alerting/)
* [Prometheus Alertmanager Guide](https://prometheus.io/docs/alerting/latest/alertmanager/)

<CardGroup>
  <Card title="Watch Video" icon="video" cta="Learn more" href="https://learn.kodekloud.com/user/courses/devsecops-kubernetes-devops-security/module/fc1733bc-1e9c-4e38-ae86-84e6bd9af04d/lesson/a6c076c1-9beb-4fe3-9c5d-14e3cb82cf15" />

  <Card title="Practice Lab" icon="installation" cta="Learn more" href="https://learn.kodekloud.com/user/courses/devsecops-kubernetes-devops-security/module/fc1733bc-1e9c-4e38-ae86-84e6bd9af04d/lesson/ebdada21-fa81-43bf-bac2-b7ba6f3065c4" />
</CardGroup>