> ## Documentation Index
> Fetch the complete documentation index at: https://notes.kodekloud.com/llms.txt
> Use this file to discover all available pages before exploring further.
# Kubernetes Monitoring Basics
> This guide explores essential Kubernetes monitoring concepts, built-in tools, and an advanced stack using Prometheus and Grafana for comprehensive observability.
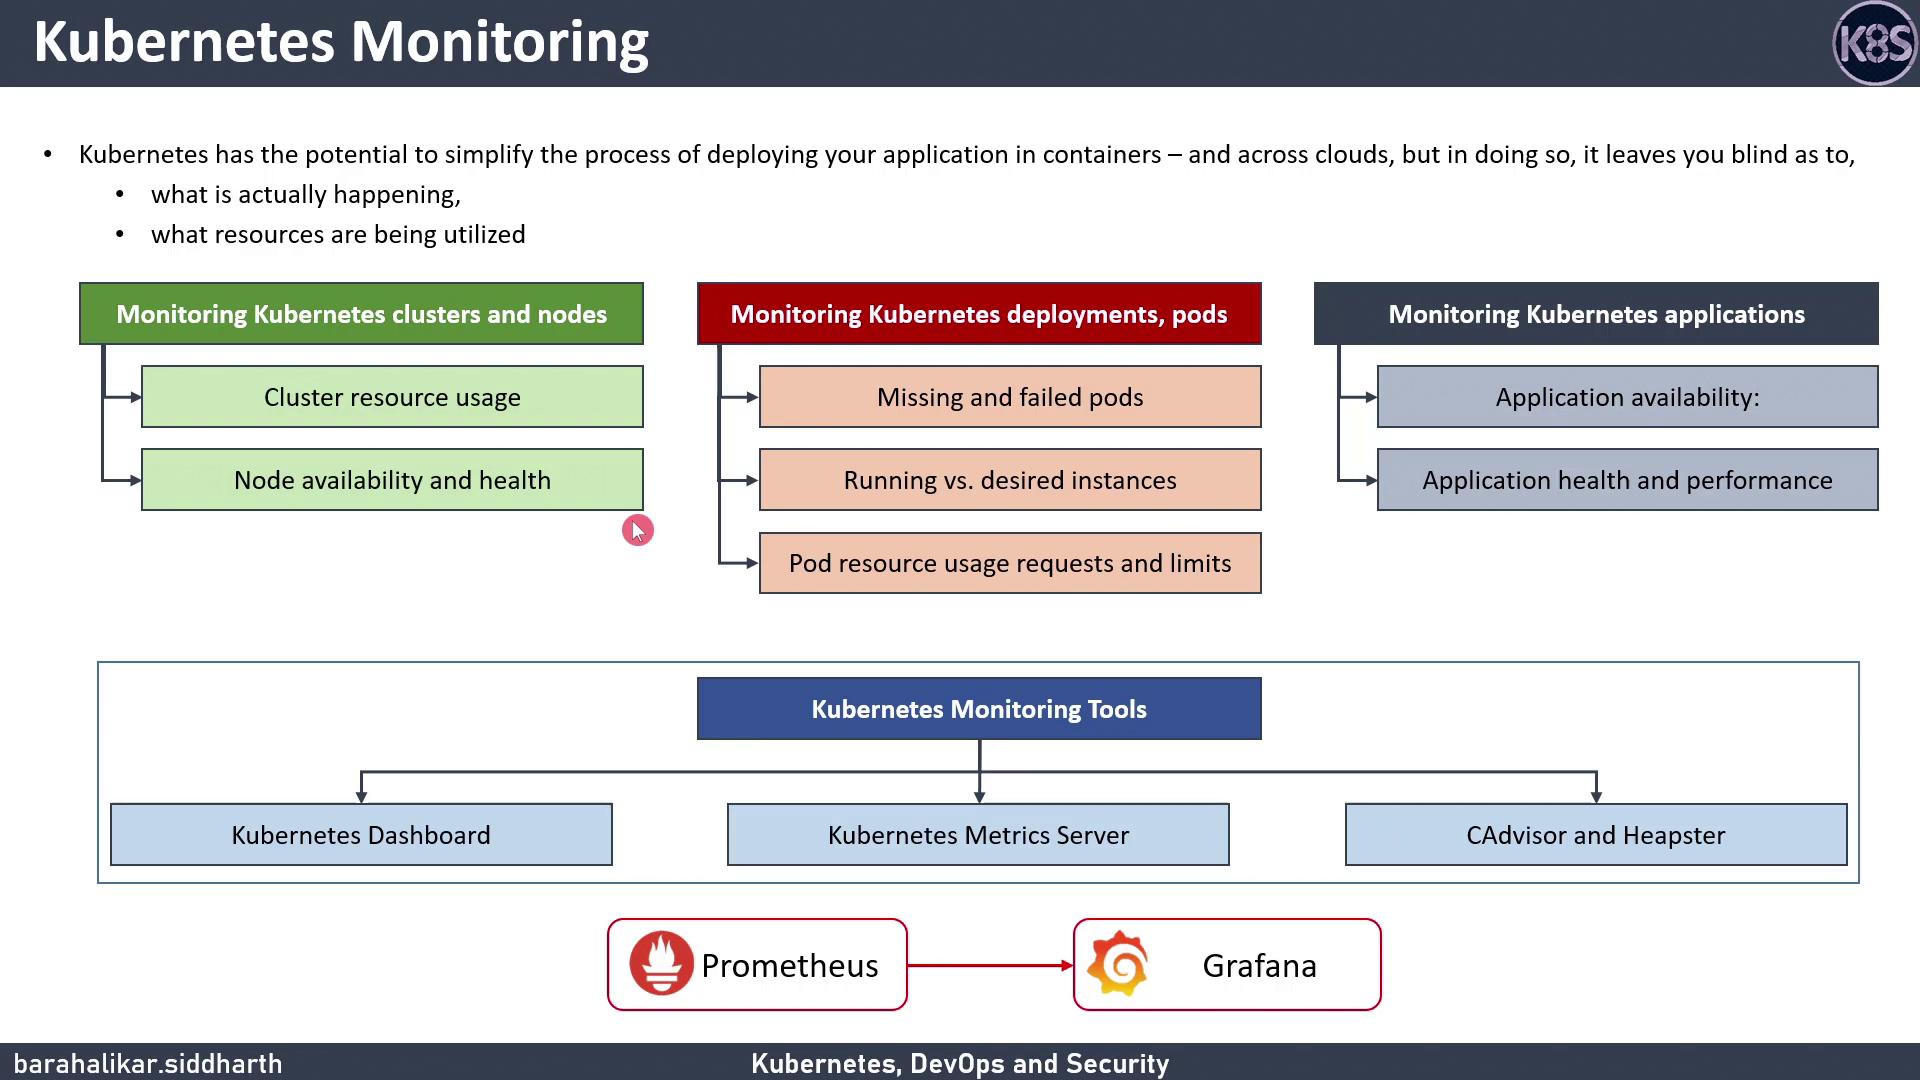
Kubernetes streamlines container orchestration across clouds, but its abstraction can hide critical insights into cluster health and resource usage. In this guide, we’ll explore essential monitoring concepts, built-in tools, and an advanced open-source stack using Prometheus and Grafana.
## Kubernetes Monitoring Overview
To maintain reliability and performance, monitor:
* **Cluster & Node Metrics**: CPU, memory usage, availability, capacity
* **Deployment & Pod Status**: Desired vs. running replicas, CrashLoopBackOff errors
* **Pod Resource Consumption**: Requests and limits for CPU/memory
* **Application-Level Health**: Latency, throughput, error rates
A major challenge is capturing and storing vast quantities of metrics to enable trend analysis and alerting over time.
Without persistent storage, short-lived metrics are lost and you miss critical events that could help diagnose incidents.
## Built-in Monitoring Tools
Kubernetes includes several basic monitoring components:
| Tool | Function | Limitation |
| -------------------- | ---------------------------------------------------- | ----------------------------------------------- |
| cAdvisor | Container resource collector in the kubelet | No long-term storage, trend analysis, or alerts |
| Metrics Server | Aggregates CPU/memory from cAdvisor into Metrics API | No built-in dashboards or advanced queries |
| Kubernetes Dashboard | Web UI for namespaces, workloads, and basic metrics | Real-time only; no historical trend analysis |
For production environments requiring SLA guarantees, these out-of-the-box tools are insufficient. Plan for a full monitoring stack.
Retrieve real-time metrics:
```bash theme={null}
# View node metrics
kubectl top nodes
# View pod metrics in a namespace
kubectl top pods -n
```
## Advanced Open-Source Monitoring with Prometheus and Grafana
For comprehensive observability, combine Prometheus for metrics scraping/storage with Grafana for visualization and alerting.
Follow these steps to deploy:
1. Add and update Helm repos:
```bash theme={null}
helm repo add prometheus-community https://prometheus-community.github.io/helm-charts
helm repo update
```
2. Install Prometheus:
```bash theme={null}
helm install prometheus prometheus-community/prometheus \
--namespace monitoring --create-namespace
```
3. Install Grafana:
```bash theme={null}
helm install grafana prometheus-community/kube-grafana \
--namespace monitoring
```
4. Forward ports to access UIs:
```bash theme={null}
# Grafana UI
kubectl port-forward svc/grafana 3000:80 -n monitoring
# Prometheus UI
kubectl port-forward svc/prometheus-server 9090:80 -n monitoring
```
After first login to Grafana (default credentials `admin/admin`), immediately update the password and configure your data source.
With Prometheus scraping Kubernetes endpoints and Grafana connected:
* Persist historical metrics for capacity planning
* Build custom dashboards to visualize CPU, memory, and application metrics
* Configure alerts in Prometheus Alertmanager to detect anomalies
Thank you for reading this lesson!
## Links and References
* [Kubernetes Documentation](https://kubernetes.io/docs/)
* [Prometheus Helm Charts](https://github.com/prometheus-community/helm-charts)
* [Grafana Documentation](https://grafana.com/docs/)
* [Docker Hub](https://hub.docker.com/)