> ## Documentation Index
> Fetch the complete documentation index at: https://notes.kodekloud.com/llms.txt
> Use this file to discover all available pages before exploring further.
# Building our first dashboard using Kibana
> This article provides a step-by-step guide to creating a dashboard in Kibana using log data from a CSV file.
Welcome to this comprehensive guide on creating your first Kibana dashboard. In this tutorial, we will walk you through uploading log data from a CSV file, visualizing it with Kibana's Lens feature, and leveraging KQL for deeper insights, all with step-by-step instructions and clear diagrams.
***
## Uploading the CSV File
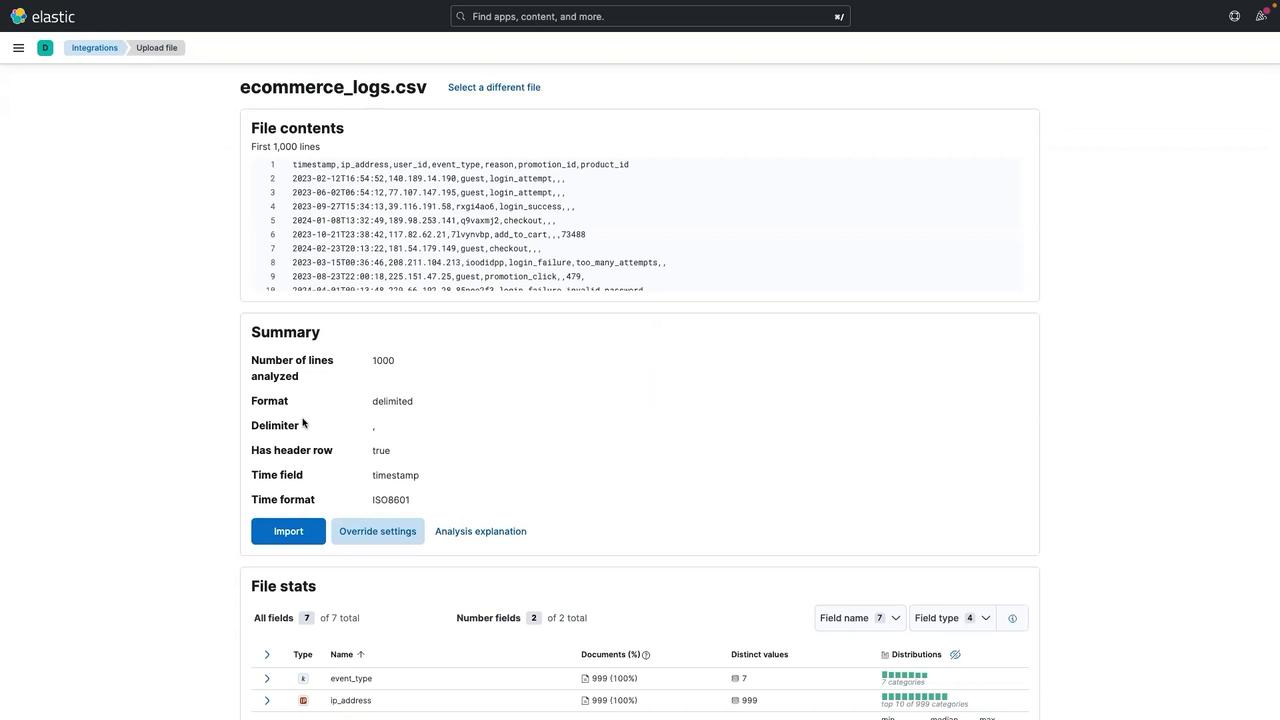
Begin by opening the Kibana UI and selecting the "Upload a file" option. Drag and drop a CSV file containing log data from an Ecommerce Application. Kibana automatically analyzes the CSV file and displays key metadata including the number of lines analyzed, the delimiter, and header information.
Kibana also presents a snapshot of the file statistics, helping you understand which fields will be available for your dashboard. For example:
Next, scroll up and click on **Import**. Assign an index name—use "Ecommerce Application" for this example. After clicking **Import**, Kibana processes the file by creating an index and ingesting the data into Elasticsearch.
Upon successful data upload, a confirmation view is displayed:
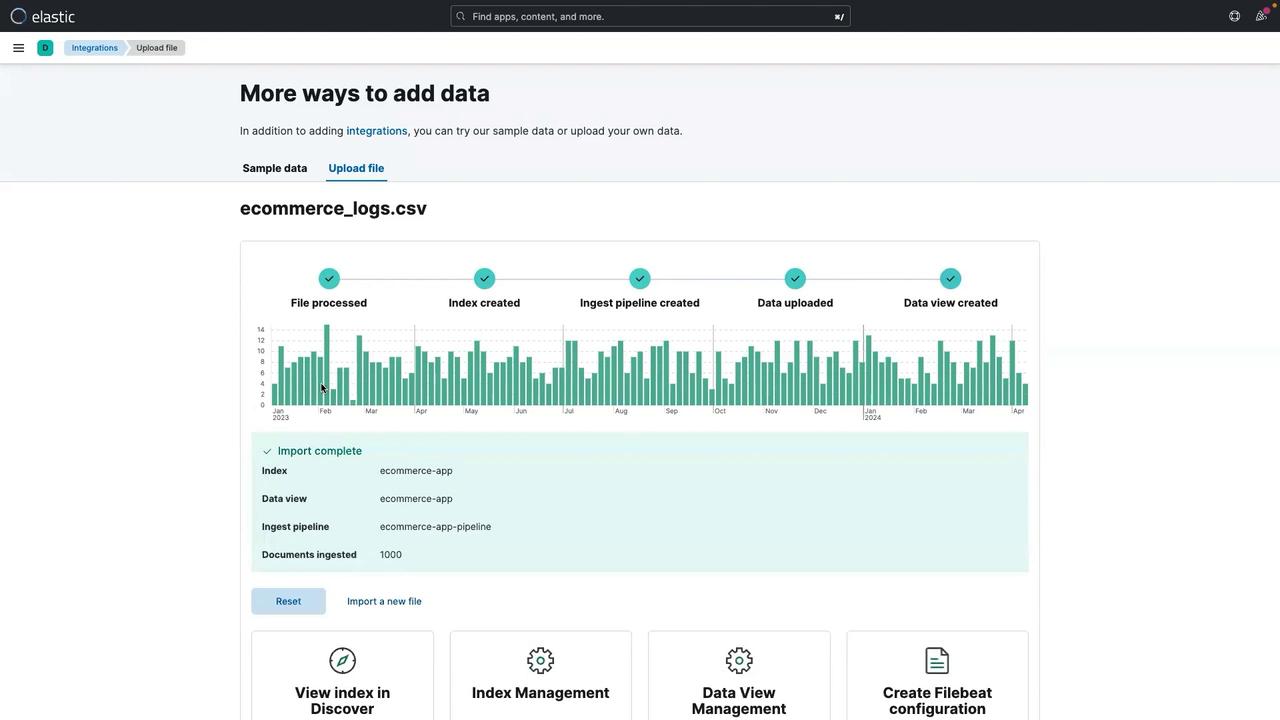
Click **View index in Discovery** to review the uploaded data. You will see details such as a defined time frame (e.g., Jan 1, 2023 to April 25, 2024) and various fields like timestamp, event type, IP address, product ID, promotion ID, reason, and user ID.
***
## Creating the First Visualization
To start building your dashboard, follow these steps:
1. Click the three-line menu.
2. Select **Dashboard**.
3. Click on **Create a dashboard**.
4. Choose **Create Visualization** to open the Lens UI.
On the left side of the Lens UI, all available fields from the selected index are listed. If multiple indices are in use, ensure you select the correct one from the drop-down menu.
### Visualizing "Reason" Data
1. Select the **reason** field and drag it to the center.
2. Kibana Lens will suggest a bar chart that displays the count of records for each value in the "reason" field for the selected date range.
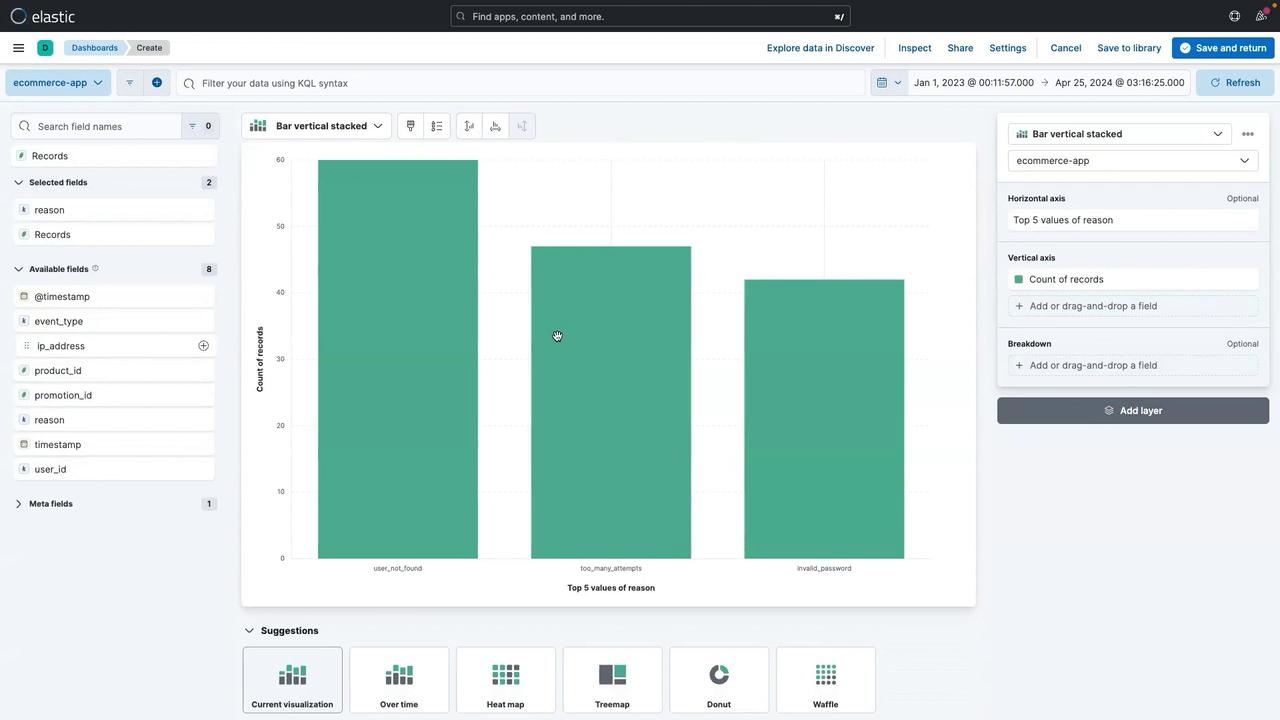
This chart highlights issues like failed logins caused by missing user IDs, providing valuable insights into your application's performance. To incorporate this chart into the dashboard:
* Click **Save and return**.
* Enter a title (e.g., "Count of Reason Type").
* Click **Apply**.
* Save the dashboard (e.g., "eCommerce App Dashboard").
You can also adjust the chart panel's size by resizing it. Optionally, add a text panel by selecting **Add panel** > **Text** to include notes such as "Centralized dashboard for our ecommerce app information." Click **Update** and **Save** to confirm.
***
## Adding an Image to the Dashboard
Personalize your dashboard by adding an image, such as a team logo:
1. Click **Add panel**, then select **Image**.
2. Drag and drop your local image file into the panel.
3. Once the image is displayed, click **Save** and adjust its size if necessary.
Return to Lens by clicking **Add panel** and choosing **Lens** to continue creating additional visualizations.
***
## Visualizing Event Types Over Time
Analyze the event types captured from your ecommerce application to gain insights on user activity. For example, events such as "login\_attempt" and "product\_view" can help track user behavior.
1. Drag the **event type** field to the center.
2. Click on the **Overtime** option to visualize event types over various dates.
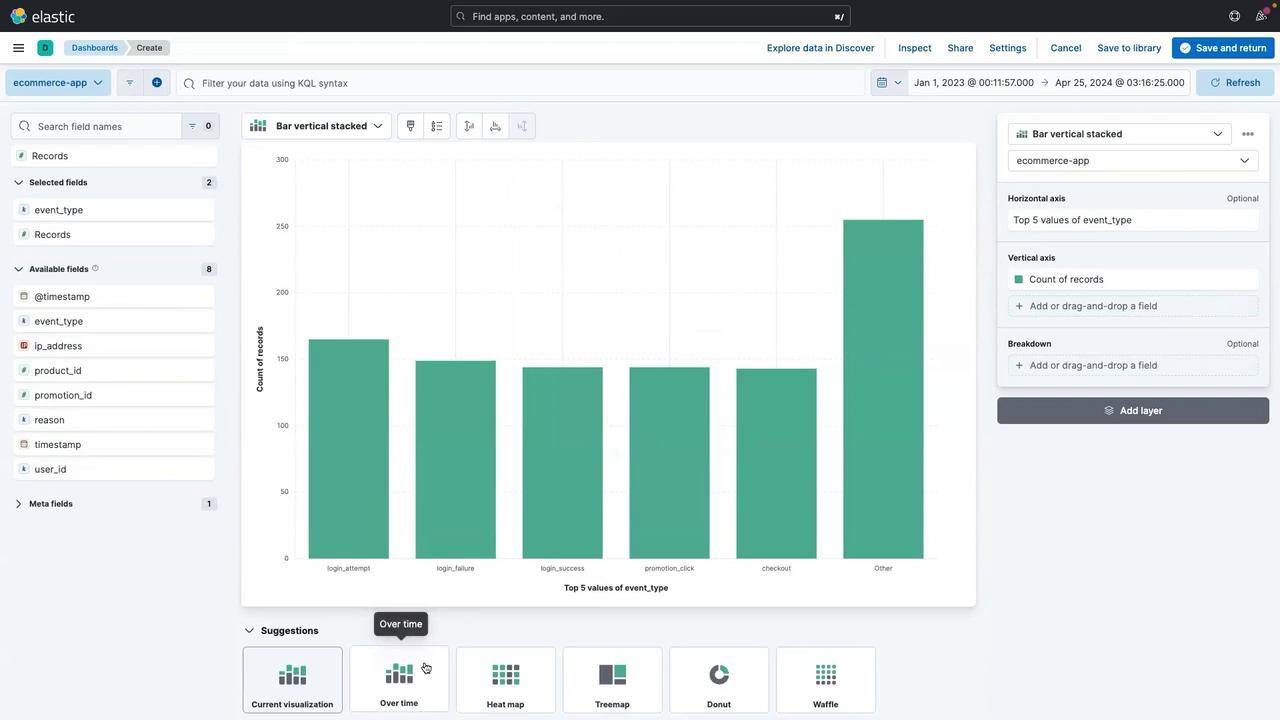
This visualization might reveal, for instance, that on a specific date (e.g., 27/11/2023) there were multiple login attempts, login failures, and other events. To add this chart:
* Click **Save and return**.
* Provide a title (e.g., "Event Type").
* Click **Apply** to update the dashboard.
***
## Visualizing User ID Distribution
Gain insights into user engagement by creating a visualization for the **user ID** field:
1. Select the **user ID** field.
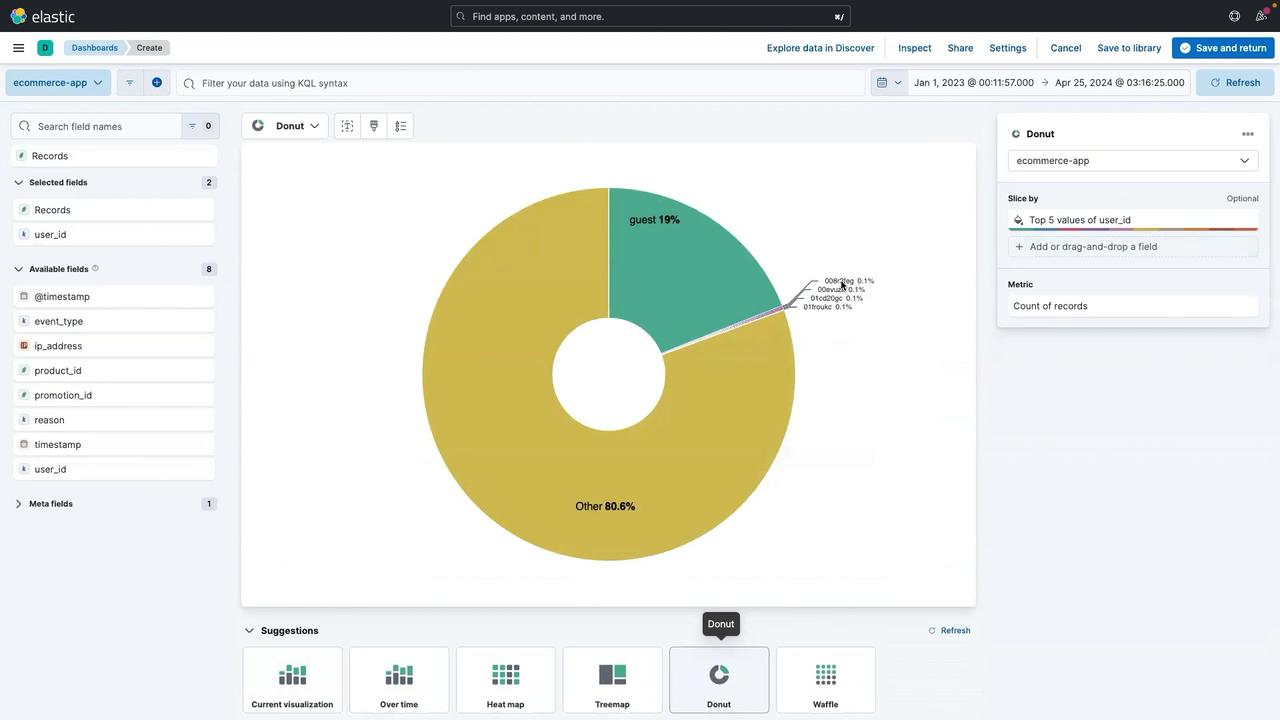
2. Drag it to the center and choose a donut or pie chart as the visualization style.
This chart can illustrate user distribution, such as showing that 19% of users are guests, with the remaining representing logged-in users or specific IDs. If required, click on a segment (e.g., the guest slice) and adjust to display more values (for example, increase from the top five to 500 values).
After verifying the data display:
* Click **Save and return**.
* Enter a title (e.g., "User ID Distribution").
* Click **Apply**.
* Reposition the panel as needed (then click **Save** to finalize the dashboard).
***
## Filtering and Drilling Down with KQL
Focus on specific events, such as login failures, using Kibana Query Language (KQL):
1. Navigate to the **Discover** section by clicking the three-line menu and selecting **Discover**.
2. If prompted, click **Discard changes**.
3. In the search bar, enter the following KQL syntax:
```kql theme={null}
event_type: "login_failure"
```
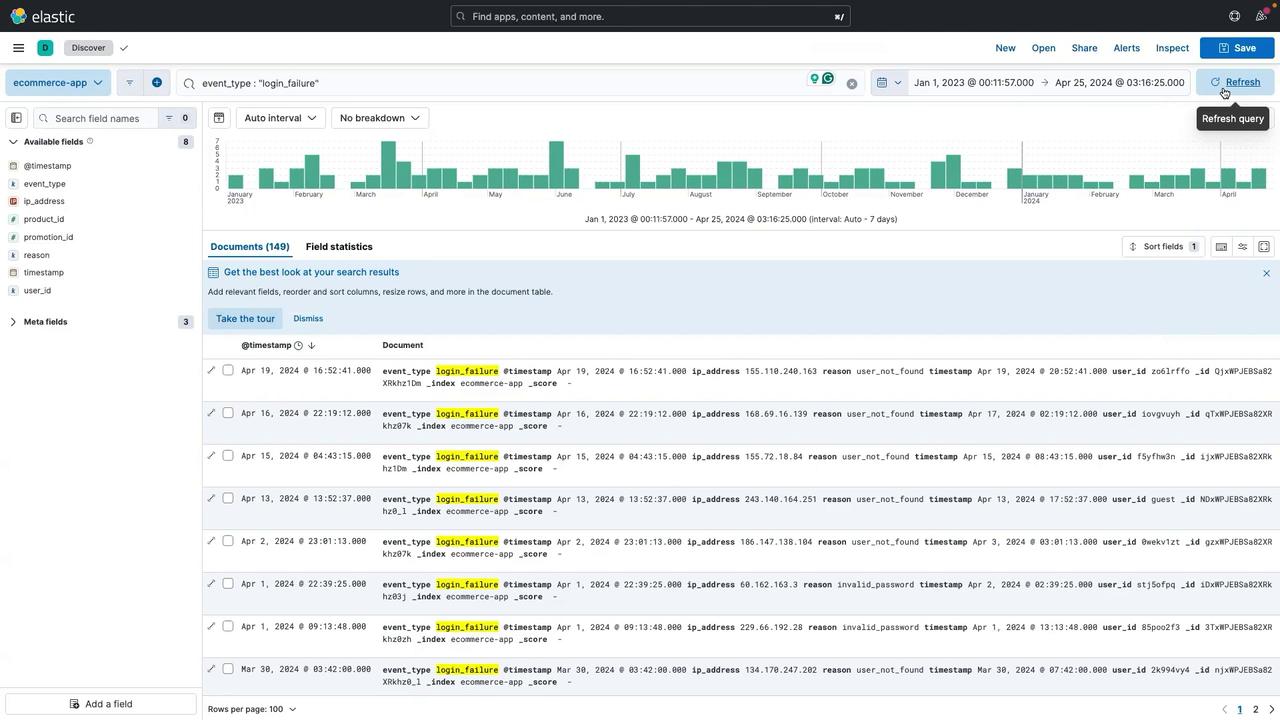
4. Click **Update** to filter the logs, displaying only entries that match the search criteria.
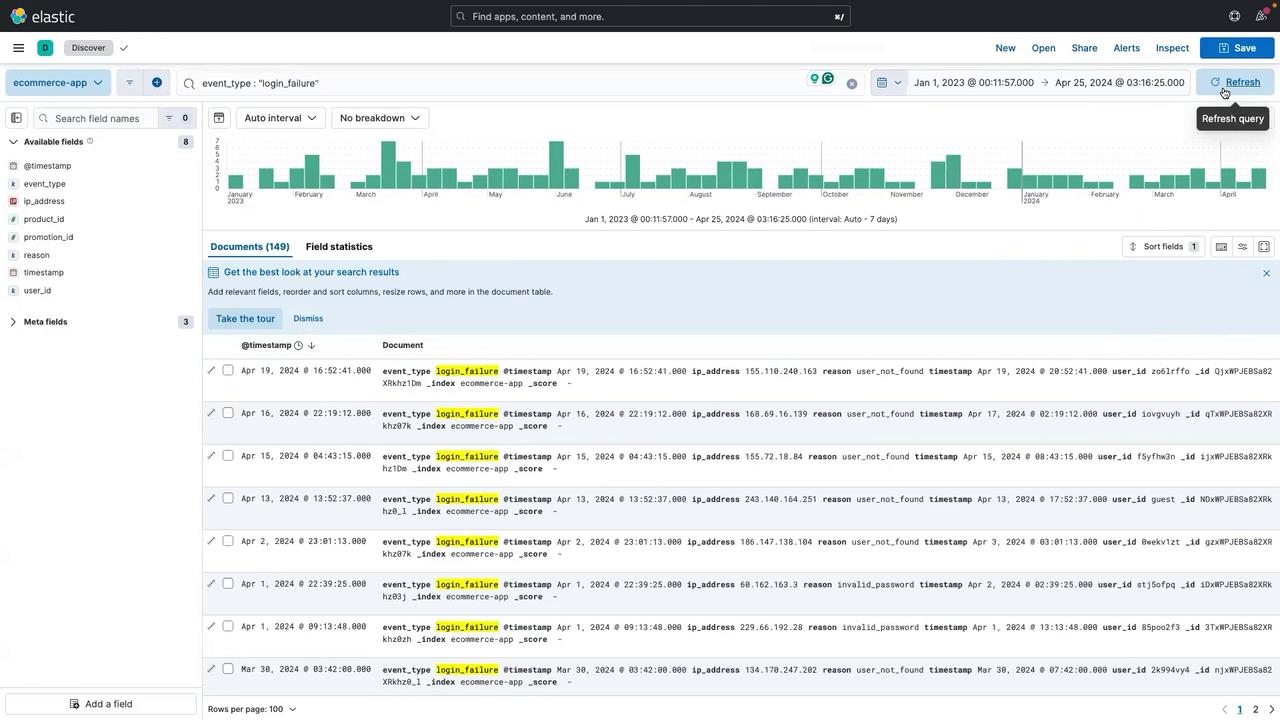
After verifying the filtered logs, switch back to the visualization view by clicking the Lens icon. Select **Count overall** to create a chart representing the total number of login failure records. The KQL syntax remains visible at the top of the screen for reference.
* Click **Save**.
* Provide a chart name (e.g., "Count of Login Failures").
* Choose your existing dashboard.
* Click **Save and go to dashboard**.
***
## Interacting with the Dashboard
Your fully interactive dashboard now includes multiple panels featuring visualizations and images, each representing different aspects of your ecommerce application's logs. For example, clicking on a chart segment such as "invalid password" triggers a drilldown, filtering the entire dashboard to focus on that specific event.
To adjust your view:
* Remove any applied filters by clicking the clear (cross) button.
* Refresh the dashboard to restore the normal view.
* Modify the date range by selecting new start and end dates (e.g., displaying logs from April 1, 2023 to April 25, 2024).
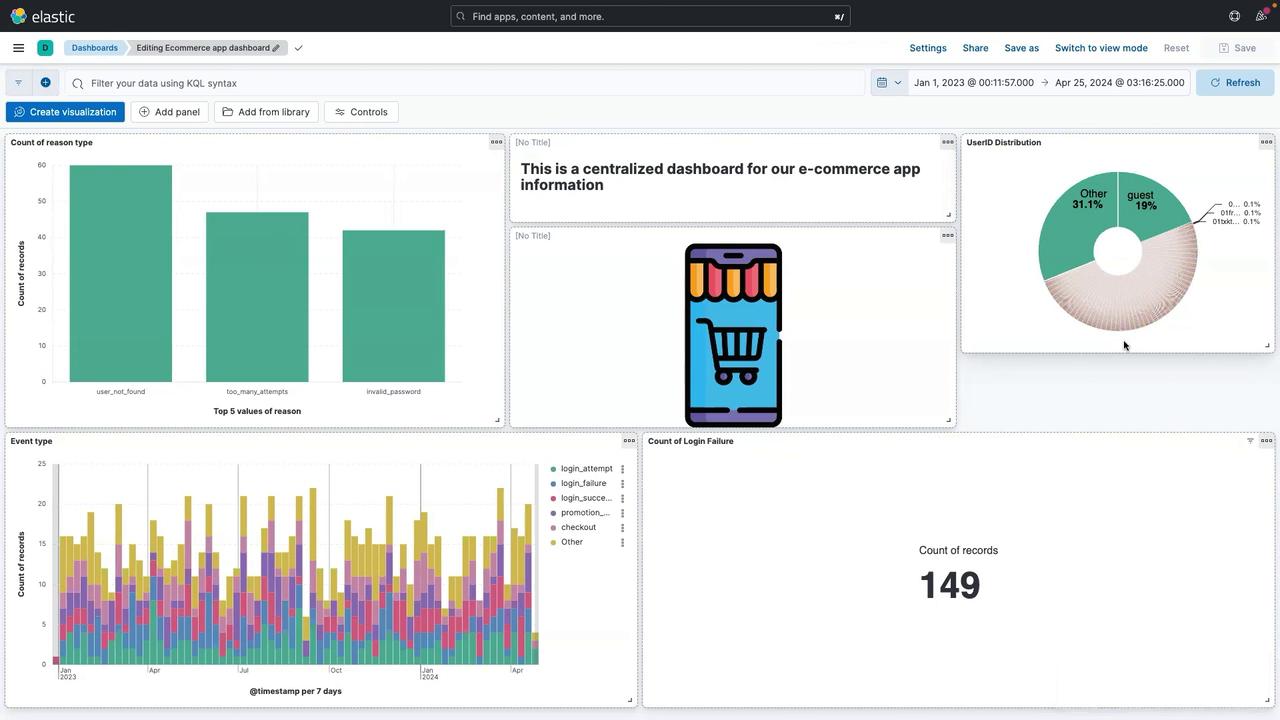
These interactive capabilities greatly enhance the troubleshooting and monitoring processes, making it easier for application developers, SREs, DevOps engineers, and product teams to extract actionable insights.
***
## Conclusion
In this lesson, you learned how to build an end-to-end dashboard for an ecommerce application using Kibana. By integrating various tools such as Lens for visualization, KQL for filtering, and interactive drilldowns, you are now equipped to monitor and debug your application effectively.
For more information on Kibana and other Elastic Stack components, check out the [Elastic Documentation](https://www.elastic.co/guide/index.html).
Thank you for following along, and stay tuned for our next lesson where we explore more advanced Kibana features.