Fundamentals of DevOps
ProductTechnology
A Data Scientists Scenario
Welcome back! In this article, we explore a DevOps scenario that follows the journey of a dedicated data professional addressing real-life challenges in software delivery performance. Team ROI, a DevOps team responsible for a single application, faced difficulties measuring their efficiency until Diego Data—a specialist in both data and DevOps—stepped in to propose actionable metrics.
Identifying the Key Metrics
Diego Data guided the team with four essential questions:
For our pipeline, what is the best indicator of efficient and timely delivery of new features?
The answer: Track the elapsed time from the first code commit to when the feature is available in production.How can we measure the workload on any given day?
The solution: Count the number of daily production deployments to assess the pressure on the software delivery system.How do we ensure that deployments are not only rapid but also reliable?
The approach: Monitor the frequency of deployment failures in production to gauge code quality.How will we monitor and resolve customer issues effectively?
The answer: Measure the average time taken to address reported customer issues, ensuring a high level of service quality.
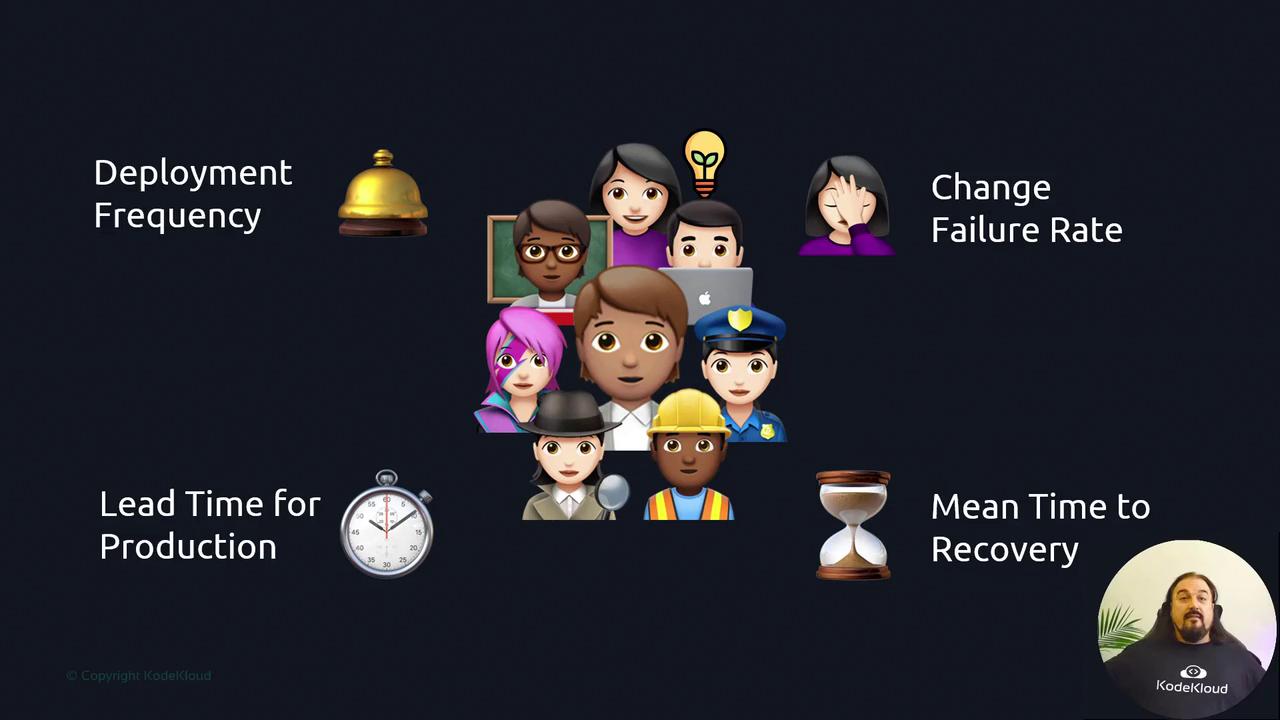
Using his expertise in data extraction and transformation, Diego compiled the necessary data around these core metrics. They now serve as fundamental components for tracking software delivery performance by measuring deployment frequency, change failure rate, lead time from commit to production, and mean time to recover.

The Four Core Metrics
The analysis distilled four pivotal DevOps performance indicators:
- Deployment Frequency: How often new features or changes are deployed.
- Change Failure Rate: The percentage of deployments that result in failures.
- Lead Time from Repository to Production: The time taken from a code commit to its deployment in production.
- Mean Time to Recover: The average time required to restore service after a failure.
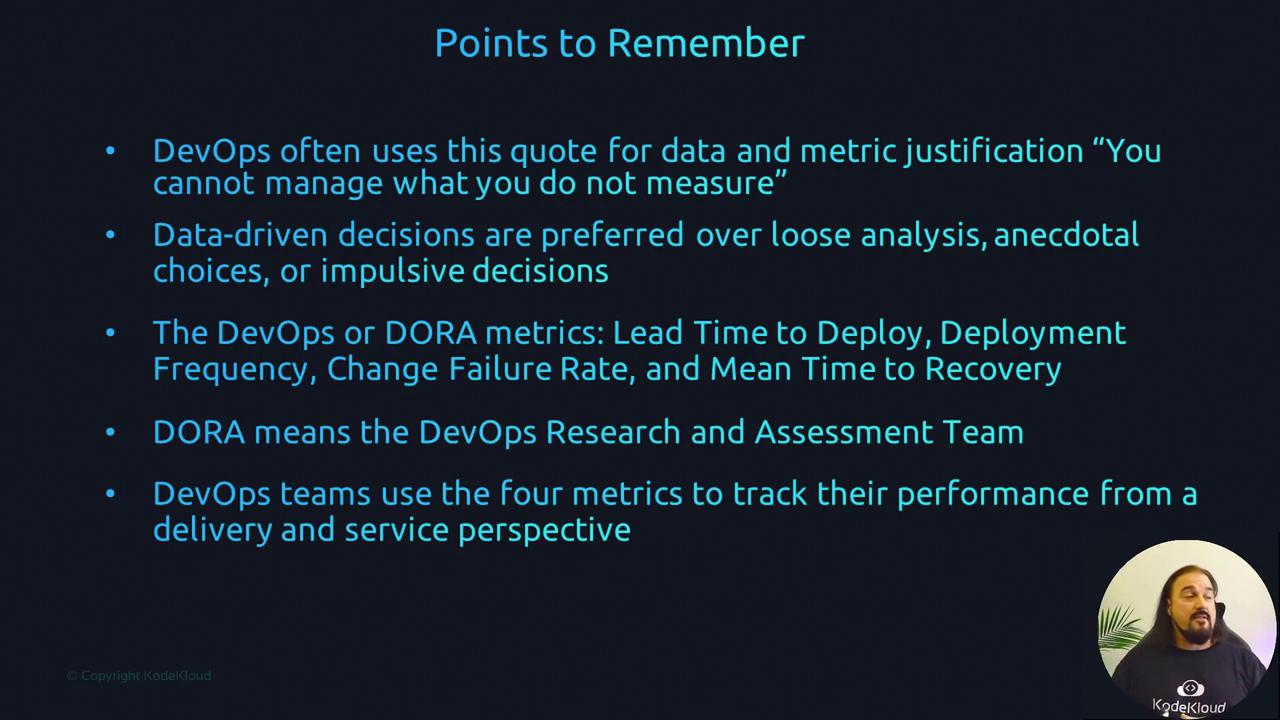
These metrics, often referred to as the DORA metrics (named after the DevOps Research and Assessment team), empower teams to adopt a data-driven approach in optimizing their software delivery processes.
Note
Focusing on these metrics not only clarifies performance but also lays the groundwork for continuous improvement, driving enhanced efficiency and customer satisfaction.

Key Takeaways
In the realm of DevOps, the guiding principle is: "You cannot manage what you do not measure." By embracing data-driven decisions over anecdotal evidence, teams can better understand and improve their delivery and service performance.
Thank you for reading. Stay tuned for our next lesson!
Michael Forrester
Watch Video
Watch video content