This article explores techniques for transforming small to medium datasets using Pandas and Polars for efficient analysis and insight generation.
Hello and welcome back! In this article, we explore an essential topic in data processing: transforming small to medium datasets for efficient analysis and insight generation. These techniques are ideal for scenarios such as cleaning sales data for a mid-size retail company or preparing survey results for research projects. We leverage two powerful Python libraries—Pandas and Polars—to streamline these operations.Both Pandas and Polars offer excellent functionality for handling smaller datasets. Pandas, known for its versatility, is akin to a Swiss army knife for data manipulation. For example, a data scientist might use Pandas to clean messy customer feedback data before generating insights. On the other hand, Polars is optimized for performance. Imagine a financial analyst dealing with real-time series data—Polars ensures lightning-fast computations while maintaining data integrity.
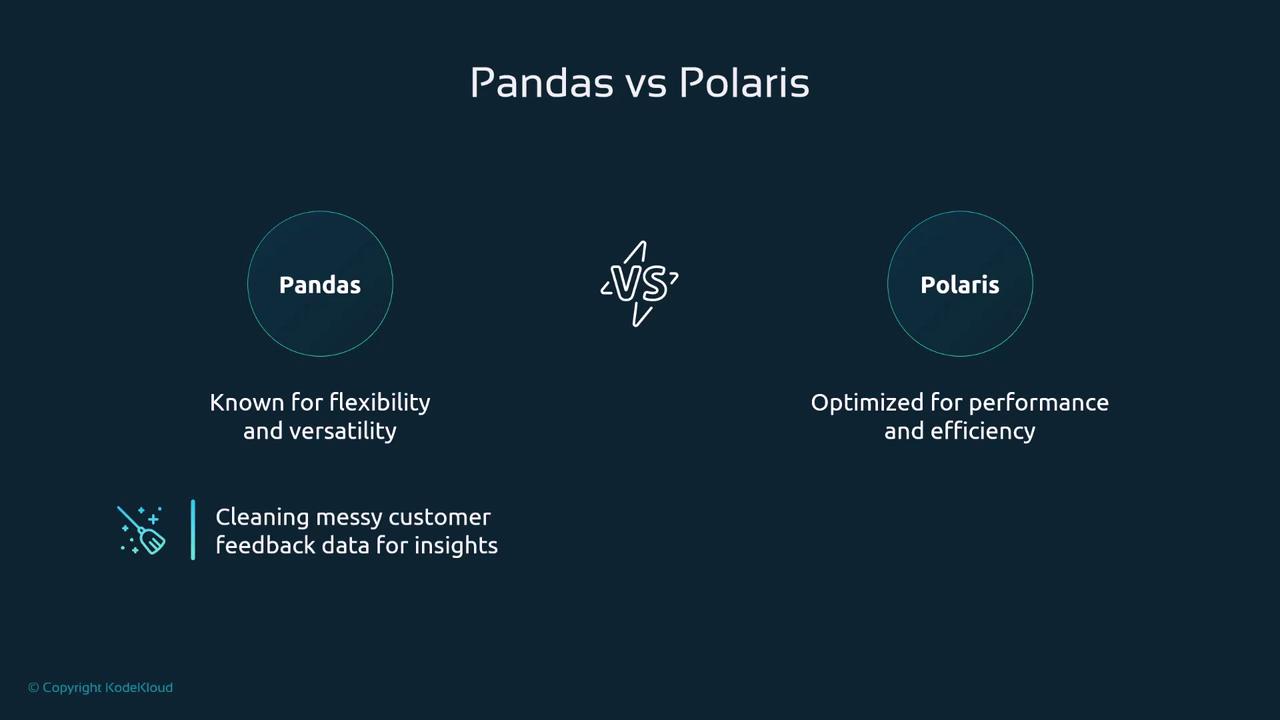
The image below further emphasizes the key differences: while Pandas is celebrated for its flexibility and versatility, Polars stands out for performance and efficiency, particularly when cleaning messy data to extract valuable insights.
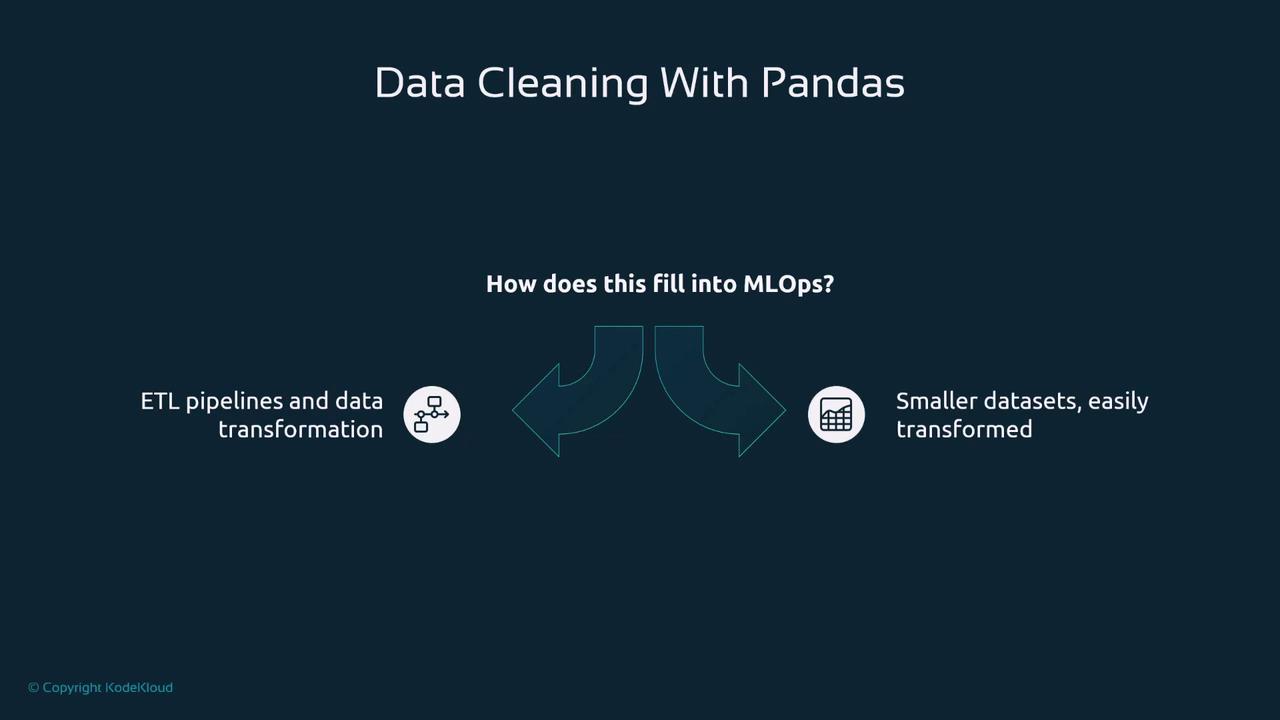
Before diving into specific cleaning techniques, it is important to understand how these processes fit into the broader field of MLOps. In building ETL pipelines and performing data transformations, handling smaller, manageable datasets effectively is key. Both Pandas and Polars simplify this process.
Below are some of the most commonly used functions in Pandas, organized by their specific use cases.
Missing values can adversely impact your analysis, so addressing them early is crucial. Pandas provides simple yet powerful methods such as:
Copy
df.dropna(inplace=True)df.fillna(0, inplace=True)
For instance, in an e-commerce scenario, if a dataset containing customer age values has missing entries, using fillna(0) helps assign a default value, ensuring consistent data for subsequent analysis.
Duplicate records can clutter your dataset and lead to misleading outcomes. Pandas’ drop_duplicates function is designed to address this issue:
Copy
df.drop_duplicates(inplace=True)
In a hospital setting, for example, multiple records for the same patient might appear due to clinical data errors, and removing duplicates helps maintain the accuracy of reporting and billing.
Ensuring consistent data types across your dataset is crucial for reliable analysis. Pandas makes it straightforward to standardize data columns with the astype method. Consider converting a column representing ages from strings to integers:
Copy
df['age'] = df['age'].astype(int)
This standardization is particularly important for tasks like converting a budget column from strings to numeric values before performing campaign performance analysis.
Beyond cleaning data, Pandas excels in data transformation tasks such as filtering and sorting. These operations allow you to, for example, filter transactions by product category or sort data by purchase date, revealing critical shopping behavior trends that help businesses identify high-value segments.
Summarizing large datasets into meaningful insights is achievable through aggregation. With Pandas functions like groupby and agg, you can group sales data by region and calculate total sales per region:
Data often originates from multiple sources and must be merged to gain a comprehensive understanding. Pandas offers merge and join functions that work similarly to SQL joins. Here is an example of merging two datasets on a common customer ID:
Copy
df_merged = pd.merge(df1, df2, on='id')
Merging datasets can combine complementary information, which is critical for comprehensive data analysis.
After mastering data cleaning and transformation, you might ask how to run or schedule these tasks periodically (e.g., daily or hourly). This topic will be covered in a future article on orchestration. For now, focus on getting comfortable with the basics of data cleaning and transformation using either Pandas or Polars, as they are fundamental tools for any MLOps engineer.That concludes this article. We hope you found it informative and look forward to exploring more advanced topics in upcoming posts.Thank you for reading!