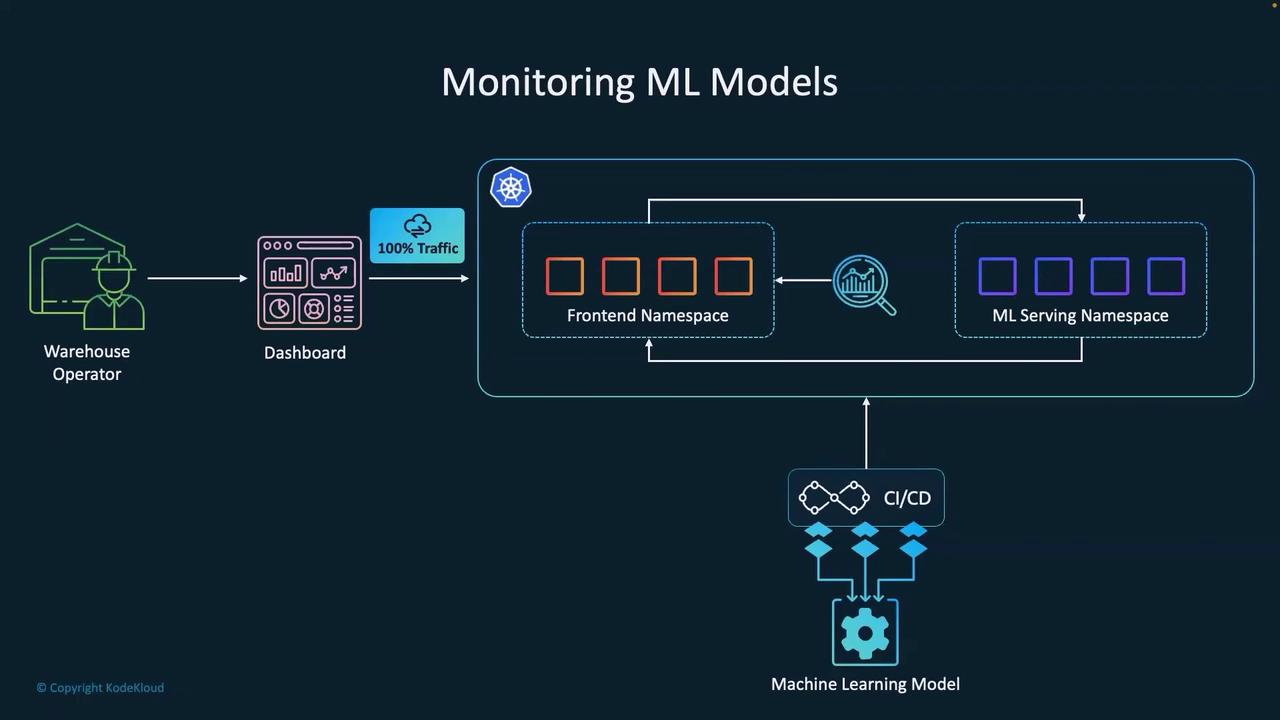
The Importance of ML Model Monitoring
Once deployed, continuous monitoring ensures that your models operate as expected and allows for prompt intervention when issues arise. Check out this visual overview:
-
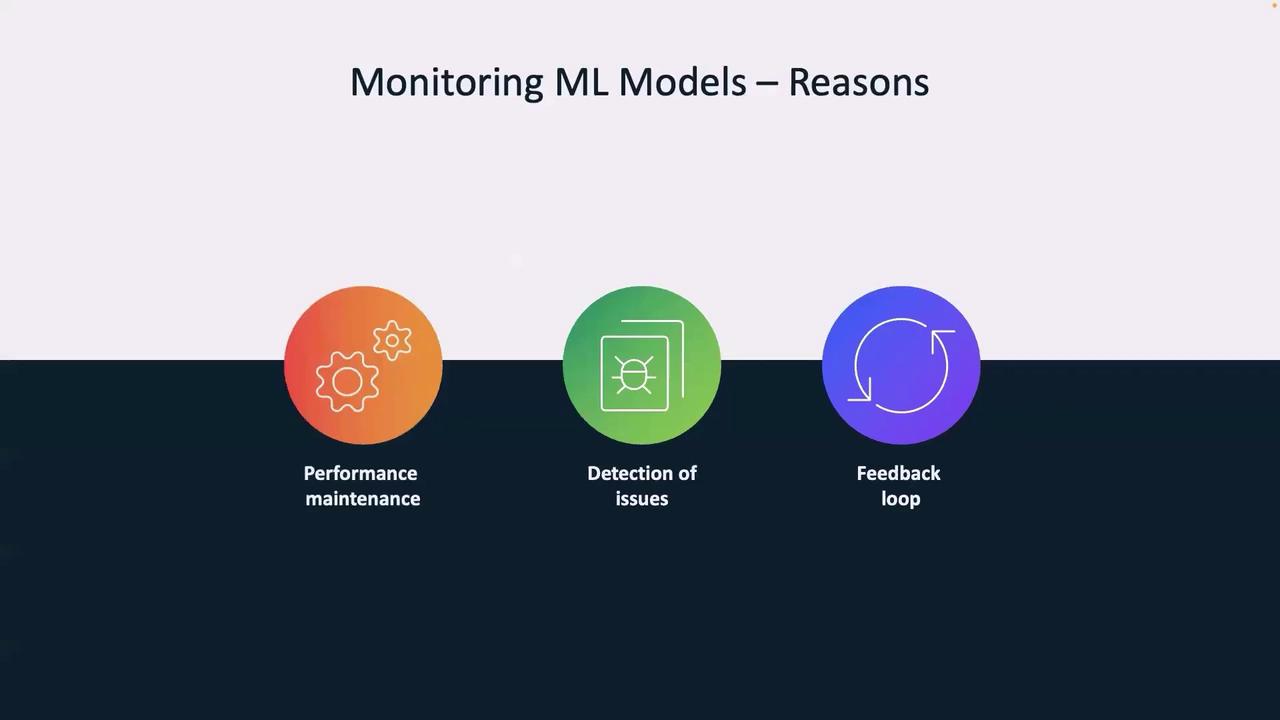
Performance and Maintenance
Think of this as a regular health check for your model. For example, if a credit score model’s accuracy drops from 95% to 85% over three months due to changing economic conditions, timely alerts allow for immediate corrective measures. -
Reduction of Issues
Monitoring covers more than simple performance metrics. For instance, a recommendation system might begin favoring certain categories during seasonal trends; without proper monitoring, such biases could remain undetected for too long. -
Feedback Loop
Continuous improvement relies on a robust feedback loop. In a fraud detection system, for example, monitoring helps identify recurring false positives, providing insights to retrain and refine the model with better data.
Ensuring comprehensive monitoring helps not only in maintaining model performance but also in uncovering hidden patterns or biases that might affect decision-making. Start integrating these practices early in your ML lifecycle.
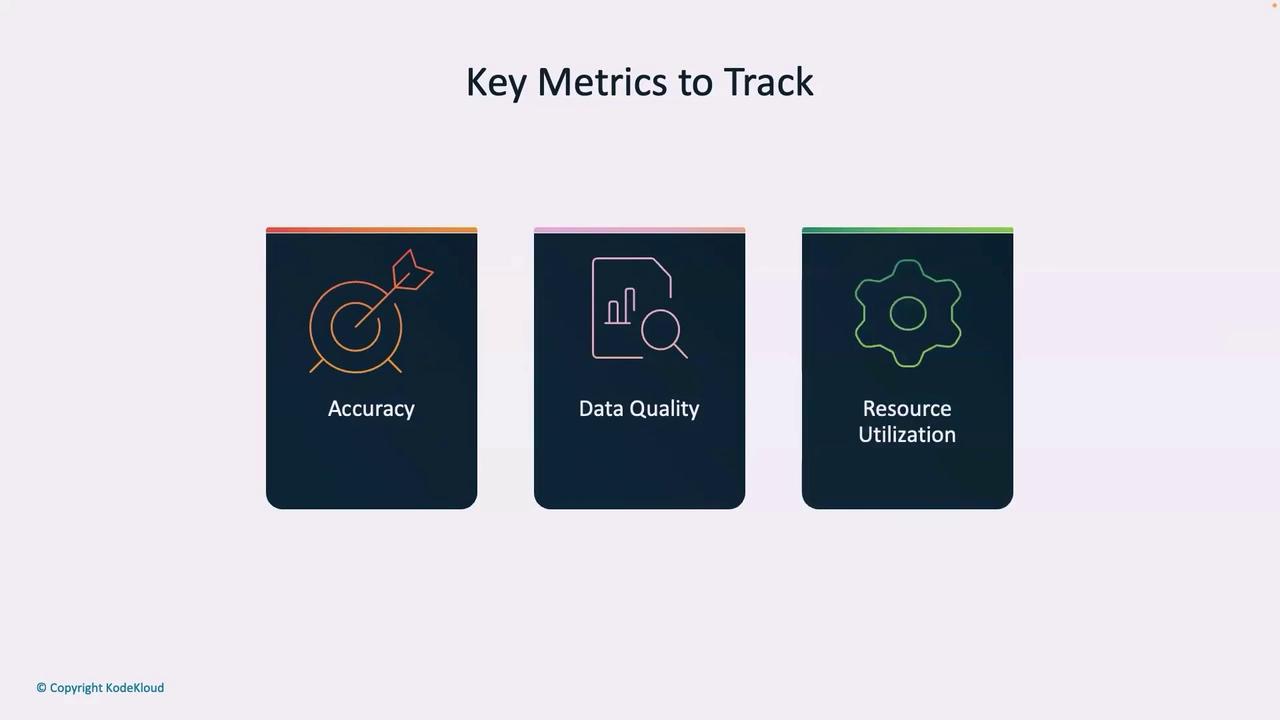
Essential Metrics to Track
Monitoring should include a range of metrics to provide a complete picture of your model’s performance and health. Essential metrics include:-
Accuracy Metrics
Go beyond overall accuracy; track class-specific results, analyze confusion matrices, and review confidence score distributions. For instance, in a production image classification model, these insights can highlight subtle performance shifts. -
Data Quality
Verify that incoming data meets expected standards by monitoring for feature drift, missing values, and schema changes. If you are processing sensor data, ensure that values remain within the expected range for accurate model inference. -
Resource Utilization
Monitor system-level metrics like inference latency, memory usage, and GPU utilization. A sudden increase in latency can indicate a bottleneck or potential system issues in data processing.
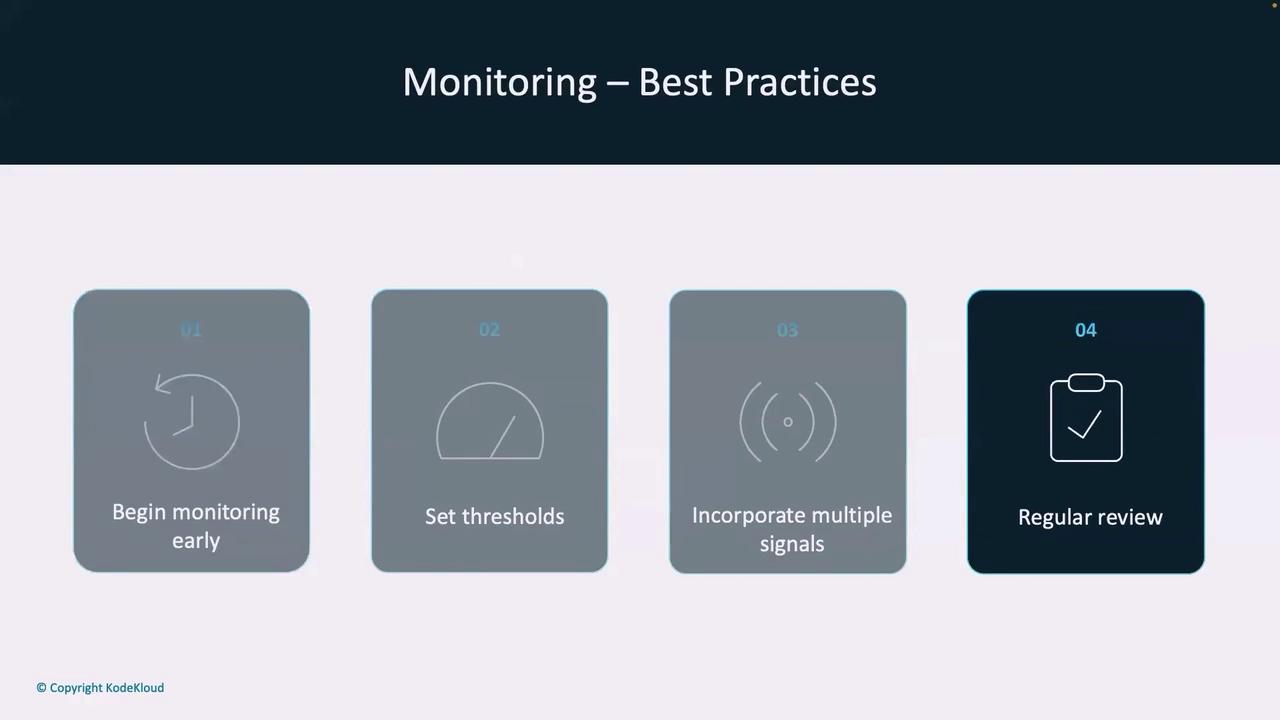
Best Practices for ML Model Monitoring
Adopting these best practices helps form a proactive approach to ML monitoring:-
Begin Monitoring Early
Integrate monitoring during the model validation phase rather than waiting for problems in production. -
Set Clear Thresholds
Define explicit limits for performance, data drift, and resource usage. These thresholds aid in early detection of issues. -
Incorporate Multiple Signals
When one metric, such as accuracy, deviates, corroborate with other indicators like resource utilization or data drift to identify the root cause. -
Regular Reviews
Schedule periodic reviews of your metrics rather than relying solely on automated alerts to ensure continuous improvement.
Begin with critical metrics and expand your monitoring framework progressively. This iterative approach not only simplifies initial setup but also builds confidence in your deployed models over time.
Specialized Monitoring Tools
Several tools can enhance your ML monitoring strategy, each offering unique capabilities:-
Prometheus:
A powerful time-series monitoring system commonly used in DevOps, ideal for tracking ML model metrics. -
Evidently AI:
Specializes in ML monitoring and drift detection, providing insights tailored for machine learning applications. -
Grafana:
Offers robust visualization and dashboard capabilities on top of Prometheus, making your monitoring data both accessible and actionable.