> ## Documentation Index
> Fetch the complete documentation index at: https://notes.kodekloud.com/llms.txt
> Use this file to discover all available pages before exploring further.
# Cost Efficiency and Reliability
> Explains how reliability targets raise costs exponentially and how autoscaling, graceful degradation, instance purchasing, and SLO-based budgeting balance reliability and spending
Reliability doesn’t come for free — higher reliability targets drive exponential increases in cost, operational complexity, and required expertise. Small-looking changes in the number of “9s” (e.g., 99.9% → 99.99%) often imply large jumps in redundancy, automation, and engineering effort. Understanding the economics of reliability helps you make defensible trade-offs, set realistic SLOs, and explain those decisions to stakeholders. When you can show the cost behind a reliability target, you move from implementer to trusted advisor on how the business should invest in reliability.
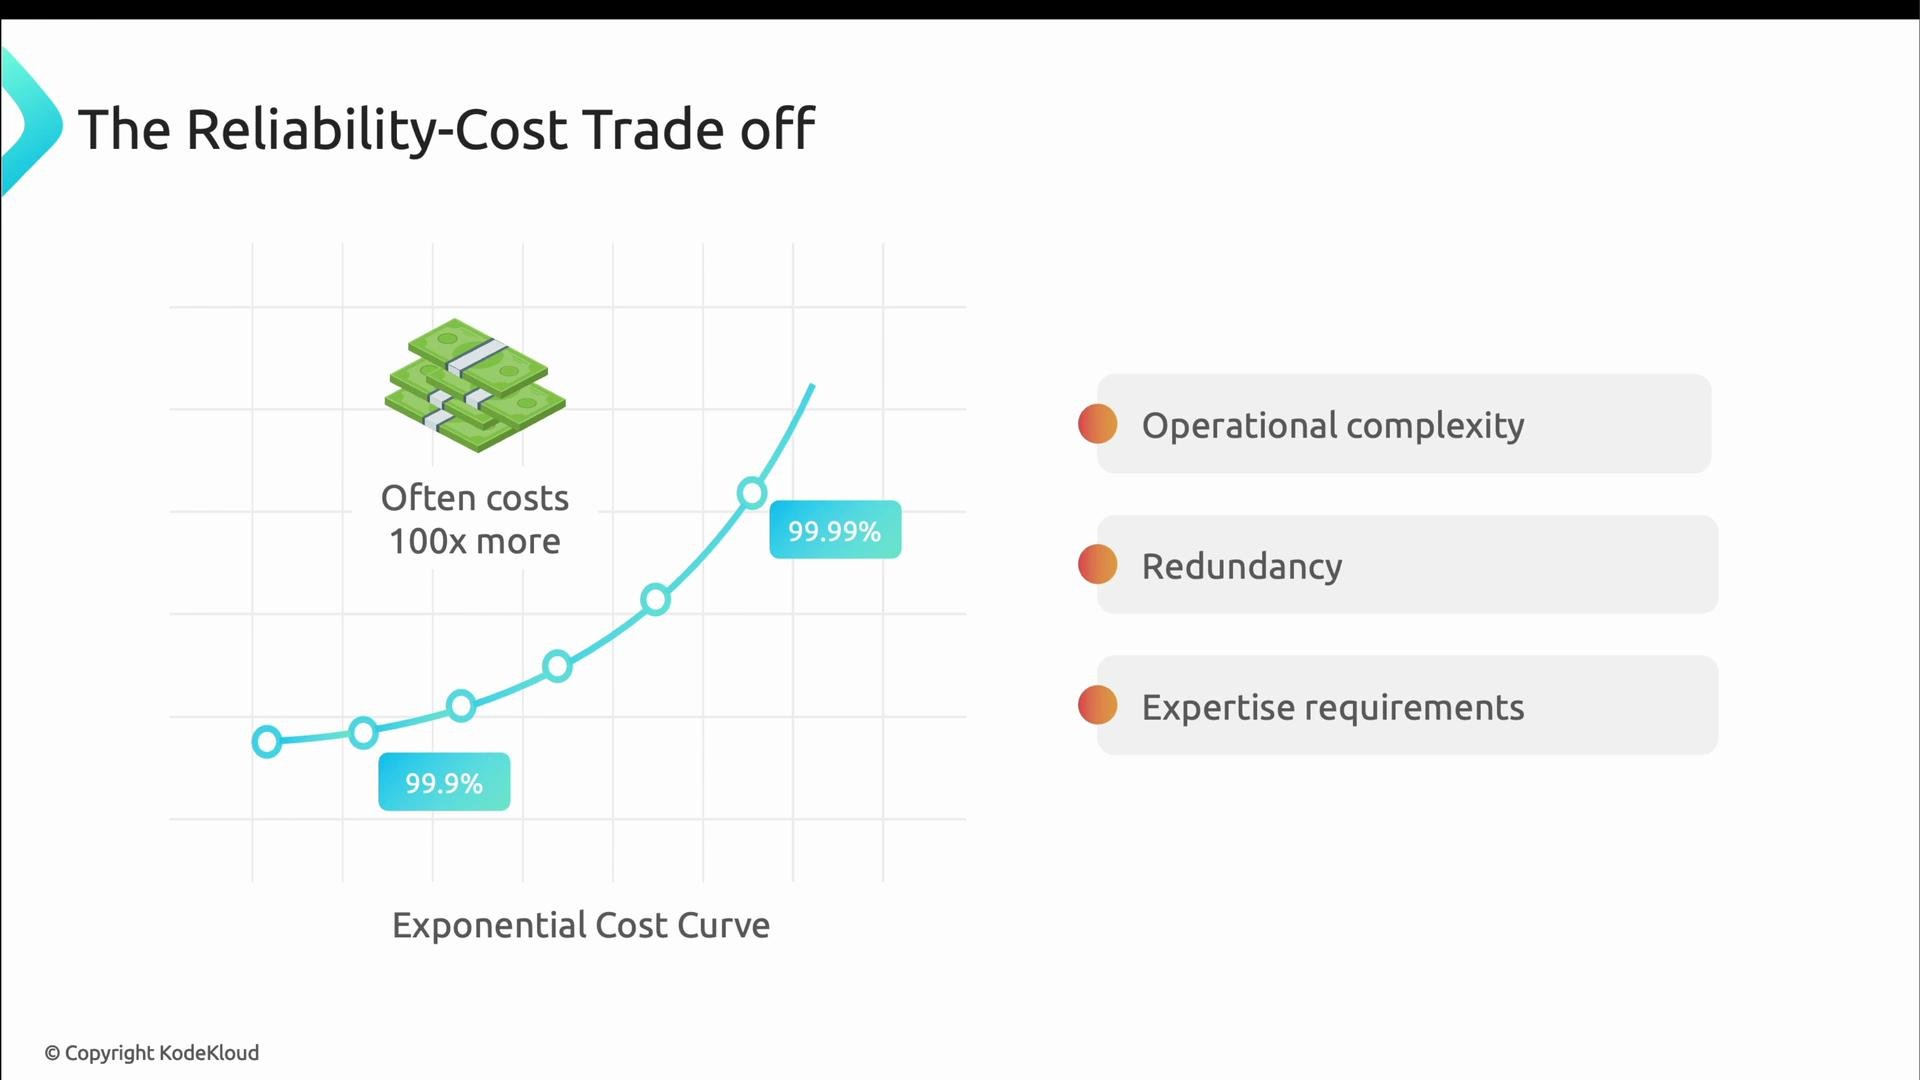
The reliability cost trade-off typically follows an exponential curve: each extra “9” can cost 10×, 50×, or even 100× more. The goal is balance: perfect reliability is impossible and pursuing it blindly can bankrupt you. Define a reasonable error budget so the team can take calculated risks and continue developing the product.
 Concrete monthly cost examples (the numbers below are illustrative to show scaling effects):
* Startup e-commerce site
* 99.9% reliability → ≈ \$6,000 / month
* 99.99% reliability → ≈ \$53,000 / month (≈9× increase)
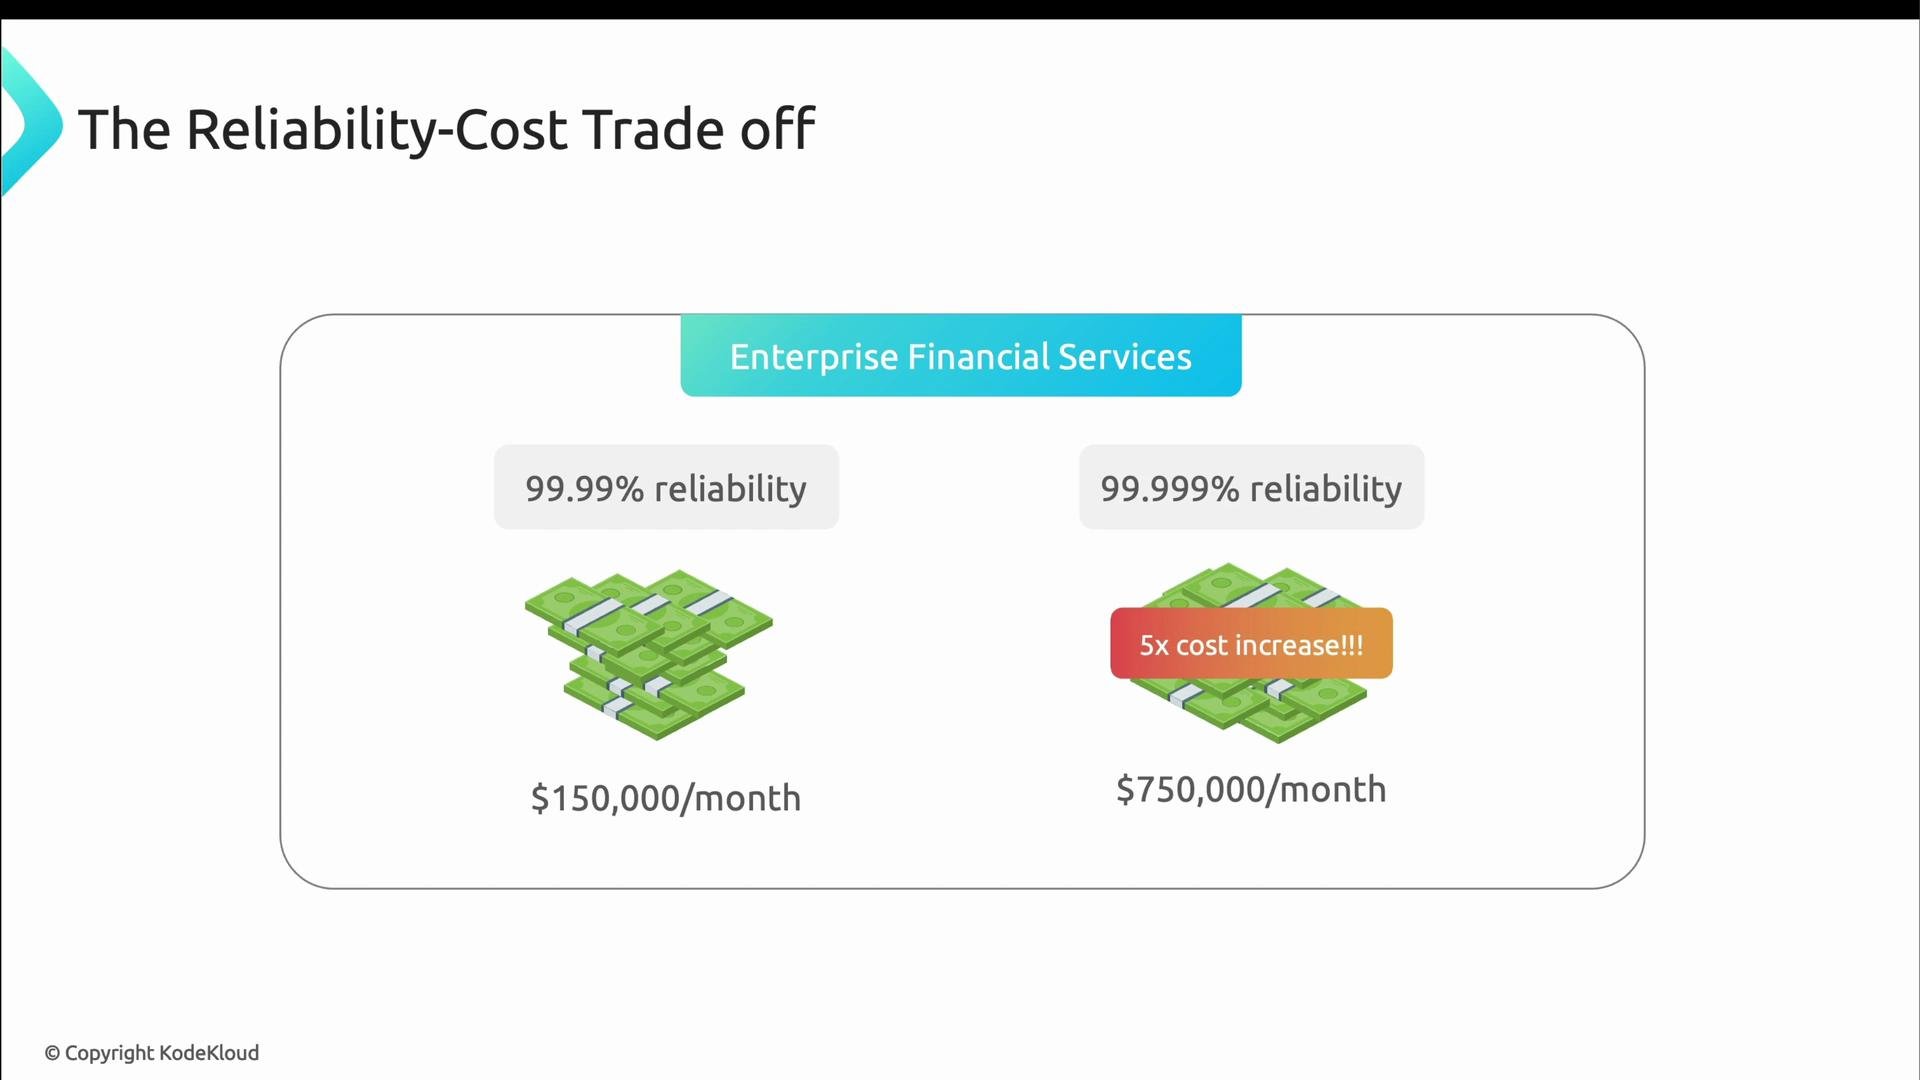
* Enterprise financial services
* 99.99% reliability → ≈ \$150,000 / month
* 99.999% reliability → ≈ \$750,000 / month (≈5× increase)
The key question for any organization: does the business need that extra nine, or could the budget be better spent elsewhere?
Concrete monthly cost examples (the numbers below are illustrative to show scaling effects):
* Startup e-commerce site
* 99.9% reliability → ≈ \$6,000 / month
* 99.99% reliability → ≈ \$53,000 / month (≈9× increase)
* Enterprise financial services
* 99.99% reliability → ≈ \$150,000 / month
* 99.999% reliability → ≈ \$750,000 / month (≈5× increase)
The key question for any organization: does the business need that extra nine, or could the budget be better spent elsewhere?
 Reliability also involves trade-offs between over‑engineering and under‑engineering:
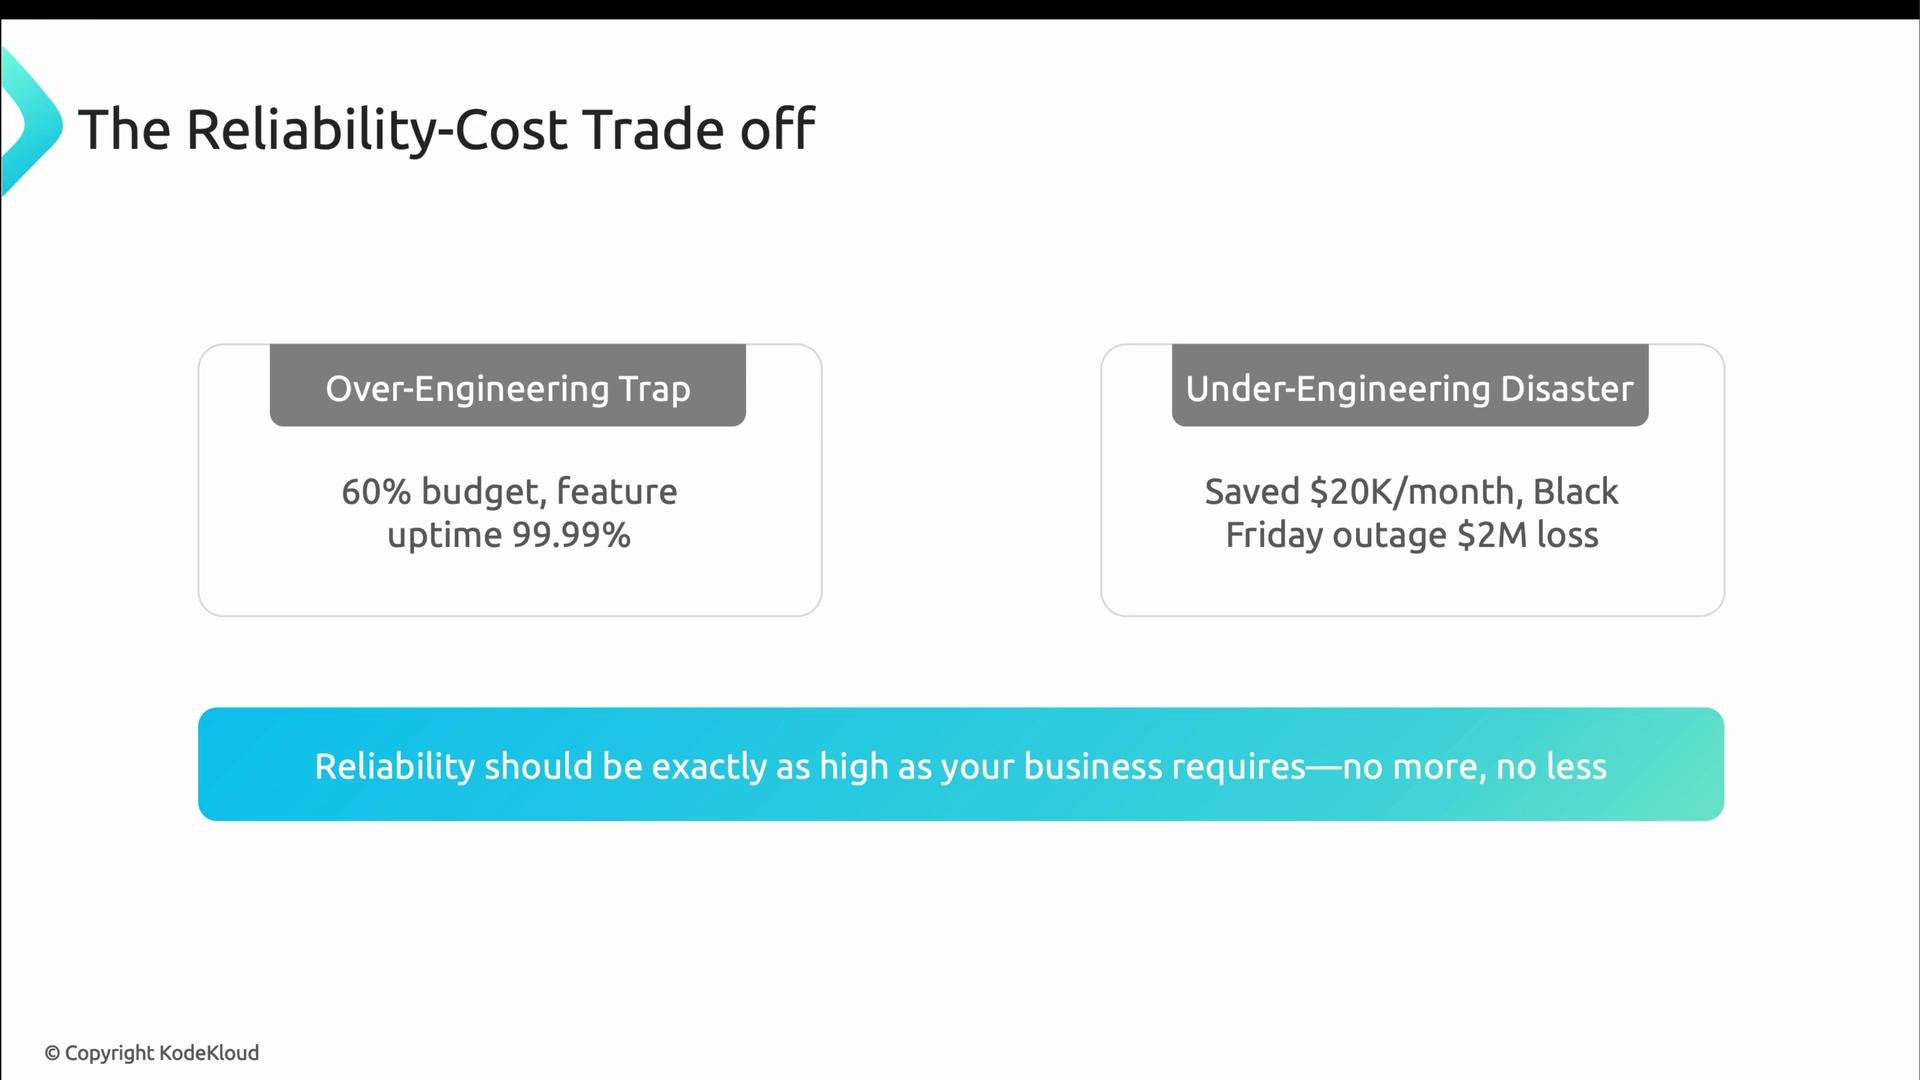
* Over‑engineering trap: Spending a disproportionate portion of engineering budget (e.g., 60%) to reach four nines for a feature used by only 10% of customers, while the core product runs at 99.5% — misaligned investment.
* Under‑engineering disaster: Cutting \$20K/month in infrastructure costs, then suffering a major outage (for example on Black Friday) that costs millions in lost revenue and reputation.
Set reliability where the business requires it — no more, no less.
Reliability also involves trade-offs between over‑engineering and under‑engineering:
* Over‑engineering trap: Spending a disproportionate portion of engineering budget (e.g., 60%) to reach four nines for a feature used by only 10% of customers, while the core product runs at 99.5% — misaligned investment.
* Under‑engineering disaster: Cutting \$20K/month in infrastructure costs, then suffering a major outage (for example on Black Friday) that costs millions in lost revenue and reputation.
Set reliability where the business requires it — no more, no less.
 Autoscaling is one of the largest levers for controlling reliability cost. The right autoscaling strategy keeps services available without paying for excessive idle capacity; the wrong strategy either wastes money or causes outages.
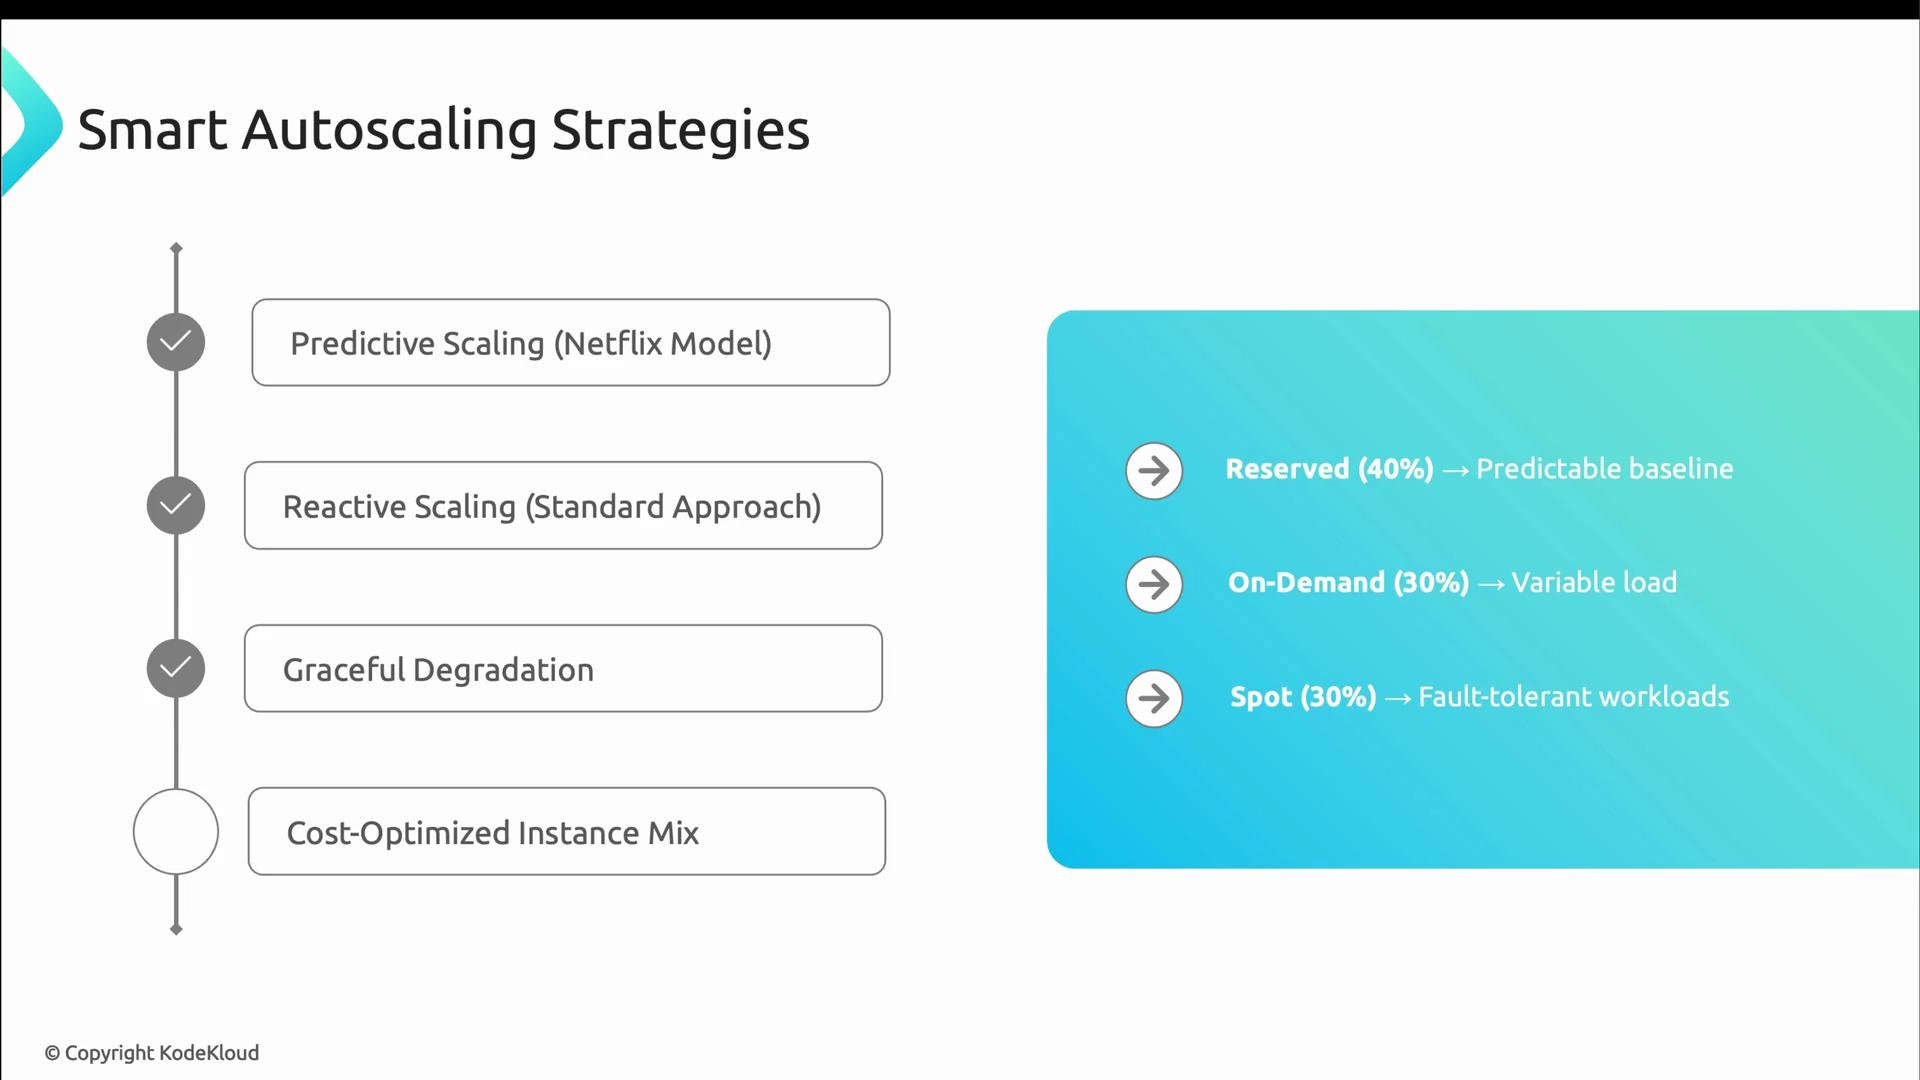
Common autoscaling approaches:
* Predictive scaling: Forecast traffic spikes and scale out in advance (used at scale by companies such as Netflix).
* Reactive scaling: Increase replicas/resources when metrics (CPU, memory, queue depth) cross thresholds. Kubernetes Horizontal Pod Autoscaler (HPA) is a common reactive tool.
* Graceful degradation: Reduce or disable lower-priority, expensive features when capacity is constrained so the system remains available.
* Cost‑optimized instance mix: Combine reserved, on‑demand, and spot instances to balance predictable baseline capacity and inexpensive burst capacity.
Example Kubernetes HPA-style fragment (min/max replicas and target CPU):
```yaml theme={null}
spec:
minReplicas: 3
maxReplicas: 50
metrics:
- type: Resource
resource:
name: cpu
target:
averageUtilization: 70
```
Graceful degradation example (application-level fallback to cheaper cached recommendations):
```python theme={null}
def get_recommendations(user_id, budget_mode=False):
if budget_mode:
return get_cached_recommendations(user_id) # fast, cheap
else:
return get_ml_recommendations(user_id) # slow, expensive
```
Example instance purchase mix (illustrative):
| Instance type | Role |
| --------------- | ---------------------------------------------------------- |
| Reserved (40%) | Predictable baseline capacity |
| On‑demand (30%) | Variable spikes and sudden load |
| Spot (30%) | Interruptible, fault‑tolerant workloads (batch, analytics) |
Autoscaling is one of the largest levers for controlling reliability cost. The right autoscaling strategy keeps services available without paying for excessive idle capacity; the wrong strategy either wastes money or causes outages.
Common autoscaling approaches:
* Predictive scaling: Forecast traffic spikes and scale out in advance (used at scale by companies such as Netflix).
* Reactive scaling: Increase replicas/resources when metrics (CPU, memory, queue depth) cross thresholds. Kubernetes Horizontal Pod Autoscaler (HPA) is a common reactive tool.
* Graceful degradation: Reduce or disable lower-priority, expensive features when capacity is constrained so the system remains available.
* Cost‑optimized instance mix: Combine reserved, on‑demand, and spot instances to balance predictable baseline capacity and inexpensive burst capacity.
Example Kubernetes HPA-style fragment (min/max replicas and target CPU):
```yaml theme={null}
spec:
minReplicas: 3
maxReplicas: 50
metrics:
- type: Resource
resource:
name: cpu
target:
averageUtilization: 70
```
Graceful degradation example (application-level fallback to cheaper cached recommendations):
```python theme={null}
def get_recommendations(user_id, budget_mode=False):
if budget_mode:
return get_cached_recommendations(user_id) # fast, cheap
else:
return get_ml_recommendations(user_id) # slow, expensive
```
Example instance purchase mix (illustrative):
| Instance type | Role |
| --------------- | ---------------------------------------------------------- |
| Reserved (40%) | Predictable baseline capacity |
| On‑demand (30%) | Variable spikes and sudden load |
| Spot (30%) | Interruptible, fault‑tolerant workloads (batch, analytics) |
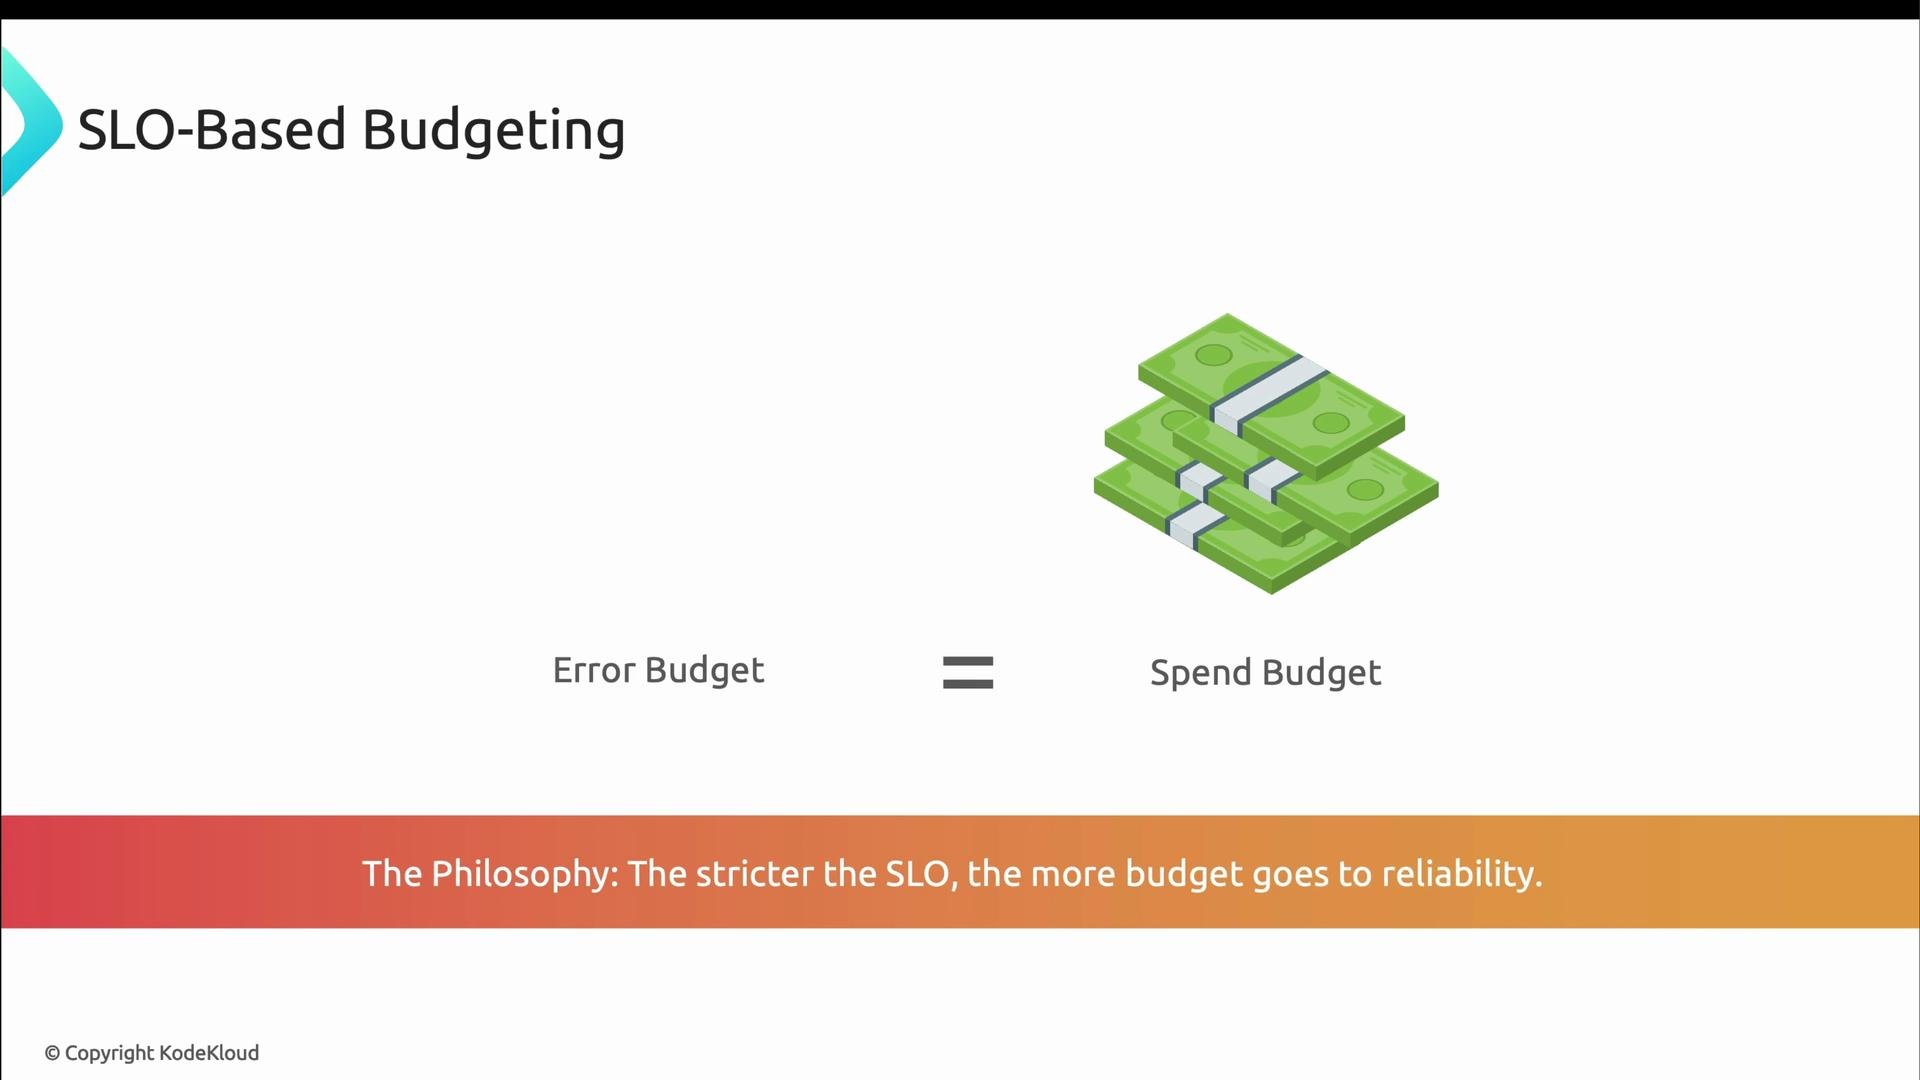
 SLO-based budgeting connects reliability targets directly to spend: the error budget effectively becomes a spend budget. The stricter the SLO, the larger the share of budget required for reliability work (redundancy, automation, specialist skills).
Observational guidelines:
* 99.99% SLO: very strict — often requires considerable investment and may consume a high fraction of monthly spend.
* 99.9% SLO: moderate — budgets are often split between reliability and new features.
* 99% SLO: relaxed — more budget remains available for feature development.
SLO-based budgeting connects reliability targets directly to spend: the error budget effectively becomes a spend budget. The stricter the SLO, the larger the share of budget required for reliability work (redundancy, automation, specialist skills).
Observational guidelines:
* 99.99% SLO: very strict — often requires considerable investment and may consume a high fraction of monthly spend.
* 99.9% SLO: moderate — budgets are often split between reliability and new features.
* 99% SLO: relaxed — more budget remains available for feature development.
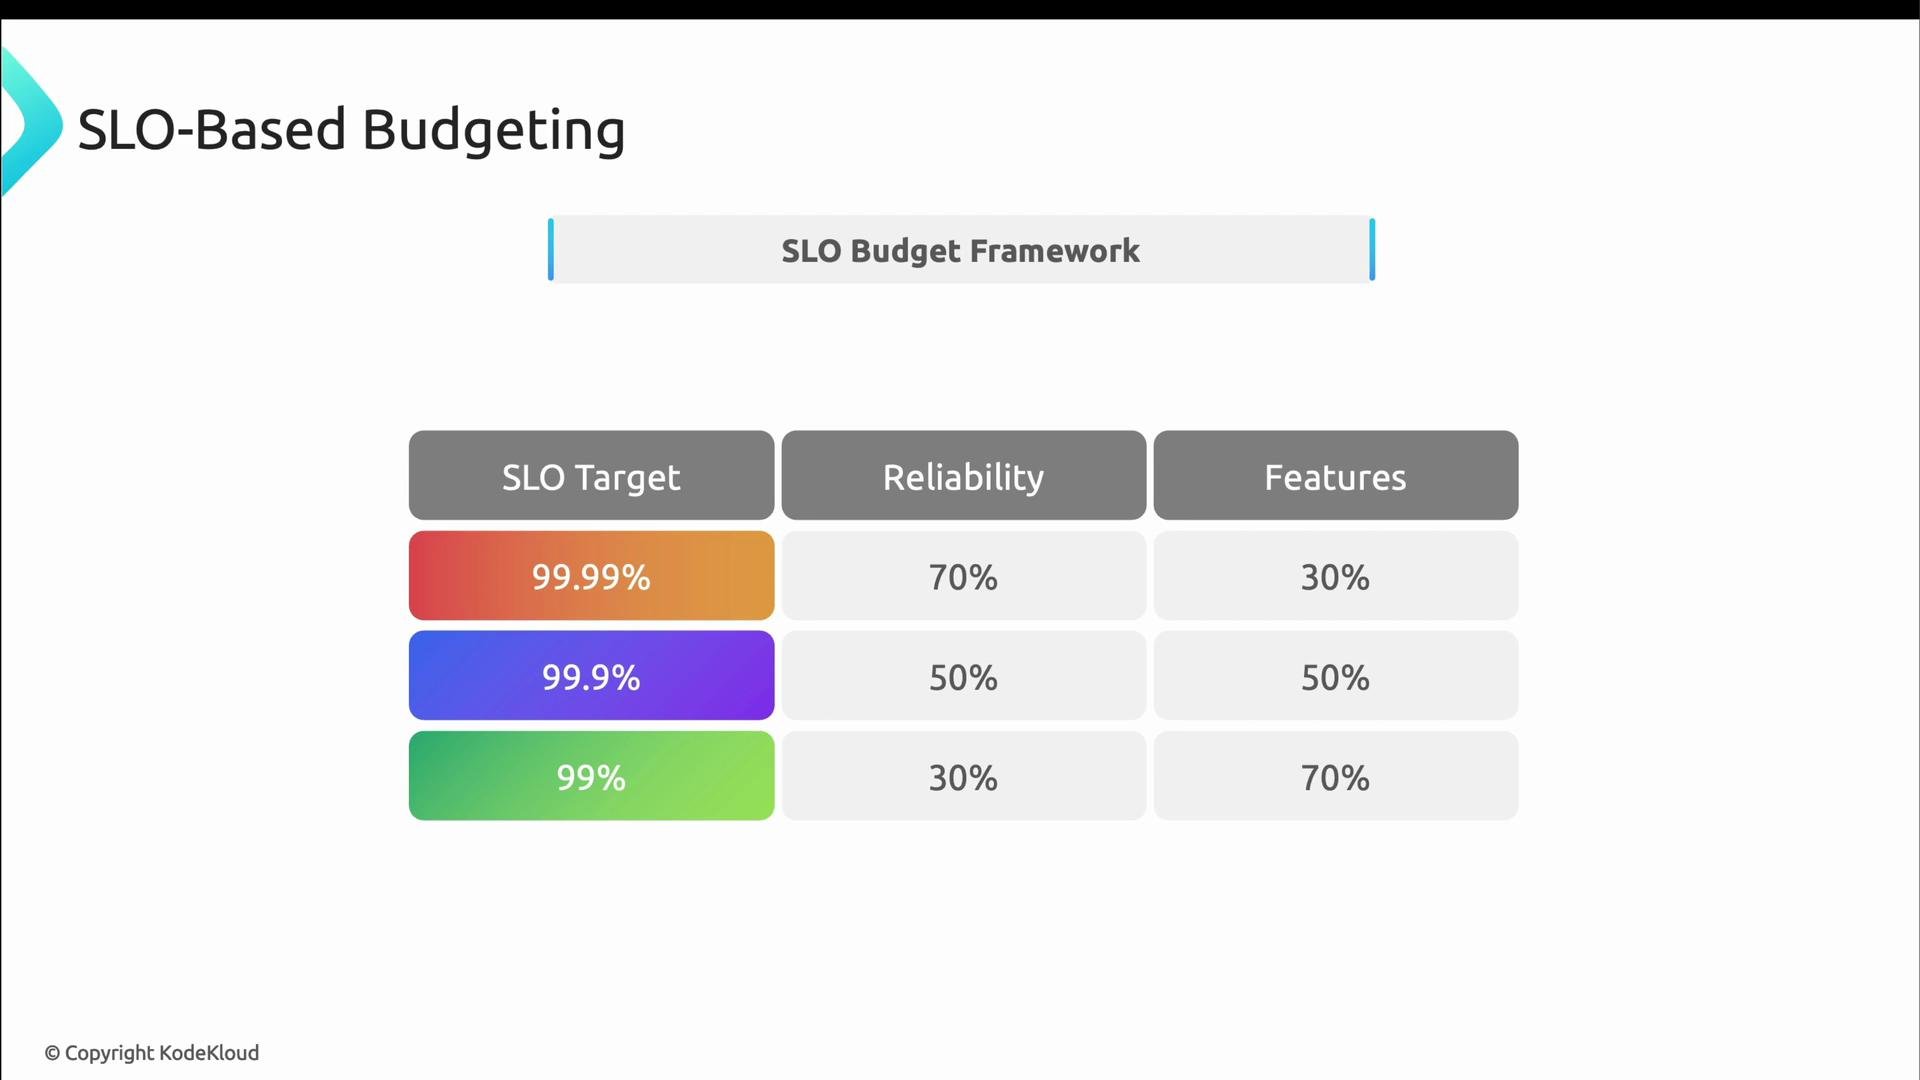
 Here’s a compact SLO → budget split reference (table form improves clarity and SEO):
| SLO Target | Typical Reliability Spend | Typical Features Spend |
| ---------- | ------------------------: | ---------------------: |
| 99.99% | \~70% | \~30% |
| 99.9% | \~50% | \~50% |
| 99% | \~30% | \~70% |
Here’s a compact SLO → budget split reference (table form improves clarity and SEO):
| SLO Target | Typical Reliability Spend | Typical Features Spend |
| ---------- | ------------------------: | ---------------------: |
| 99.99% | \~70% | \~30% |
| 99.9% | \~50% | \~50% |
| 99% | \~30% | \~70% |
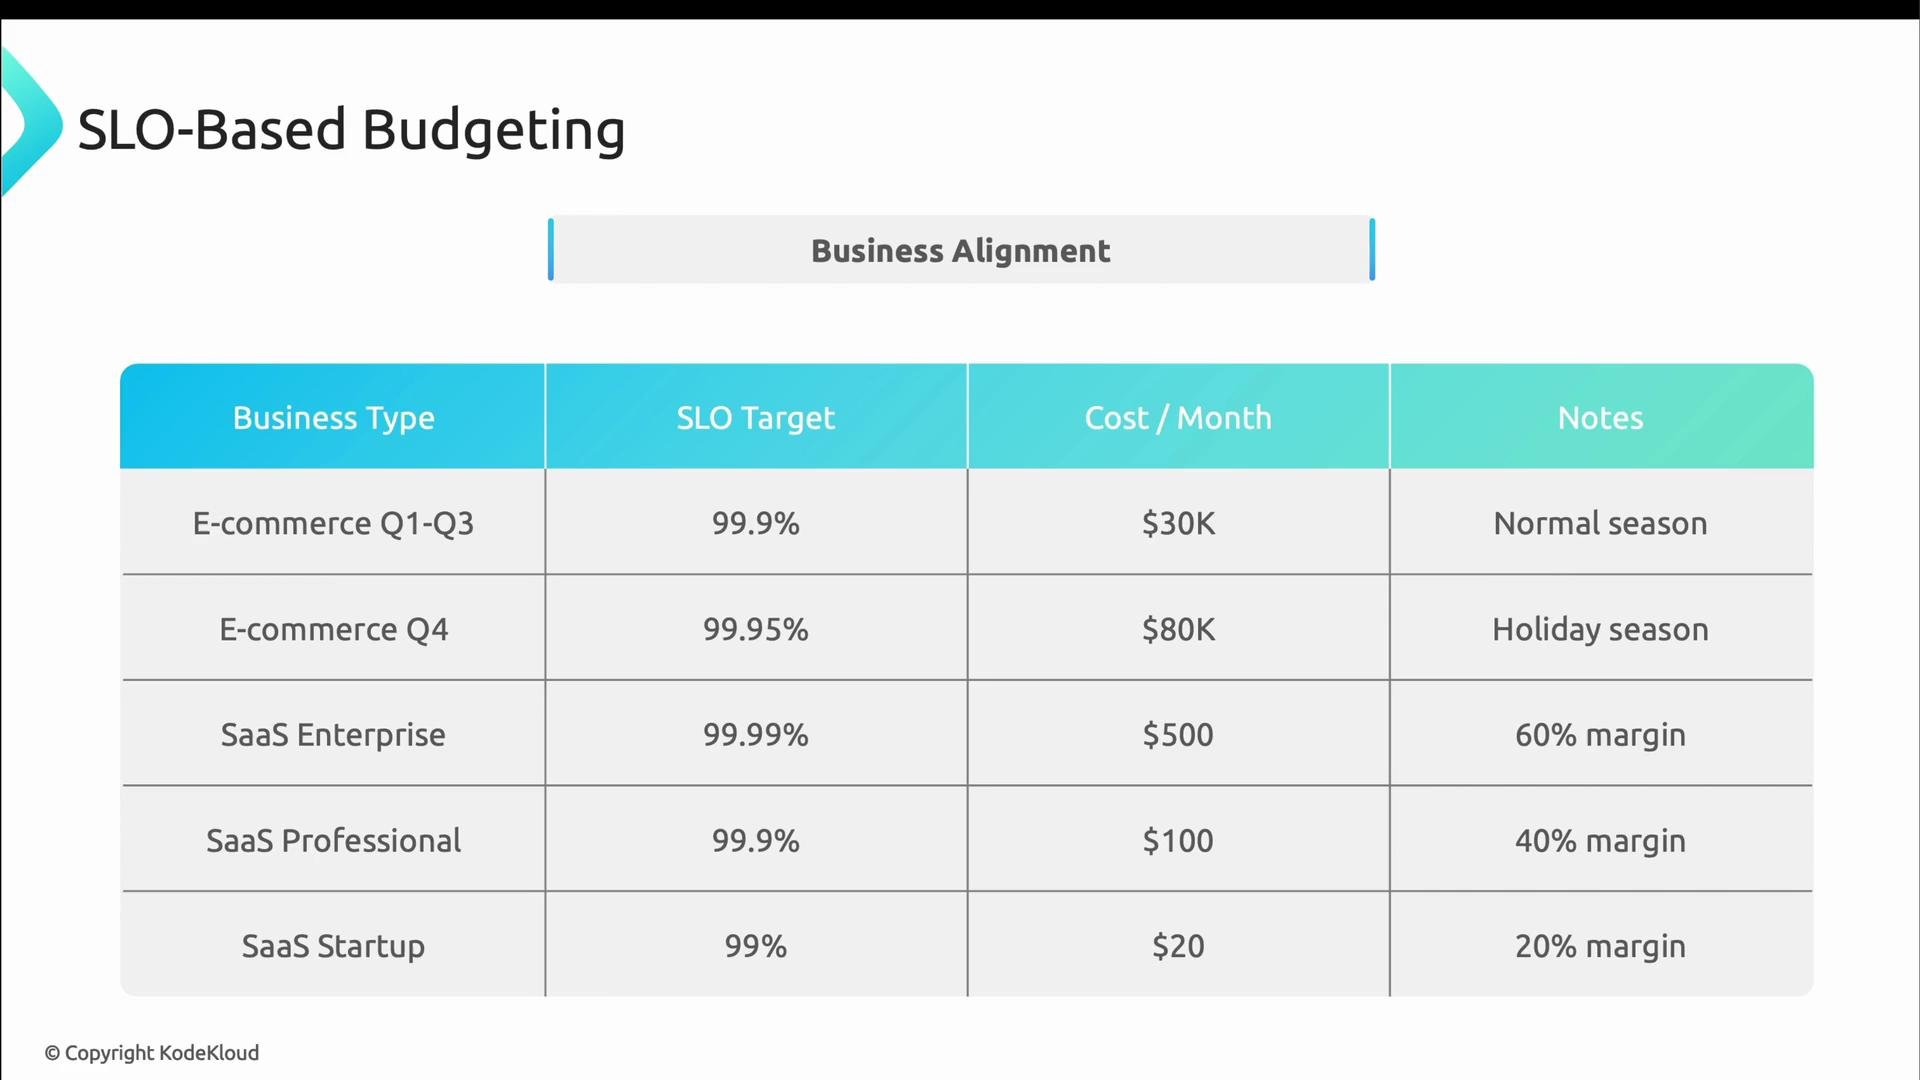
 SLOs change with business context. Examples:
* E‑commerce might operate at 99.9% for most of the year (\~$30K/mo), but during holiday season tighten to 99.95% with costs nearly tripling (~$80K/mo).
* SaaS vendors commonly tier SLOs: enterprise customers expect four nines (large investment), professional tiers get three nines, entry-level tiers accept lower targets.
SLOs change with business context. Examples:
* E‑commerce might operate at 99.9% for most of the year (\~$30K/mo), but during holiday season tighten to 99.95% with costs nearly tripling (~$80K/mo).
* SaaS vendors commonly tier SLOs: enterprise customers expect four nines (large investment), professional tiers get three nines, entry-level tiers accept lower targets.
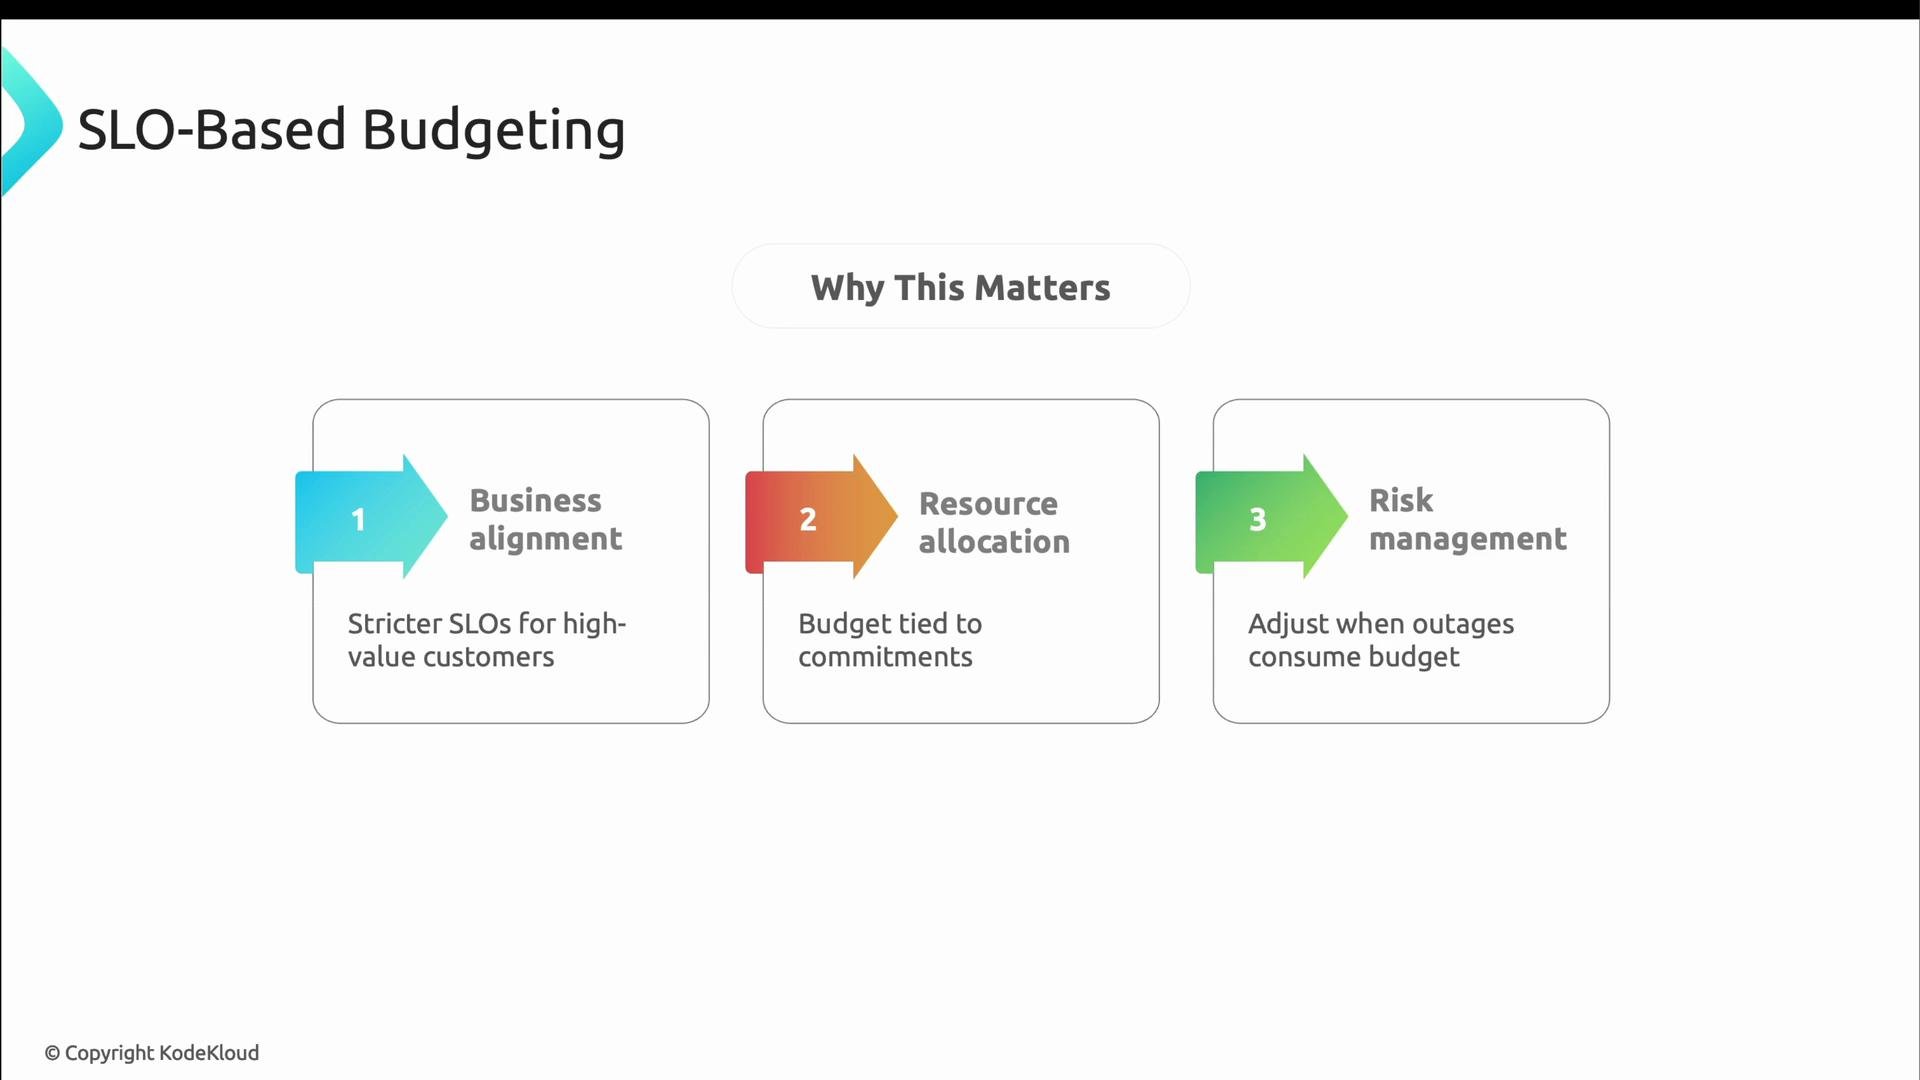
 Why SLO-based budgeting matters:
* Business alignment: Higher-value or mission‑critical customers get stricter SLOs funded by higher investment.
* Resource allocation: Budgets are guided by concrete reliability commitments rather than guesswork.
* Risk management: When outages burn error budget, prioritize reliability work until the error budget is replenished.
Why SLO-based budgeting matters:
* Business alignment: Higher-value or mission‑critical customers get stricter SLOs funded by higher investment.
* Resource allocation: Budgets are guided by concrete reliability commitments rather than guesswork.
* Risk management: When outages burn error budget, prioritize reliability work until the error budget is replenished.
 SLOs are business commitments. Use them to transparently decide where to invest: if an outage causes you to burn error budget, that’s a clear signal to prioritize reliability work over feature development until the error budget is replenished.
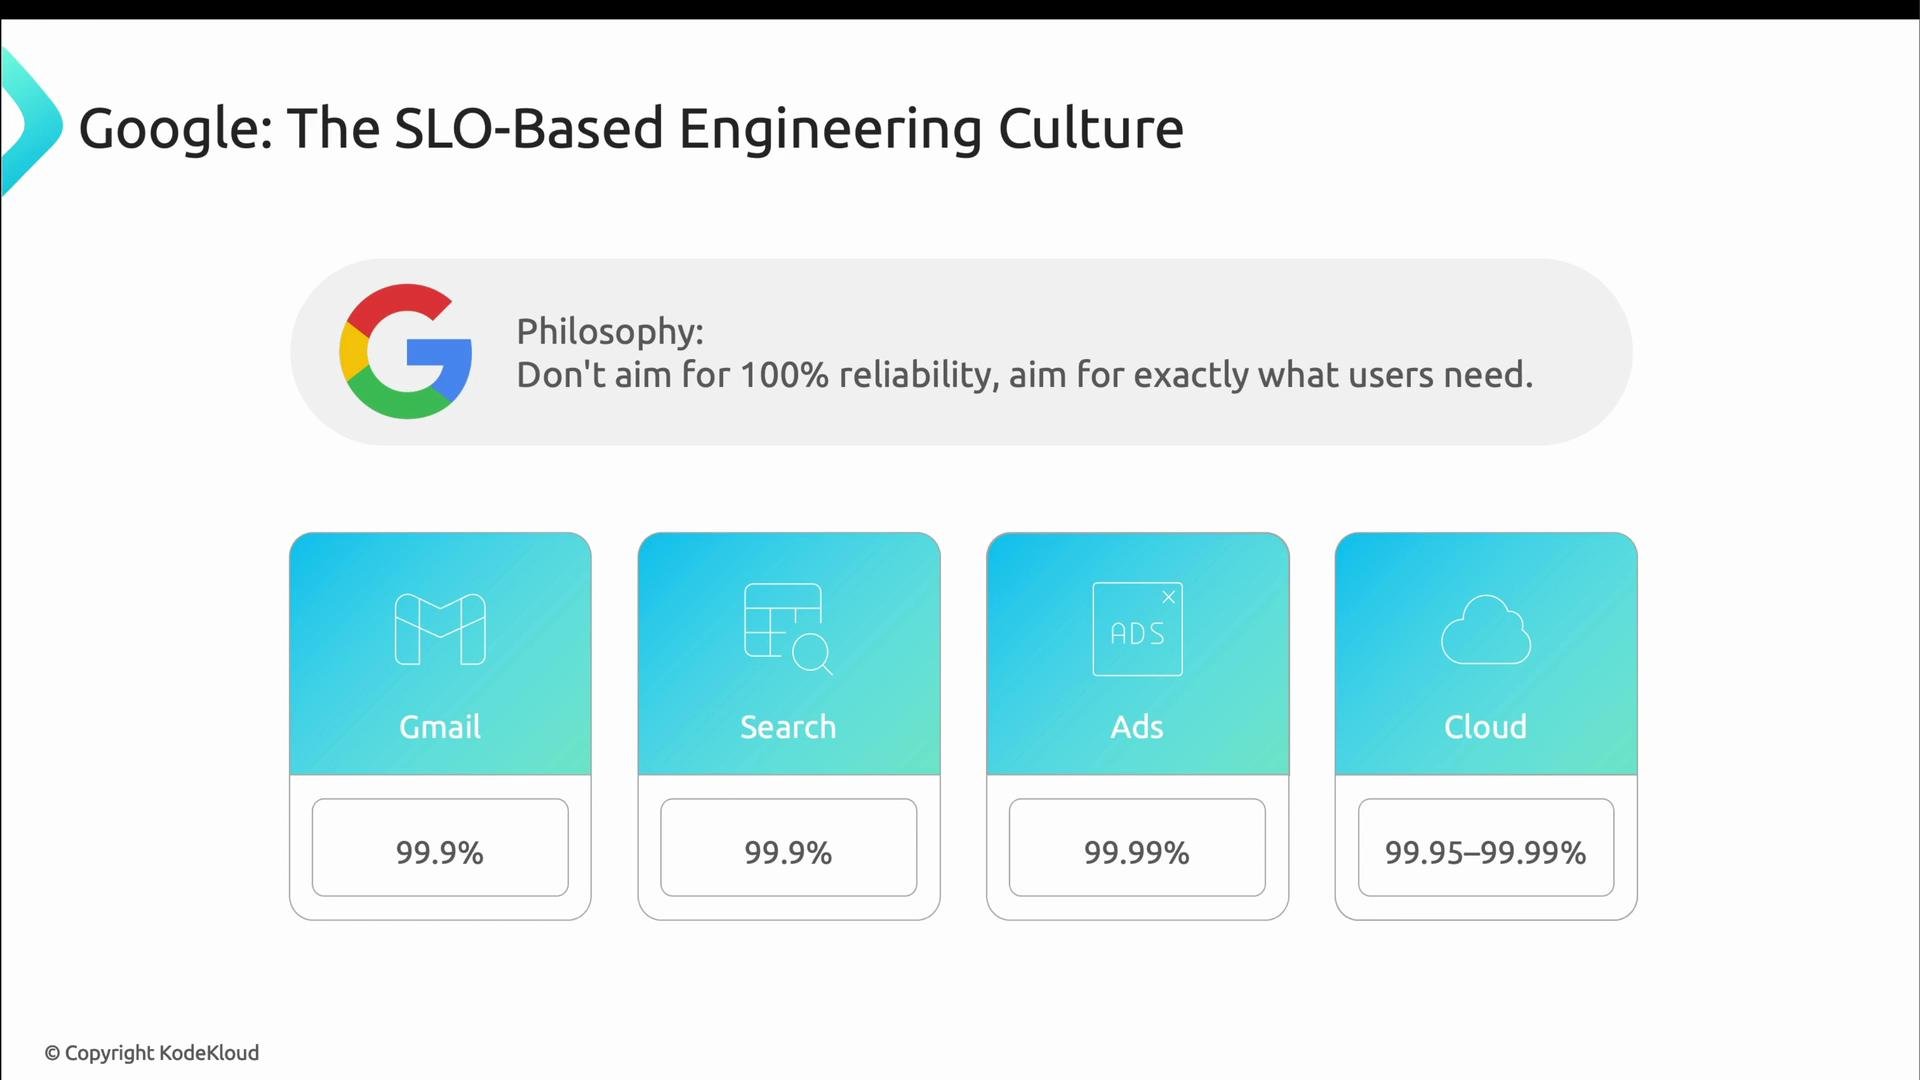
Google’s SLO-based engineering culture captures this approach: don’t chase 100% reliability — it’s impractical and disproportionately expensive. Instead, set SLOs that match user needs and allocate engineering effort accordingly. Examples from Google:
* Gmail and Search: \~99.9% (users tolerate brief delays)
* Google Ads: \~99.99% (downtime directly impacts revenue)
* Google Cloud Services: 99.95%–99.99% depending on SLAs
SLOs are business commitments. Use them to transparently decide where to invest: if an outage causes you to burn error budget, that’s a clear signal to prioritize reliability work over feature development until the error budget is replenished.
Google’s SLO-based engineering culture captures this approach: don’t chase 100% reliability — it’s impractical and disproportionately expensive. Instead, set SLOs that match user needs and allocate engineering effort accordingly. Examples from Google:
* Gmail and Search: \~99.9% (users tolerate brief delays)
* Google Ads: \~99.99% (downtime directly impacts revenue)
* Google Cloud Services: 99.95%–99.99% depending on SLAs
 Summary
* Reliability cost grows nonlinearly as targets tighten; every extra “9” usually requires materially more investment.
* Use autoscaling, graceful degradation, and mixed instance strategies to make reliability cost-effective.
* Tie budget to SLOs: the error budget should guide when to prioritize reliability work over feature development.
* Align SLOs to business context and customer tiers so spending matches value delivered.
Further reading and references
* Kubernetes Horizontal Pod Autoscaler: [https://kubernetes.io/docs/tasks/run-application/horizontal-pod-autoscale/](https://kubernetes.io/docs/tasks/run-application/horizontal-pod-autoscale/)
* Google SRE and SLO culture: [https://sre.google/](https://sre.google/)
* Kubernetes autoscaling overview and best practices (additional guides): [https://kubernetes.io/docs/concepts/cluster-administration/autoscaling/](https://kubernetes.io/docs/concepts/cluster-administration/autoscaling/)
This article covered advanced reliability engineering topics: the cost of reliability, autoscaling strategies, graceful degradation, instance purchasing strategies, and SLO-based budgeting. These practices may not all apply early in your career, but keeping them on your radar will make you a stronger SRE as you take on larger systems and higher-stakes reliability targets.
Summary
* Reliability cost grows nonlinearly as targets tighten; every extra “9” usually requires materially more investment.
* Use autoscaling, graceful degradation, and mixed instance strategies to make reliability cost-effective.
* Tie budget to SLOs: the error budget should guide when to prioritize reliability work over feature development.
* Align SLOs to business context and customer tiers so spending matches value delivered.
Further reading and references
* Kubernetes Horizontal Pod Autoscaler: [https://kubernetes.io/docs/tasks/run-application/horizontal-pod-autoscale/](https://kubernetes.io/docs/tasks/run-application/horizontal-pod-autoscale/)
* Google SRE and SLO culture: [https://sre.google/](https://sre.google/)
* Kubernetes autoscaling overview and best practices (additional guides): [https://kubernetes.io/docs/concepts/cluster-administration/autoscaling/](https://kubernetes.io/docs/concepts/cluster-administration/autoscaling/)
This article covered advanced reliability engineering topics: the cost of reliability, autoscaling strategies, graceful degradation, instance purchasing strategies, and SLO-based budgeting. These practices may not all apply early in your career, but keeping them on your radar will make you a stronger SRE as you take on larger systems and higher-stakes reliability targets.