> ## Documentation Index
> Fetch the complete documentation index at: https://notes.kodekloud.com/llms.txt
> Use this file to discover all available pages before exploring further.
# SLO Development and Strategy
> Guides creating and operationalizing service level objectives by mapping user journeys to SLIs, setting data driven SLO targets, using error budgets, and reviewing trade offs between reliability and cost.
Welcome to the lesson on developing service-level objectives (SLOs) and the strategies that make them practical tools for reliability engineering.
By the end of this lesson you'll understand how SLOs link user expectations to engineering reality, and why they are the foundation of measurable reliability.
Why can't we promise 100% uptime? And why do SLOs matter?
At real-world scale, 100% uptime is infeasible. Trying to guarantee it leads to unsustainable costs, brittle systems, and slow innovation. SLOs help teams balance reliability, cost, and speed by defining realistic, measurable targets.
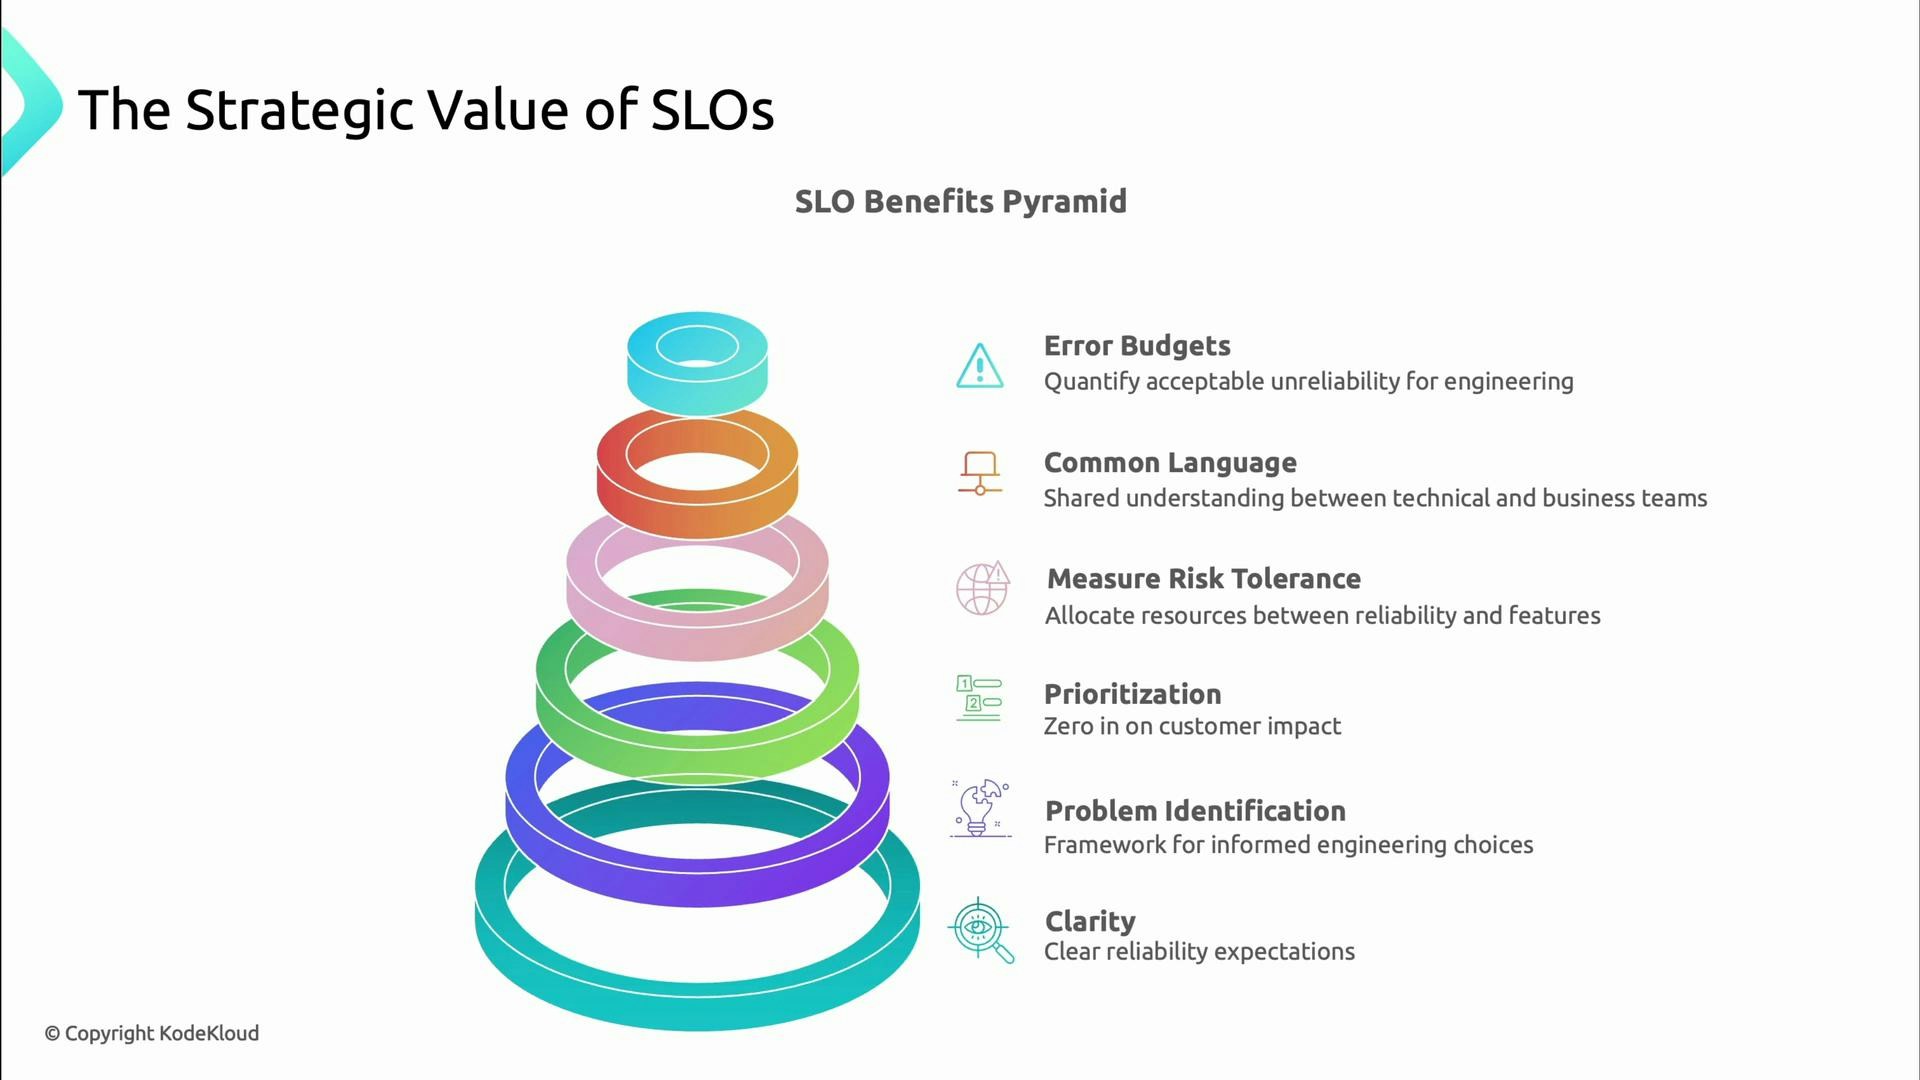
SLOs are far more than just target numbers. Well-crafted SLOs:
* Quantify acceptable unreliability (error budgets).
* Create a shared language across engineering and business stakeholders.
* Prioritize engineering effort and operational investment according to business risk.
* Surface the incidents that matter most to users.
* Make reliability visible, measurable, and actionable across the organization.
 Start with the customer: what do users actually care about?
Map critical user journeys, convert the steps into measurable service-level indicators (SLIs), and set SLO targets that meet business goals while leaving room to evolve the service. SRE and reliability teams translate customer needs into engineering priorities — and user satisfaction is the metric that determines success.
When converting business goals into SLOs, ask:
* Which user journeys are critical?
* What does “good enough” look like for those journeys (latency, availability, correctness)?
* What trade-offs between cost and reliability are acceptable?
A structured business impact analysis helps justify SLO trade-offs.
Start with the customer: what do users actually care about?
Map critical user journeys, convert the steps into measurable service-level indicators (SLIs), and set SLO targets that meet business goals while leaving room to evolve the service. SRE and reliability teams translate customer needs into engineering priorities — and user satisfaction is the metric that determines success.
When converting business goals into SLOs, ask:
* Which user journeys are critical?
* What does “good enough” look like for those journeys (latency, availability, correctness)?
* What trade-offs between cost and reliability are acceptable?
A structured business impact analysis helps justify SLO trade-offs.
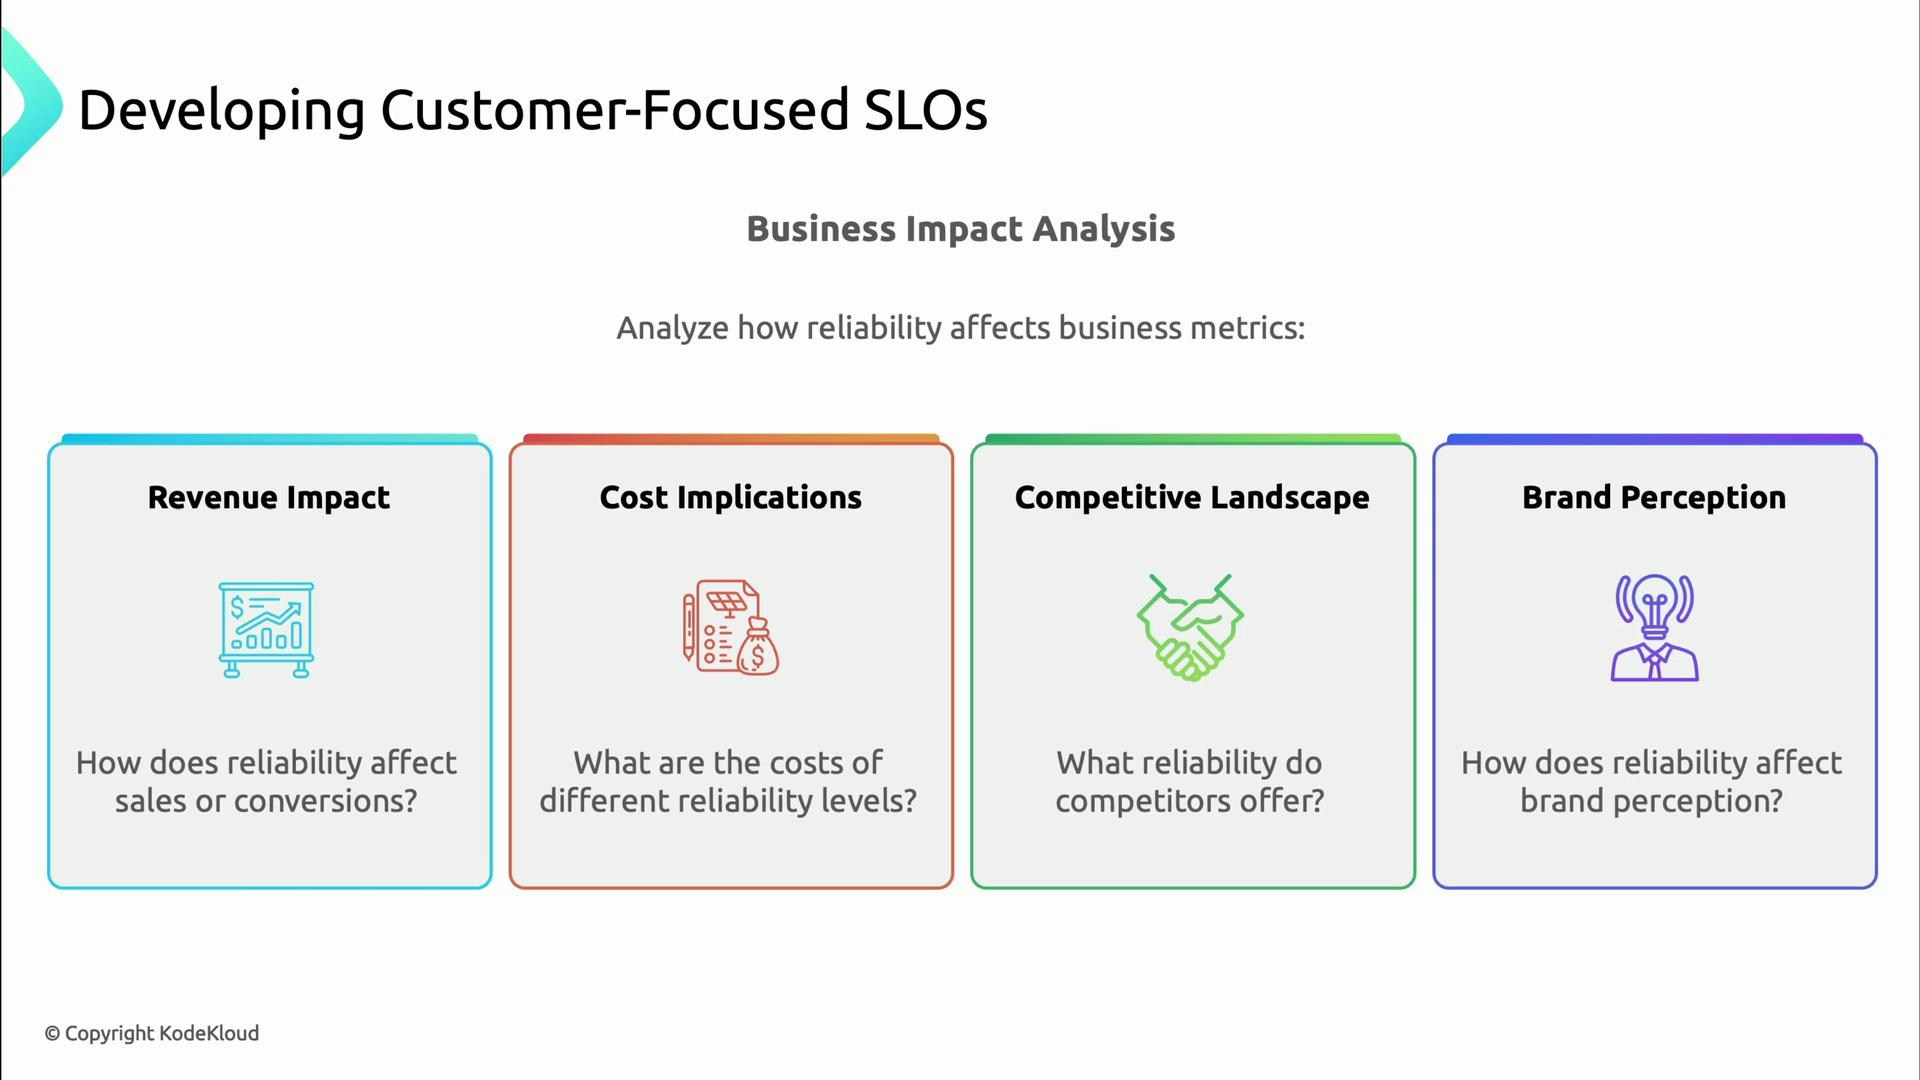 Consider these business dimensions when setting SLOs:
* Revenue: how do downtime and slow responses affect conversions and sales?
* Costs: what operational or engineering investments are required at each reliability level?
* Competitive position: what reliability levels do competitors promise?
* Brand perception: how does reliability affect trust and retention?
Compare cost vs. business benefit before chasing higher availability targets.
Consider these business dimensions when setting SLOs:
* Revenue: how do downtime and slow responses affect conversions and sales?
* Costs: what operational or engineering investments are required at each reliability level?
* Competitive position: what reliability levels do competitors promise?
* Brand perception: how does reliability affect trust and retention?
Compare cost vs. business benefit before chasing higher availability targets.
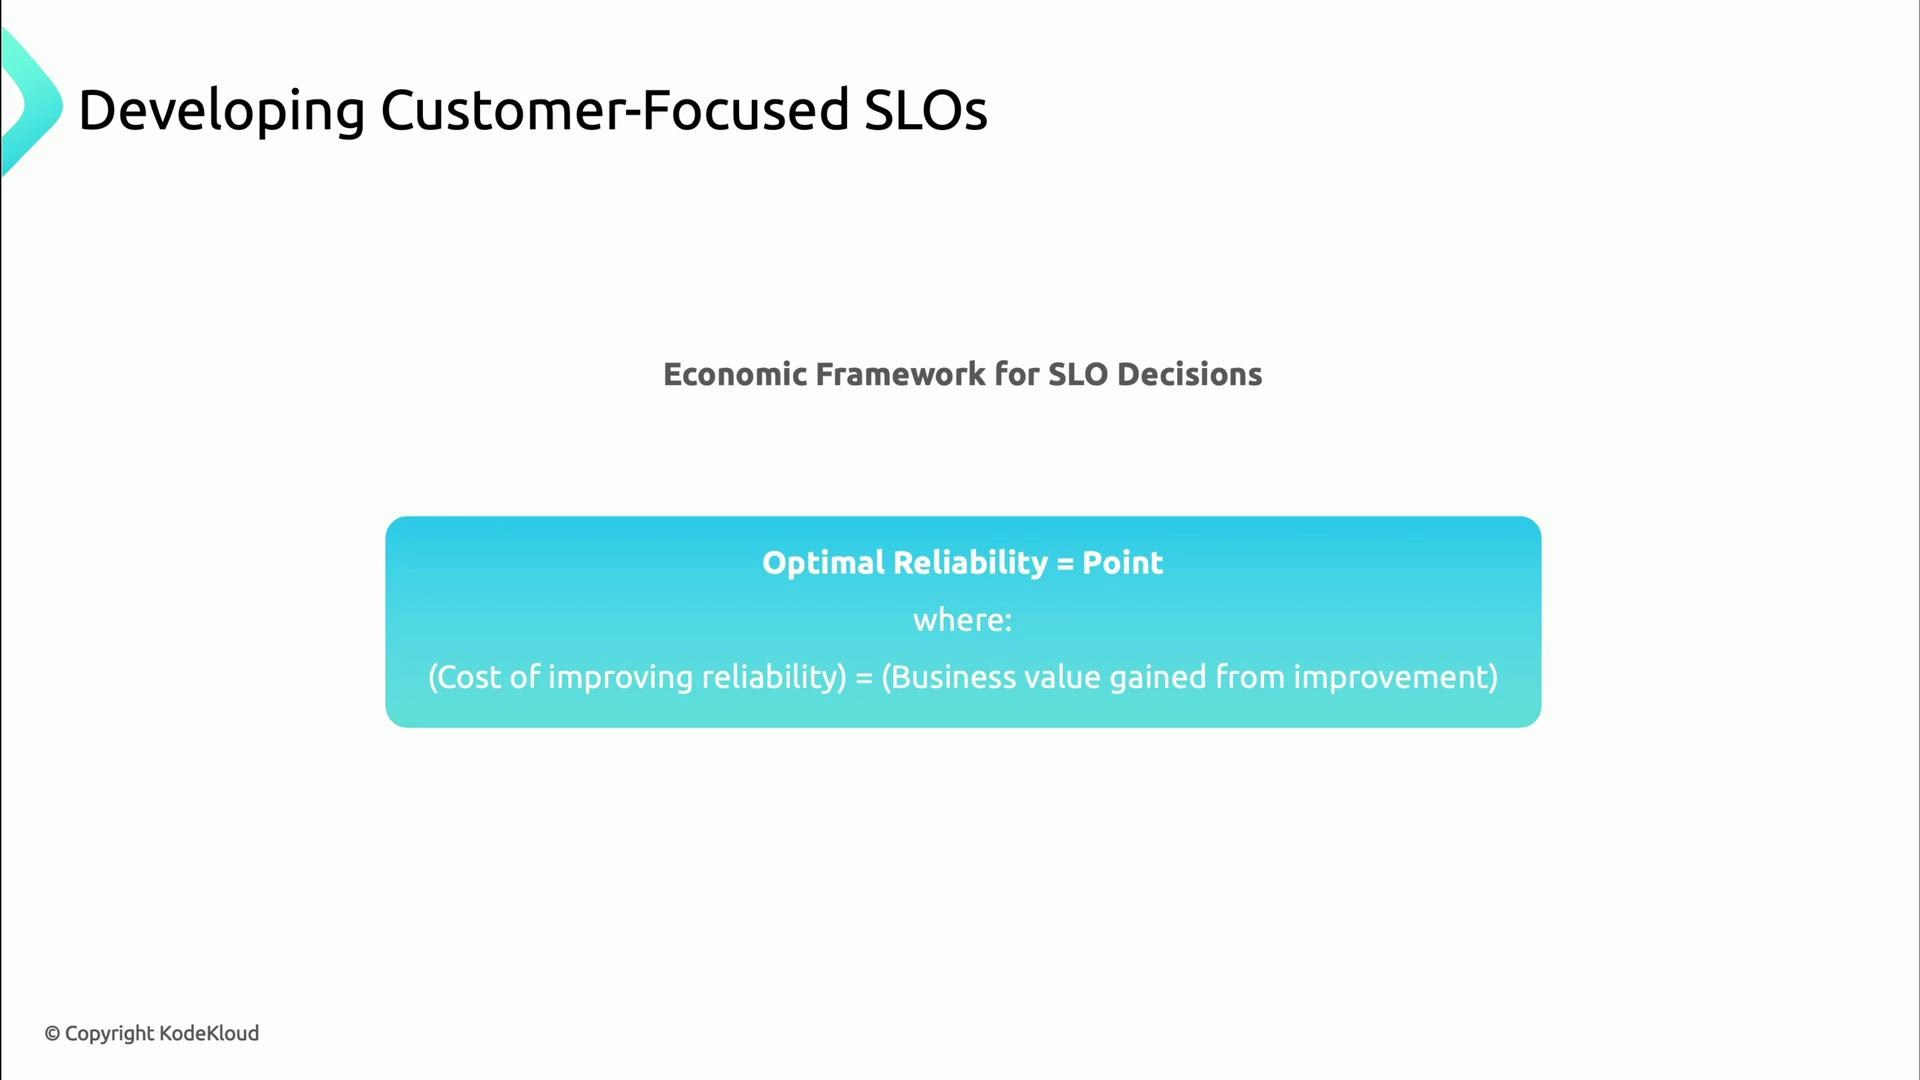
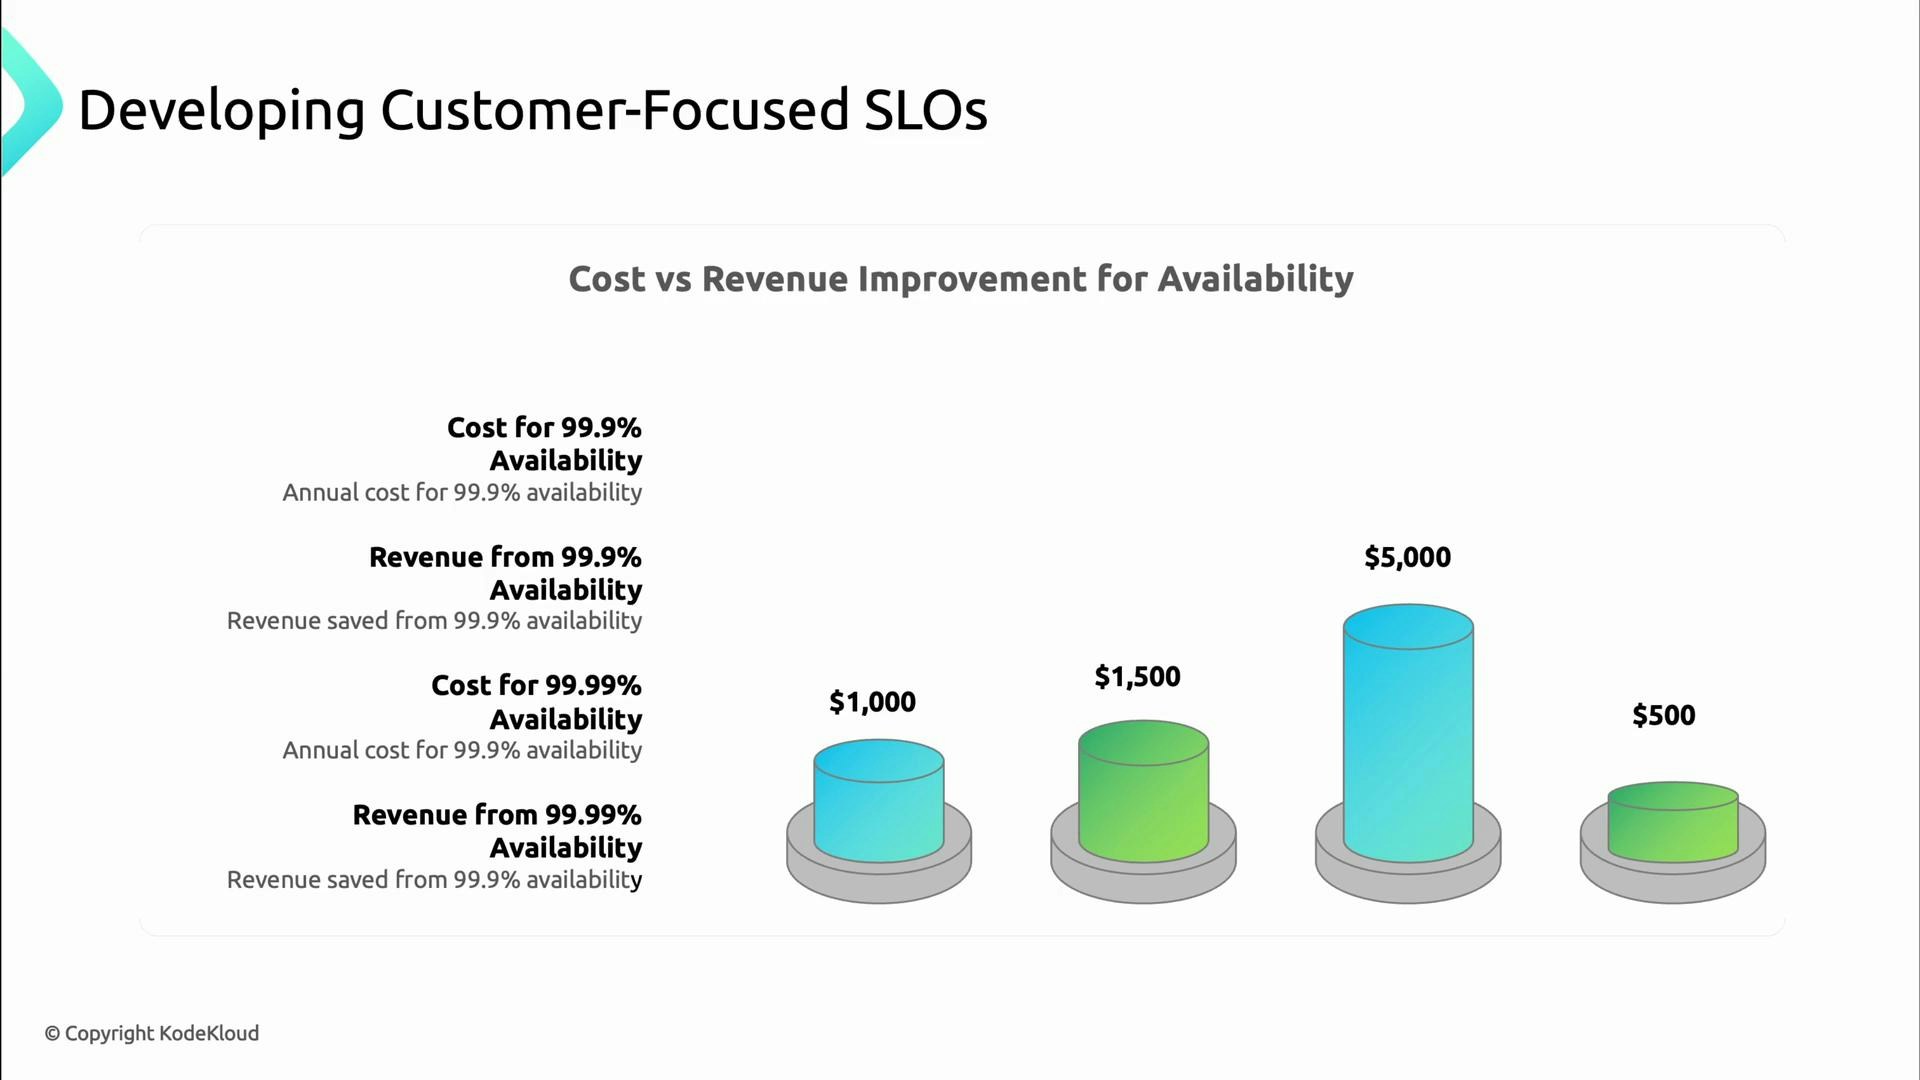 The general pattern is that each additional “nine” of availability typically costs more (often exponentially) while customer or revenue benefit increases more slowly. Your goal is the economic optimum: the point where the cost to improve reliability further equals the business value gained.
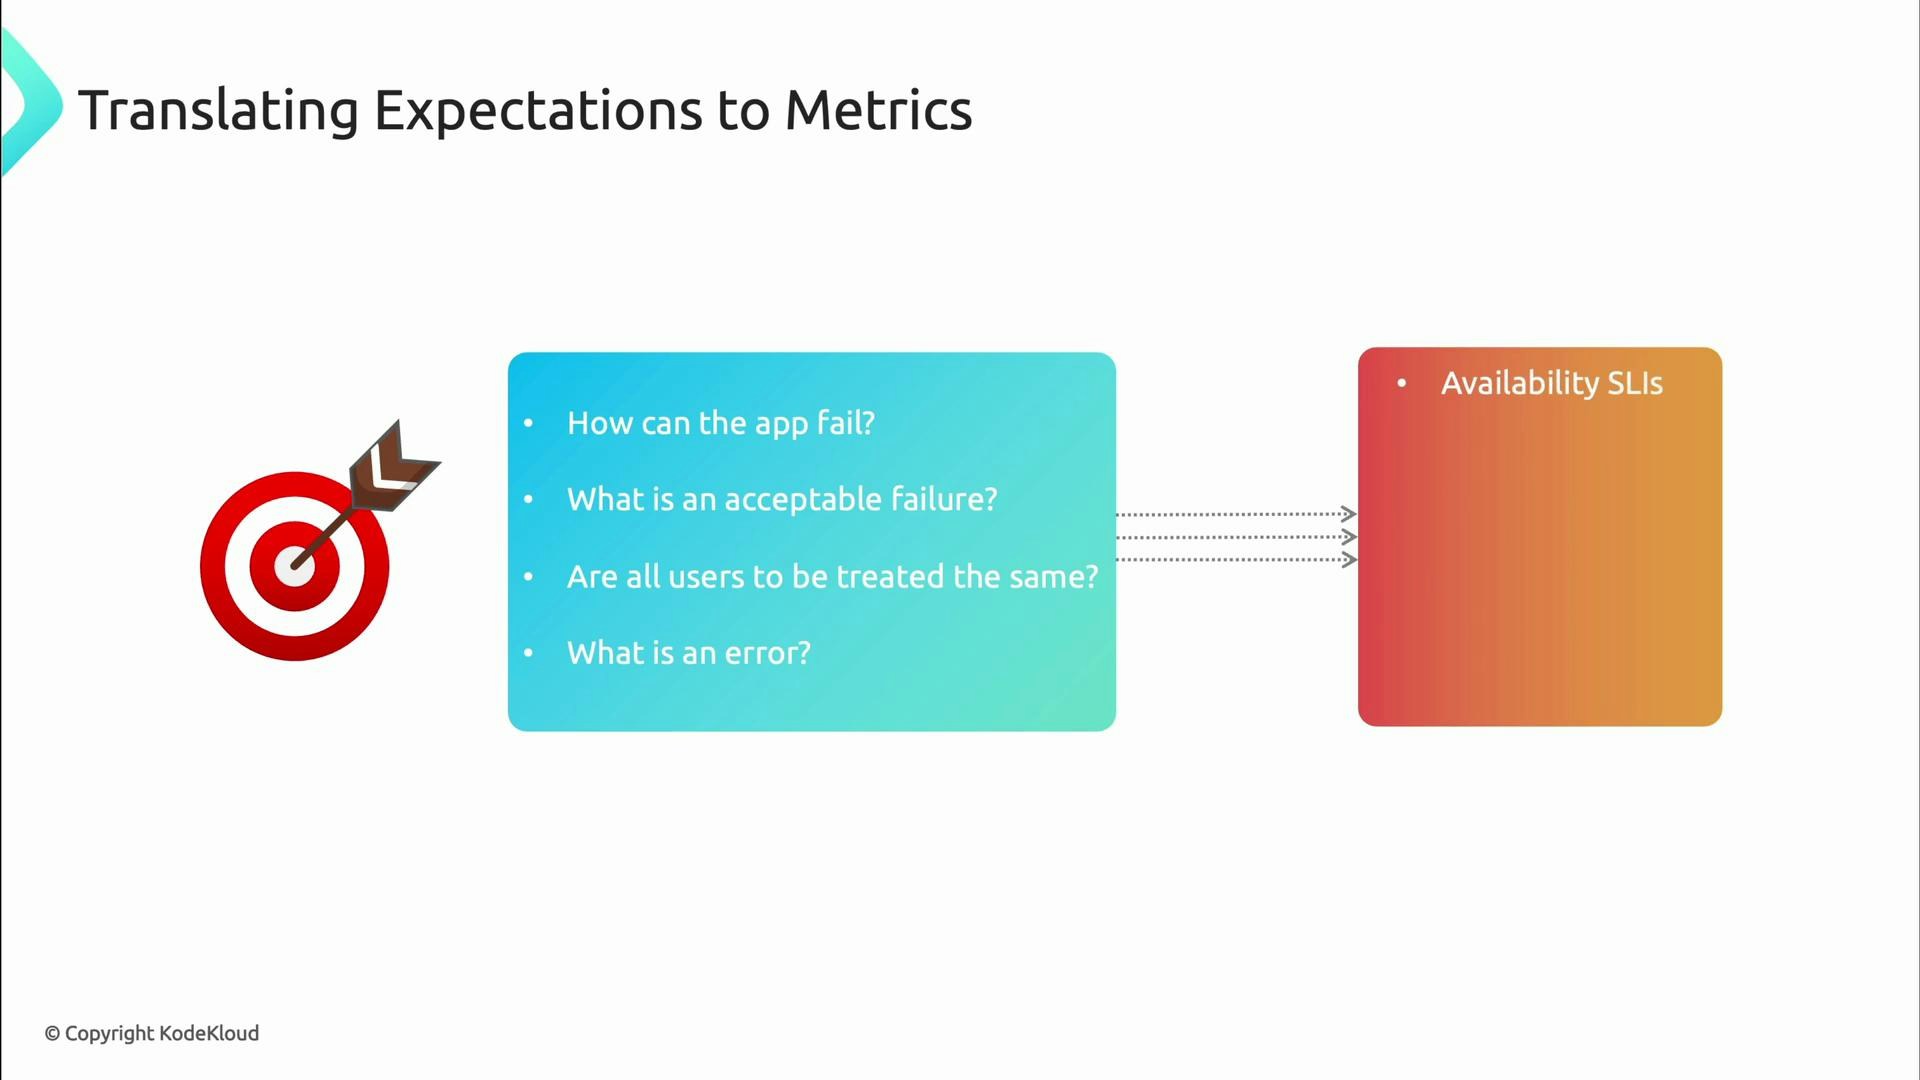
 Translate user needs into technical metrics
For each user journey, enumerate failure modes and acceptable outcomes:
* How can this app fail?
* Which failures are acceptable for the user experience?
* Are different user segments treated differently?
* What counts as an error?
Then choose appropriate SLI types — availability, latency, quality, throughput, durability — and define precise measurement methods.
Translate user needs into technical metrics
For each user journey, enumerate failure modes and acceptable outcomes:
* How can this app fail?
* Which failures are acceptable for the user experience?
* Are different user segments treated differently?
* What counts as an error?
Then choose appropriate SLI types — availability, latency, quality, throughput, durability — and define precise measurement methods.
 Common SLI types and examples
| SLI Type | What it measures | Example |
| --------------------: | ----------------------------------- | ---------------------------------------- |
| Availability | Fraction of successful requests | `probe_success{endpoint="/health"}` |
| Latency | Response-time distribution | 95th/99th percentile of request duration |
| Quality / Correctness | Whether responses are correct | Rate of valid responses vs errors |
| Throughput | Requests or transactions per second | `requests_total` per minute |
| Durability | Data persisted without loss | Backup success rate, replication lag |
Map SLI measurements to SLO statements that are understandable by product and business teams.
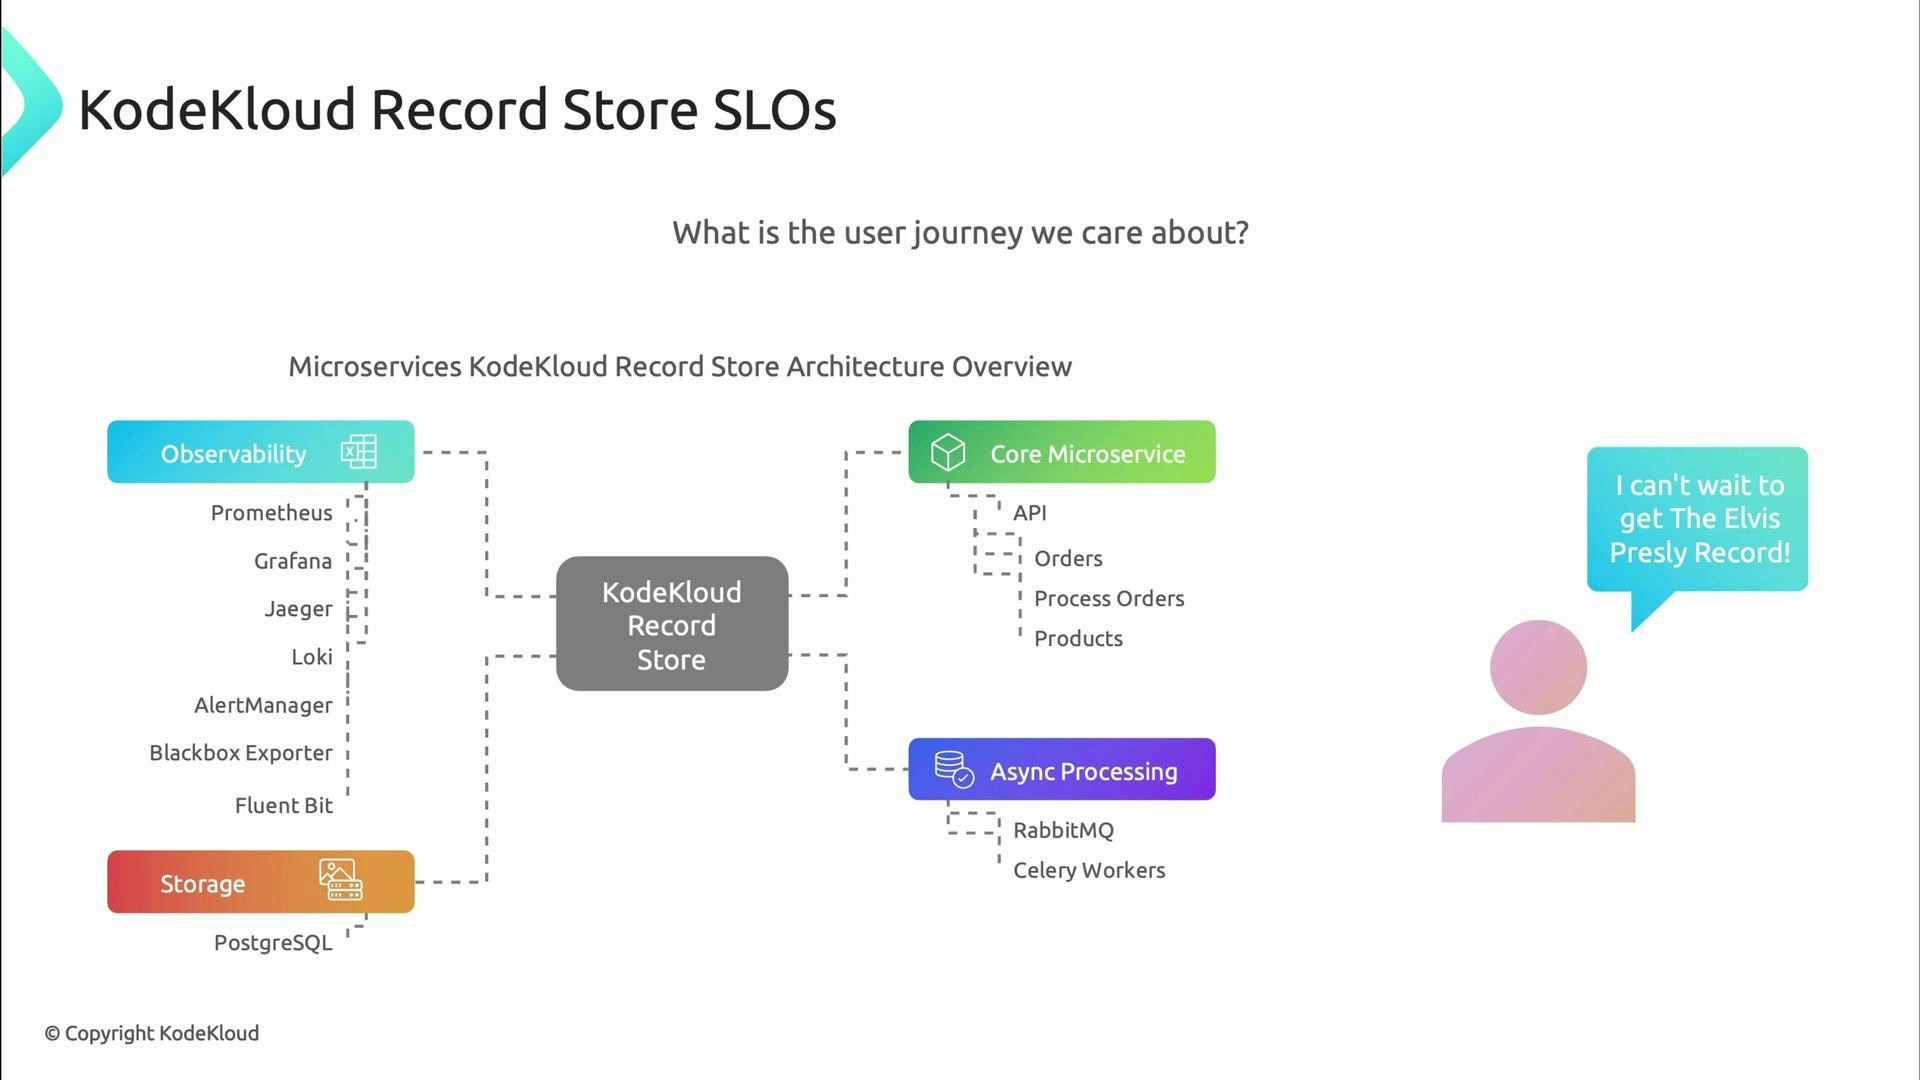
Example: KodeKloud record store (search and orders)
Common SLI types and examples
| SLI Type | What it measures | Example |
| --------------------: | ----------------------------------- | ---------------------------------------- |
| Availability | Fraction of successful requests | `probe_success{endpoint="/health"}` |
| Latency | Response-time distribution | 95th/99th percentile of request duration |
| Quality / Correctness | Whether responses are correct | Rate of valid responses vs errors |
| Throughput | Requests or transactions per second | `requests_total` per minute |
| Durability | Data persisted without loss | Backup success rate, replication lag |
Map SLI measurements to SLO statements that are understandable by product and business teams.
Example: KodeKloud record store (search and orders)
 Search experience: users expect quick, reliable search results.
A simple Prometheus expression to measure a probe-success availability SLI over one day:
```promql theme={null}
avg_over_time(probe_success{endpoint="/health"}[1d])
```
If that query evaluates to 0.999, it indicates 99.9% availability over the last 24 hours.
Example SLOs for the search journey:
* Availability SLO: 99.9% of API requests succeed (catalog API).
* Latency SLO: 99% of search queries complete within 300 ms.
Why 300 ms and 99%? Research on perceived latency shows users notice delays above \~300 ms; 99% is often achievable without extreme cost while protecting the vast majority of users.
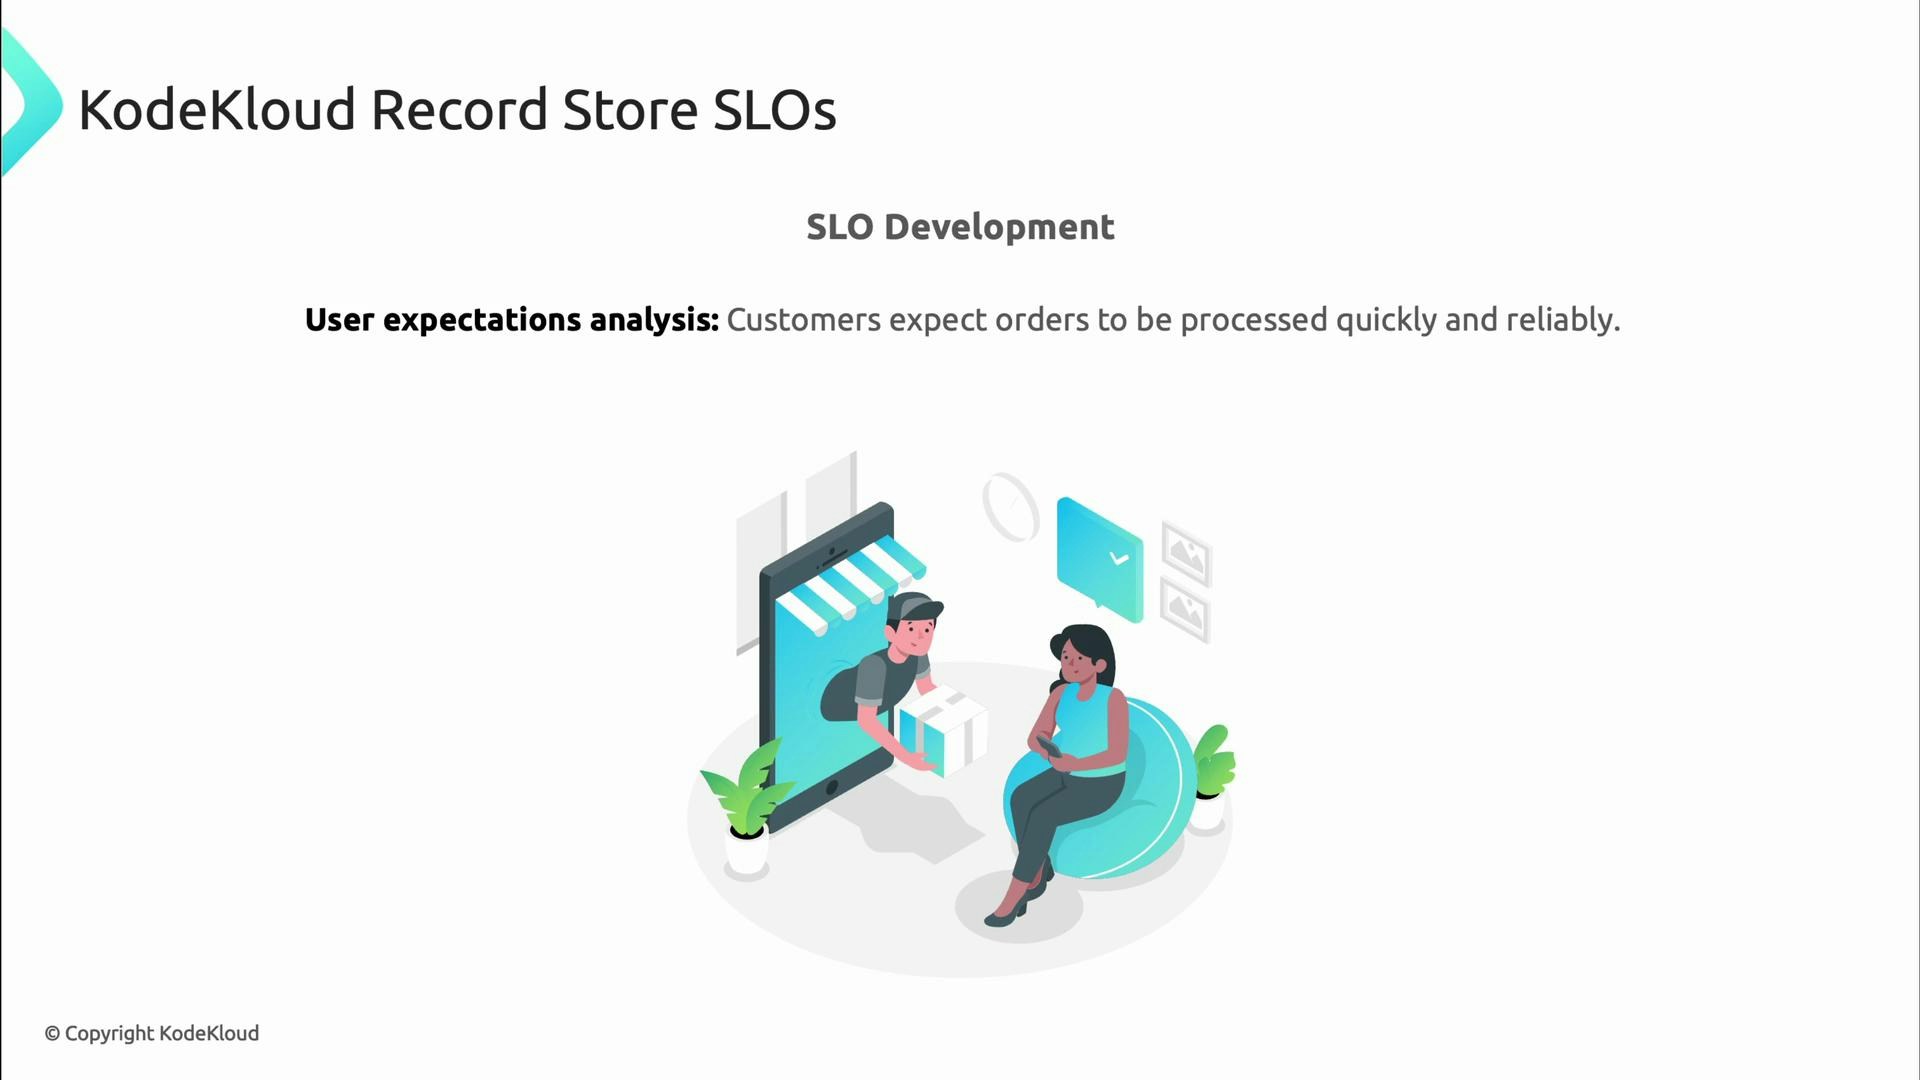
Order-processing journey: placing and processing an order must be reliable and timely.
A Prometheus expression to compute error rate for the orders endpoint:
```promql theme={null}
sum(rate(http_requests_total{endpoint="/orders", status_code!~"2.."}[5m])) /
sum(rate(http_requests_total{endpoint="/orders"}[5m]))
```
This calculates the fraction of non-2xx responses over the last 5 minutes.
Suggested SLIs and SLOs for orders:
* SLIs: processing success rate, end-to-end order processing latency.
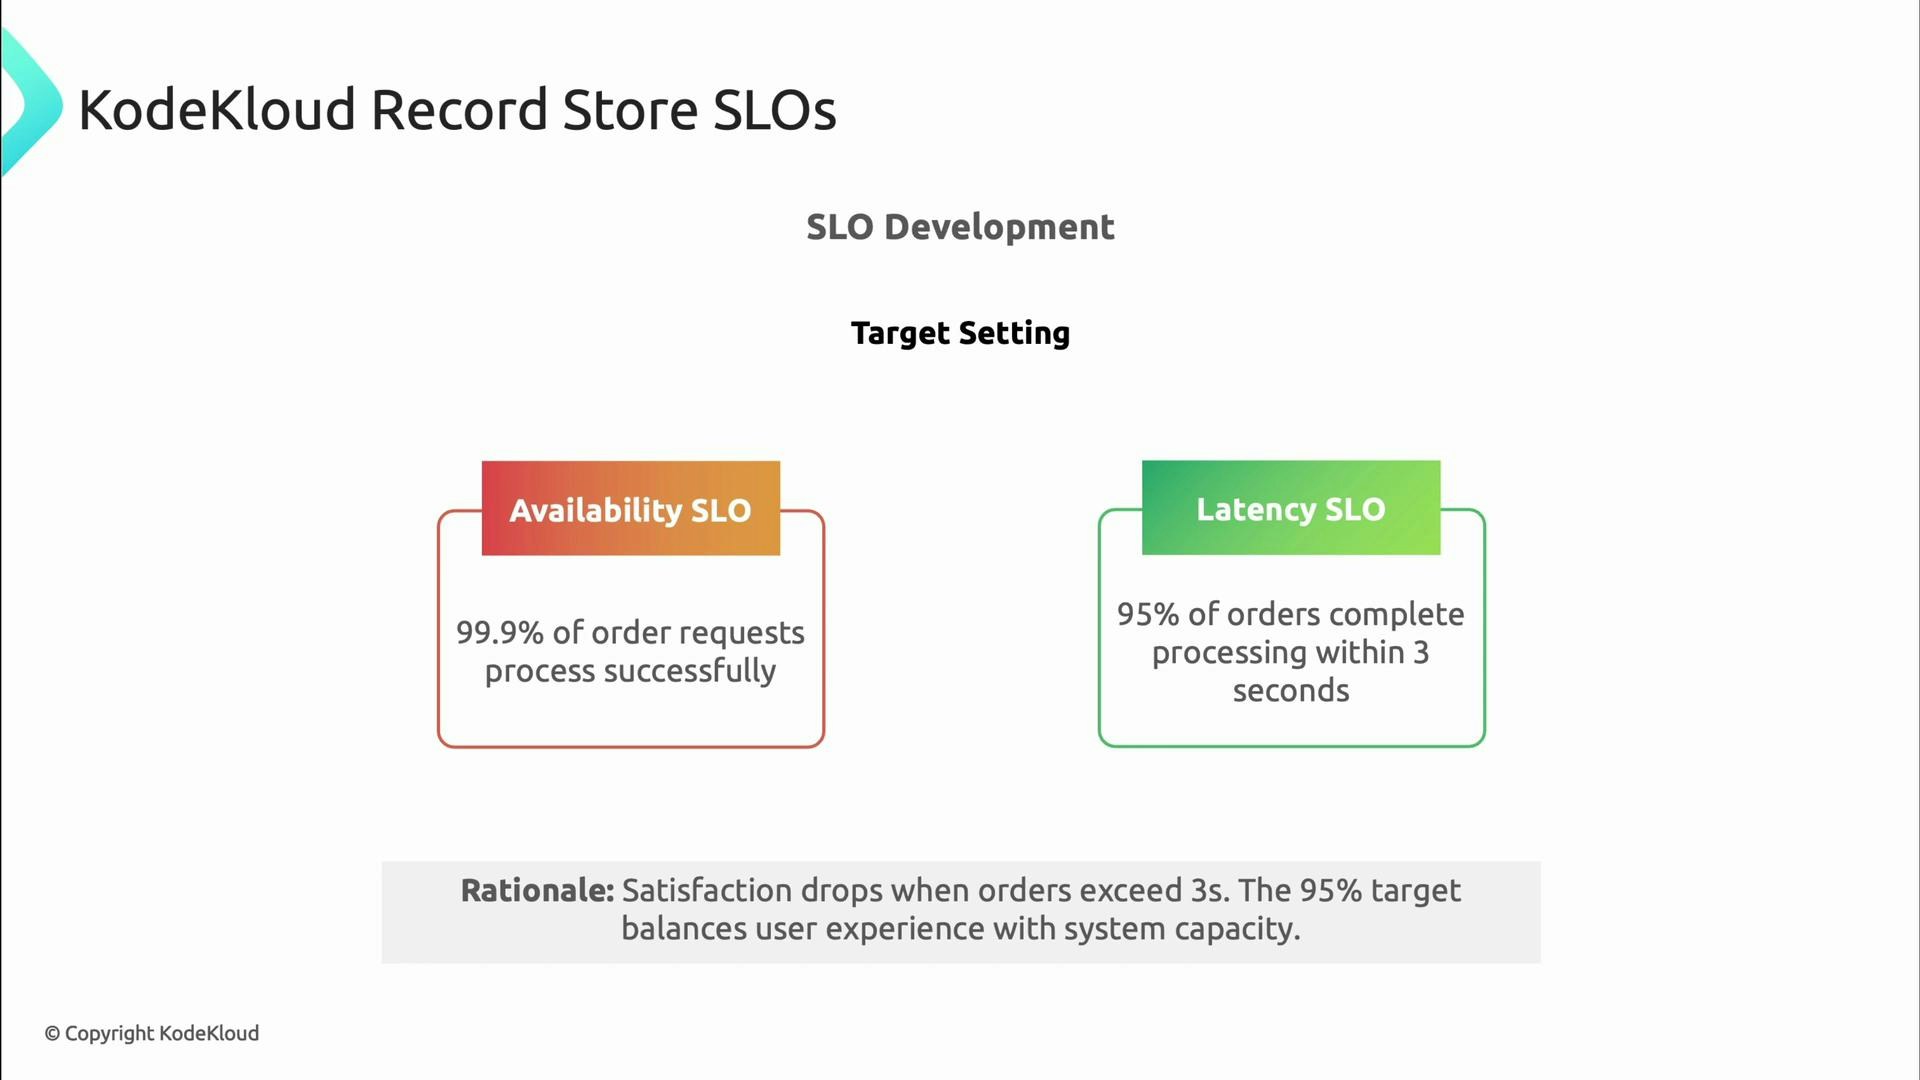
* SLO (availability/orders): 99.9% of order requests process successfully.
* SLO (latency/orders): 95% of orders complete processing within 3 seconds.
We selected the 3-second, 95th-percentile target because customer satisfaction declines sharply after that threshold and it aligns with current system capacity.
Search experience: users expect quick, reliable search results.
A simple Prometheus expression to measure a probe-success availability SLI over one day:
```promql theme={null}
avg_over_time(probe_success{endpoint="/health"}[1d])
```
If that query evaluates to 0.999, it indicates 99.9% availability over the last 24 hours.
Example SLOs for the search journey:
* Availability SLO: 99.9% of API requests succeed (catalog API).
* Latency SLO: 99% of search queries complete within 300 ms.
Why 300 ms and 99%? Research on perceived latency shows users notice delays above \~300 ms; 99% is often achievable without extreme cost while protecting the vast majority of users.
Order-processing journey: placing and processing an order must be reliable and timely.
A Prometheus expression to compute error rate for the orders endpoint:
```promql theme={null}
sum(rate(http_requests_total{endpoint="/orders", status_code!~"2.."}[5m])) /
sum(rate(http_requests_total{endpoint="/orders"}[5m]))
```
This calculates the fraction of non-2xx responses over the last 5 minutes.
Suggested SLIs and SLOs for orders:
* SLIs: processing success rate, end-to-end order processing latency.
* SLO (availability/orders): 99.9% of order requests process successfully.
* SLO (latency/orders): 95% of orders complete processing within 3 seconds.
We selected the 3-second, 95th-percentile target because customer satisfaction declines sharply after that threshold and it aligns with current system capacity.
 Use historical data, not guesswork
Wherever possible, derive SLO targets from historical telemetry. Historical SLIs give you realistic baselines and show what is achievable without major investment. Always document the rationale for each SLO: why it was chosen, the assumptions, the data used, and expected limitations.
Always record the rationale and assumptions for every SLO. This documentation enables future teams to understand why targets were chosen and how to adjust them over time.
Make SLOs a living process
Establish a regular SLO review cadence and a clear escalation path:
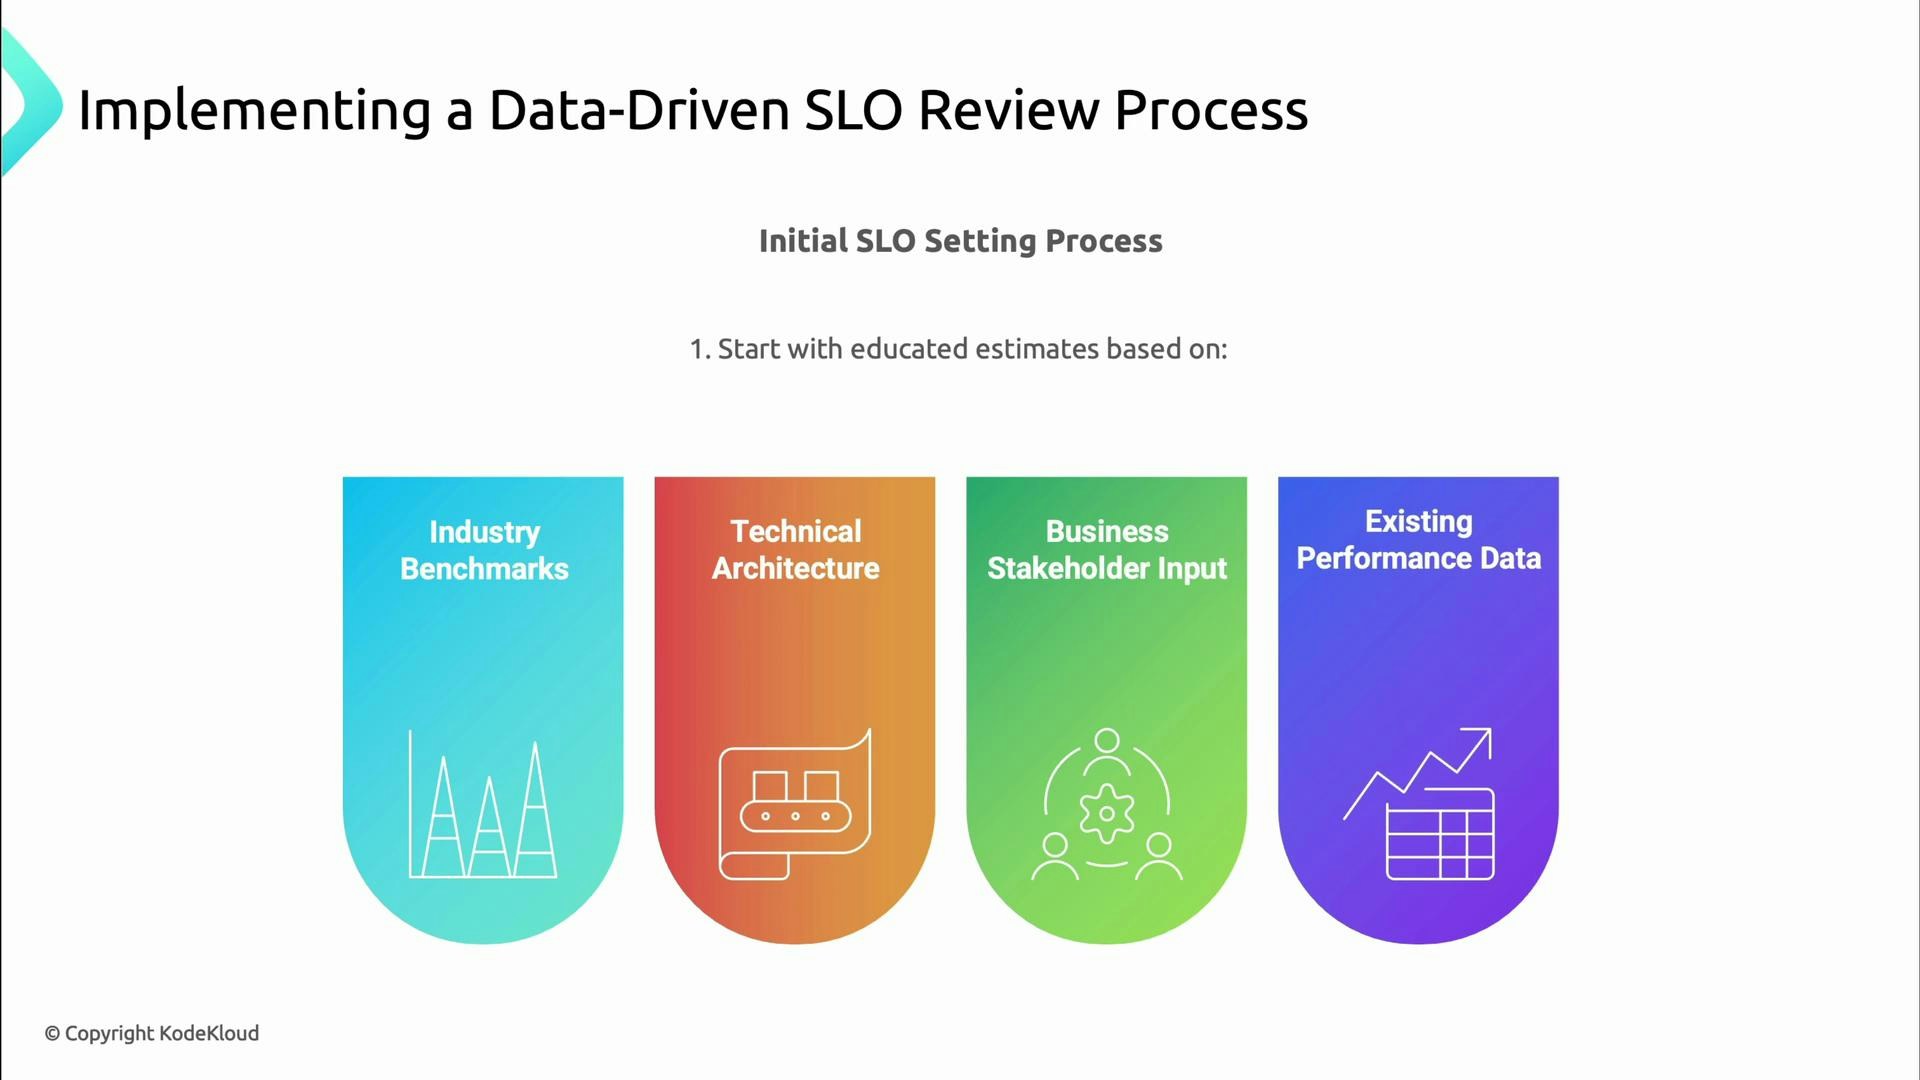
* Start with data-driven, educated estimates (benchmarks, architecture, stakeholder input).
* Record assumptions and measurement methods.
* Analyze actual performance during reviews: SLO adherence, trends, and patterns.
* Combine quantitative metrics with qualitative feedback (customer surveys, stakeholder concerns).
* Reassess business risk and operational cost (alert noise, toil).
* Adjust SLOs and error-budget policies based on evidence.
Use historical data, not guesswork
Wherever possible, derive SLO targets from historical telemetry. Historical SLIs give you realistic baselines and show what is achievable without major investment. Always document the rationale for each SLO: why it was chosen, the assumptions, the data used, and expected limitations.
Always record the rationale and assumptions for every SLO. This documentation enables future teams to understand why targets were chosen and how to adjust them over time.
Make SLOs a living process
Establish a regular SLO review cadence and a clear escalation path:
* Start with data-driven, educated estimates (benchmarks, architecture, stakeholder input).
* Record assumptions and measurement methods.
* Analyze actual performance during reviews: SLO adherence, trends, and patterns.
* Combine quantitative metrics with qualitative feedback (customer surveys, stakeholder concerns).
* Reassess business risk and operational cost (alert noise, toil).
* Adjust SLOs and error-budget policies based on evidence.
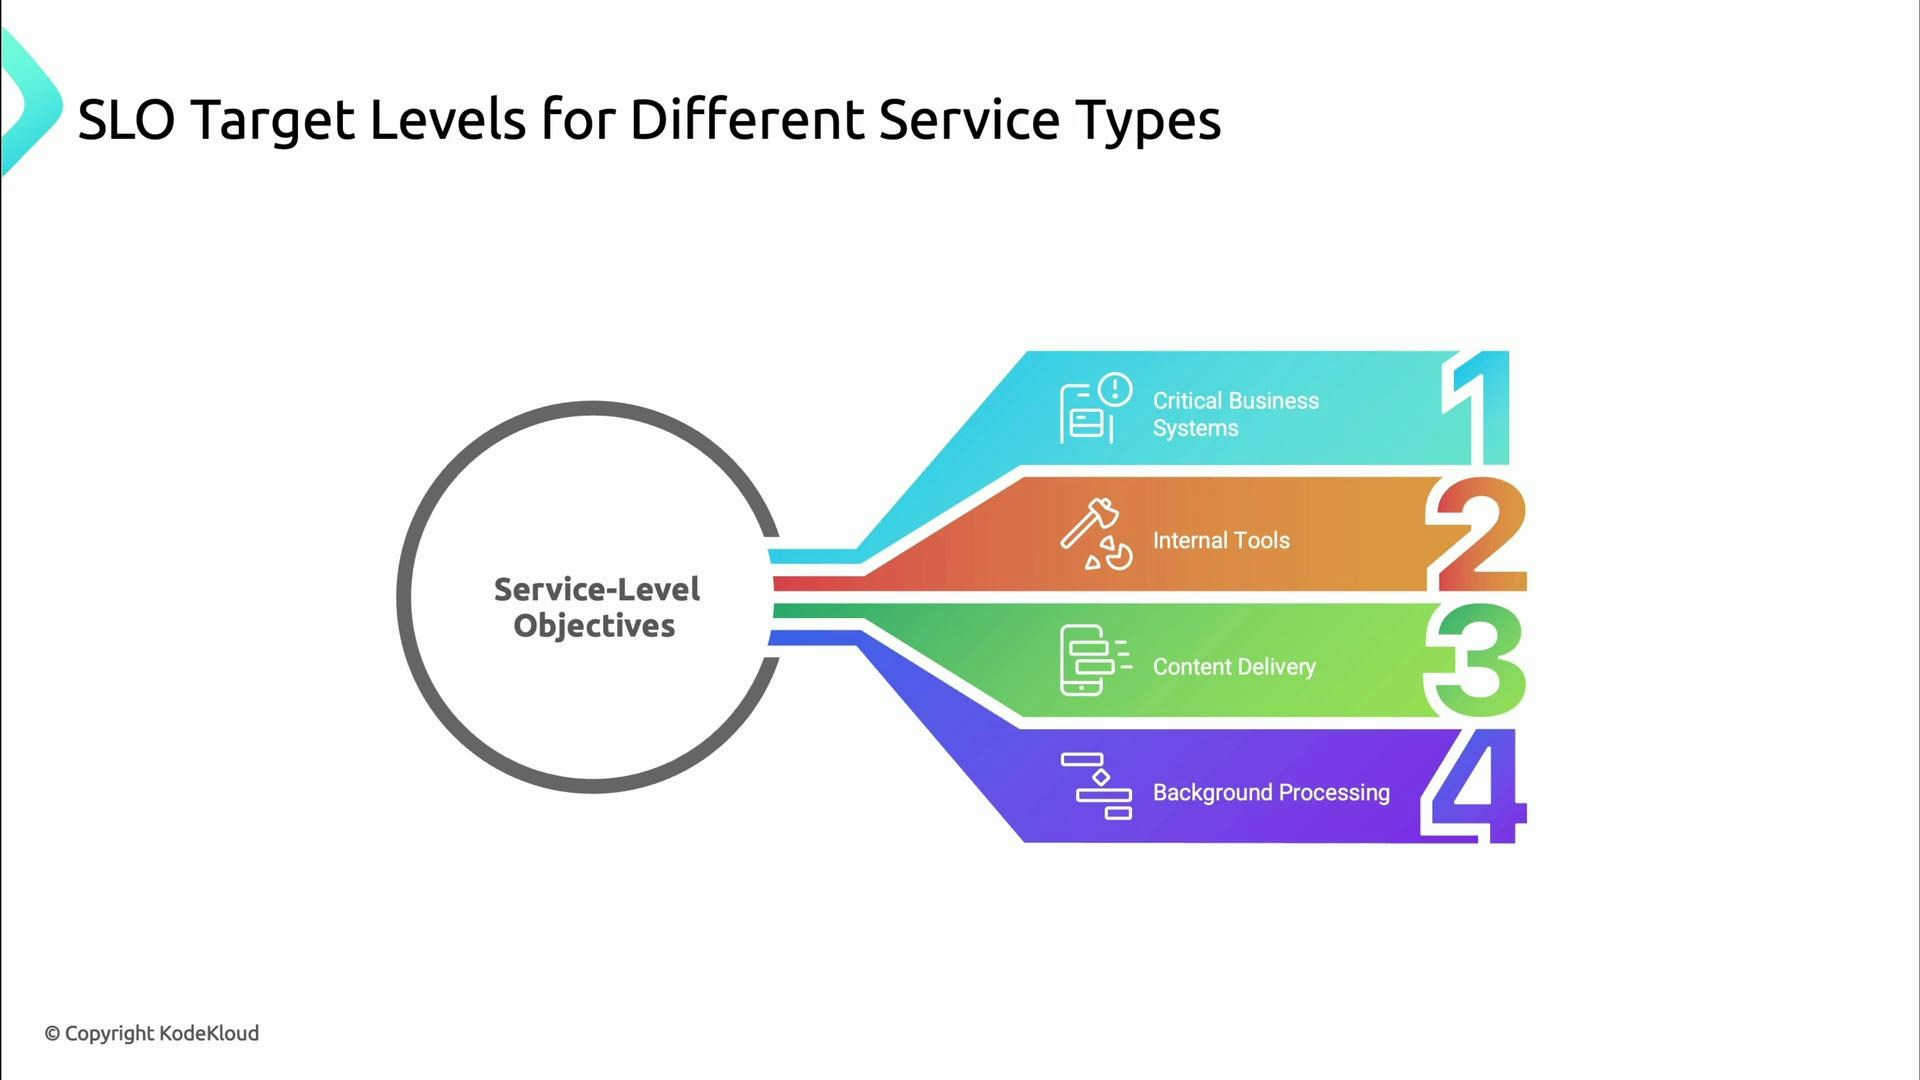
 Not all services require the same SLO tightness. Align SLO strictness with business criticality:
* Critical customer-facing systems (payments, authentication): very strict SLOs (e.g., 99.99%).
* Content delivery and public APIs: high availability but tuned to cost-impact.
* Internal tools and background jobs: more lenient SLOs, optimized for cost and throughput.
Not all services require the same SLO tightness. Align SLO strictness with business criticality:
* Critical customer-facing systems (payments, authentication): very strict SLOs (e.g., 99.99%).
* Content delivery and public APIs: high availability but tuned to cost-impact.
* Internal tools and background jobs: more lenient SLOs, optimized for cost and throughput.
 Operationalize SLOs with error budgets
Error budgets translate SLOs into governance and operational policy. They enable teams to make explicit decisions about whether to prioritize feature velocity or reliability:
* If the error budget is healthy, teams can safely ship features and experiments.
* If the error budget is depleted, the team focuses on reliability work until the budget is replenished.
Use dashboards and automated checks to track SLO consumption, and define clear runbooks for error-budget breaches (e.g., reduce rollouts, increase QA, emergency fixes).
Summary checklist for SLO development
* Identify critical user journeys.
* Define SLIs with precise measurement methods.
* Set SLOs based on business impact and historical data.
* Document rationale, assumptions, and measurement details.
* Implement monitoring, dashboards, and alerting tied to SLOs and error budgets.
* Review and iterate SLOs regularly with business stakeholders.
Links and references
* [Google SRE Book — Service Level Objectives](https://sre.google/sre-book/service-level-objectives/)
* [Prometheus — Monitoring system & time series database](https://prometheus.io/)
* [Site Reliability Engineering (SRE) — Principles and Practices](https://landing.google.com/sre/)
* [SLO Playbooks and Guides — Practical SLO design](https://sre.google/sre-book/)
Further reading
* How to measure latency percentiles and why p95/p99 matter for UX.
* Error budgets: policy templates and runbooks.
* Prometheus query examples for SLIs and SLO dashboards.
Operationalize SLOs with error budgets
Error budgets translate SLOs into governance and operational policy. They enable teams to make explicit decisions about whether to prioritize feature velocity or reliability:
* If the error budget is healthy, teams can safely ship features and experiments.
* If the error budget is depleted, the team focuses on reliability work until the budget is replenished.
Use dashboards and automated checks to track SLO consumption, and define clear runbooks for error-budget breaches (e.g., reduce rollouts, increase QA, emergency fixes).
Summary checklist for SLO development
* Identify critical user journeys.
* Define SLIs with precise measurement methods.
* Set SLOs based on business impact and historical data.
* Document rationale, assumptions, and measurement details.
* Implement monitoring, dashboards, and alerting tied to SLOs and error budgets.
* Review and iterate SLOs regularly with business stakeholders.
Links and references
* [Google SRE Book — Service Level Objectives](https://sre.google/sre-book/service-level-objectives/)
* [Prometheus — Monitoring system & time series database](https://prometheus.io/)
* [Site Reliability Engineering (SRE) — Principles and Practices](https://landing.google.com/sre/)
* [SLO Playbooks and Guides — Practical SLO design](https://sre.google/sre-book/)
Further reading
* How to measure latency percentiles and why p95/p99 matter for UX.
* Error budgets: policy templates and runbooks.
* Prometheus query examples for SLIs and SLO dashboards.