This article explores billing intricacies in Google Cloud Platform for effective cost management and optimization.
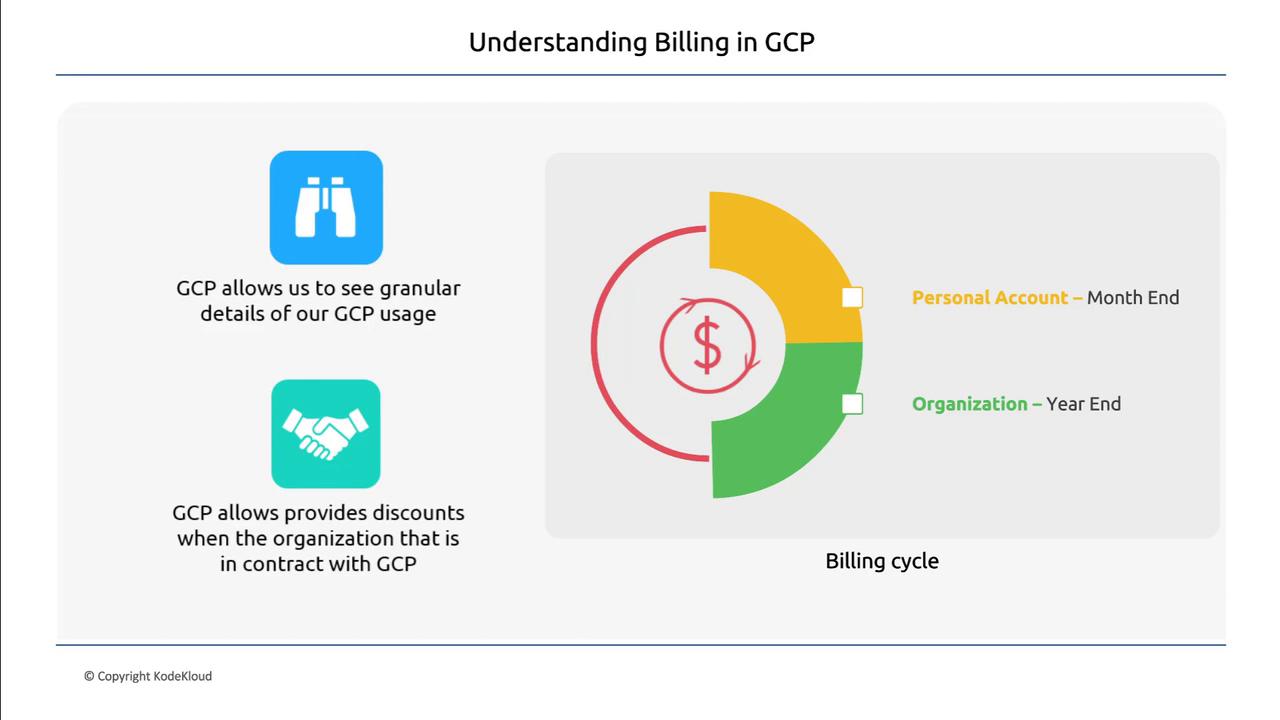
Hello and welcome back!In this article, we explore the intricacies of billing within the Google Cloud Platform (GCP). Whether you’re using a personal account or working within an enterprise environment, understanding how resource consumption is tracked and billed is crucial for effective cost management and optimization.GCP provides detailed insights into your resource usage. For example, when running multiple compute instances over a week, you can view granular utilization data for each instance. This detailed overview helps you pinpoint cost drivers and adjust your resource allocation to prevent unexpected overspending.Organizations typically conduct monthly reviews of GCP expenses. When costs increase, it’s essential to investigate whether the rising expenses are due to increased network usage, enhanced Kubernetes cluster activity, or heightened compute instance operations. Identifying the root cause helps determine whether the growth is organic or if resource allocation can be further optimized, potentially eliminating unnecessary expenditures.For personal accounts, the billing cycle ends monthly. In contrast, larger organizations that manage millions of dollars in GCP resources might have billing cycles that extend until the end of the year, based on their contractual agreements with GCP. Additionally, long-term contracts can unlock significant discounts on widely used resources. For instance, signing a five-year contract might qualify an organization for discounted pricing on several services.
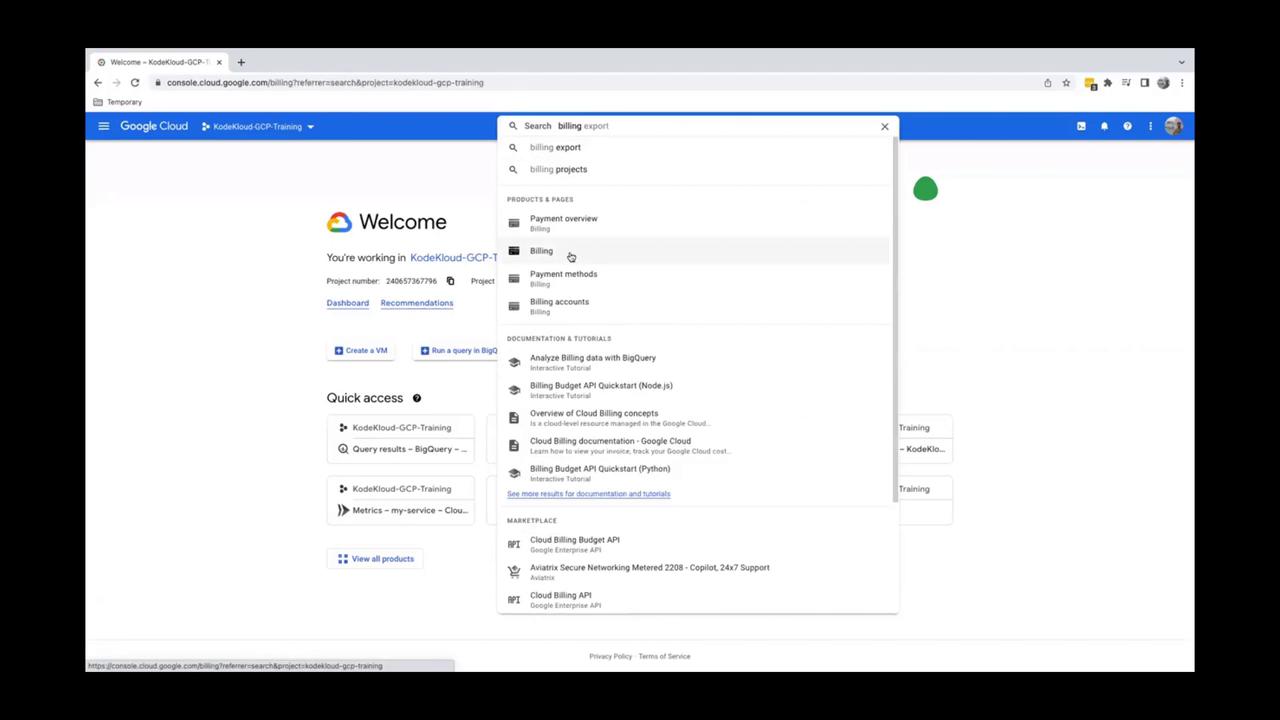
To begin, log into your GCP console. Start by typing “billing” in the search bar and select the billing option from the search results.
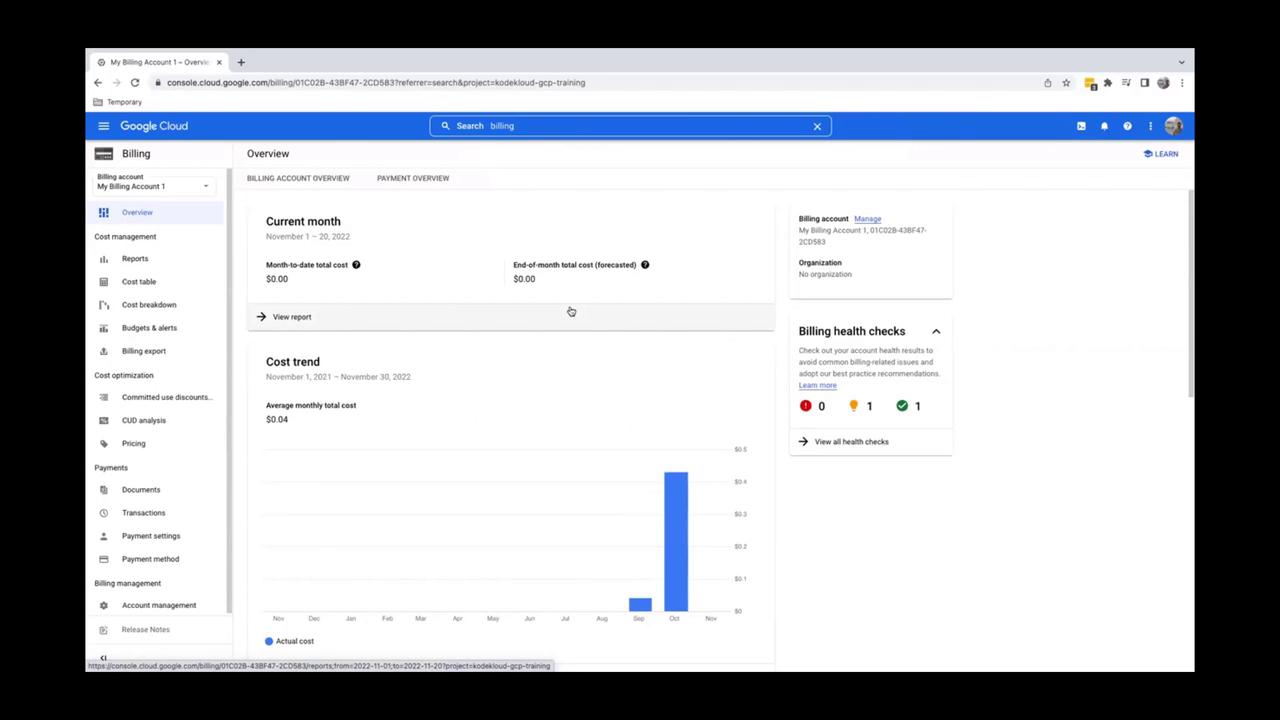
Selecting this option directs you to the billing console.
If your account is new, you might not see any billing data immediately.
In our example, the dashboard displays a billing graph because the account has been active for several months.
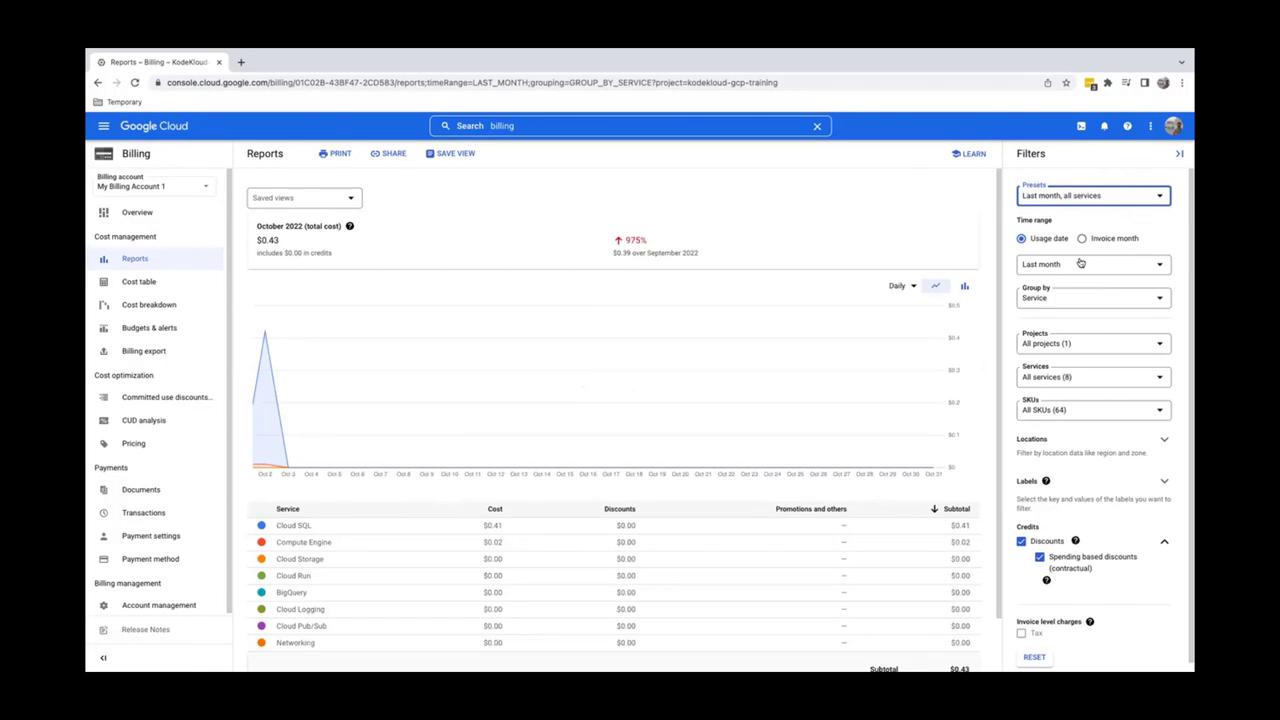
The dashboard offers an overview of your cost trends. To get more detailed information, click on “Reports” in the left-hand navigation pane.In the Reports section, you can review cost utilization for a specific period, such as November. Adjust the filter settings to view “last month” across all services, which generates a graph displaying resource consumption throughout the month.
This report details the usage of various services like Cloud SQL, Compute Engine, Cloud Storage, and others. For example, the report might show that Cloud SQL incurred a charge of 0.41withnodiscountsapplied.Whilelargerorganizationsmightbenefitfromcontract−baseddiscounts,thispersonalaccountexampleshowsatotalcostof0.43.To locate payment options, navigate to the Payment Settings on the left. Under “Payment Methods,” you can review your billing method. Clicking on “Payment Method” will display your card details.
This interface allows you to add a new card if needed. The example shown uses a dummy card for demonstration purposes.
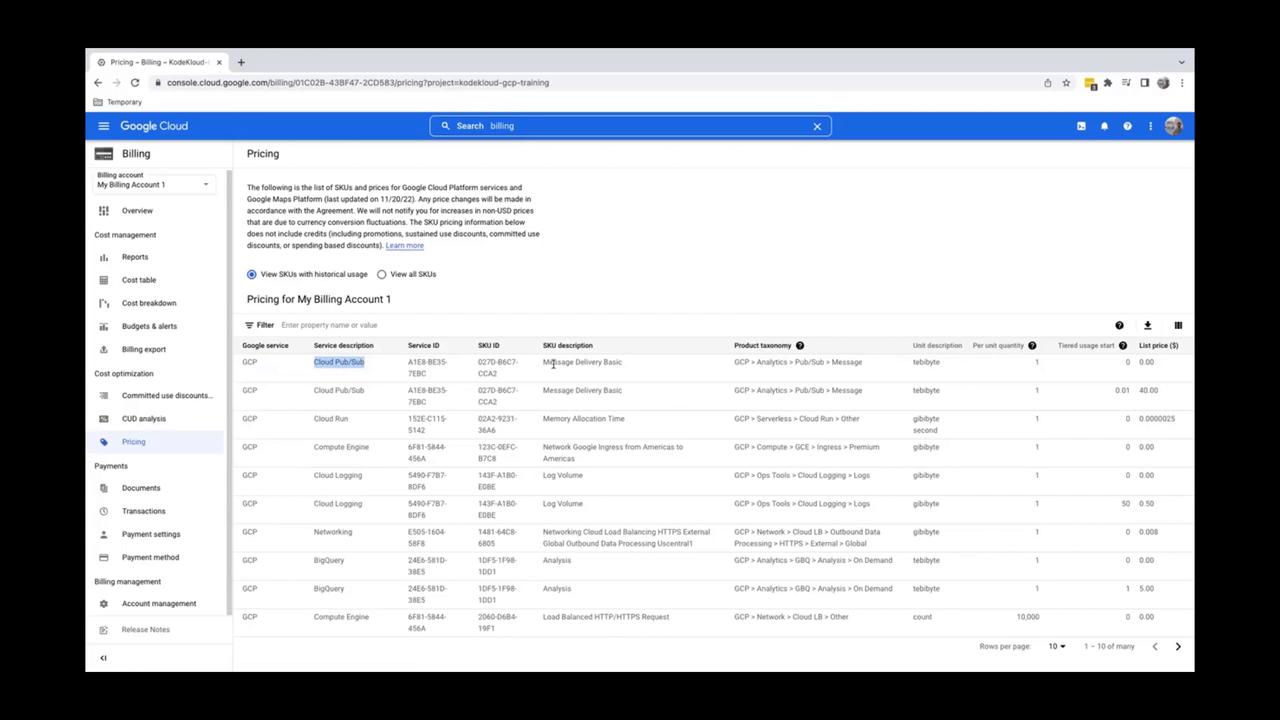
Another valuable feature is the “Pricing” tab under cost optimization. Here, you can access comprehensive information about your resource usage. For instance, you might review specific details for services like Cloud Pub/Sub, including the number of units consumed and their associated costs.
In this Pricing section, you may come across detailed rows such as a 40chargeforaparticularservice.Byexpandingthedatatodisplaymorerows(e.g.,selecting50rowsperpage),yougainadditionalinsightsintovariousresourceutilizations—forexample,detectinga0.08 charge for specific Cloud Storage activities.Returning to the Overview page, scroll down to view the top services used. For November, the report highlights Cloud SQL as the highest cost resource at $0.41, followed by Compute Engine. This summary is invaluable when identifying which services are contributing the most to your monthly expenses.This concludes our in-depth look at understanding GCP Billing. We hope this guide helps you effectively manage and optimize your GCP costs. For more information on managing cloud expenses, please explore additional resources on the Google Cloud Documentation.