> ## Documentation Index
> Fetch the complete documentation index at: https://notes.kodekloud.com/llms.txt
> Use this file to discover all available pages before exploring further.
# Connecting to GKE cluster using Cloud shell
> This article provides a guide to connect to a GKE cluster using Cloud Shell, authenticate, verify connectivity, and explore workloads.
Welcome to this step-by-step guide on establishing a secure connection to your Google Kubernetes Engine (GKE) cluster via Google Cloud Shell. You’ll learn how to authenticate your session, verify connectivity with `kubectl`, and explore workloads directly in the Google Cloud Console.
## 1. Retrieve Cluster Credentials
1. Open the [GKE Clusters](https://console.cloud.google.com/kubernetes/list) page in the Google Cloud Console.
2. Click your cluster name.
3. Select **Connect**, then choose **Run in Cloud Shell**.
Cloud Shell will launch at the bottom of your browser with the following command pre-filled:
```bash theme={null}
gcloud container clusters get-credentials gcp-devops-project \
--region us-central1 \
--project flowing-castle-374710
```
Press **Enter**, then **Authorize** when prompted. This updates your local kubeconfig so that `kubectl` can interact with your GKE cluster.
You need to run this `gcloud container clusters get-credentials` command each time you start a new Cloud Shell session, as kubeconfig configurations aren’t persisted across sessions.
## 2. Verify Connection with kubectl
After retrieving credentials, confirm your connection and inspect system components:
| kubectl Command | Description |
| --------------------------------- | ---------------------------------------------- |
| `kubectl get namespaces` | List all namespaces in the cluster |
| `kubectl get pods -n kube-system` | List all pods in the **kube-system** namespace |
Run:
```bash theme={null}
# List namespaces
kubectl get namespaces
# List pods in kube-system
kubectl get pods -n kube-system
```
Example output:
```bash theme={null}
$ kubectl get pods -n kube-system
NAME READY STATUS RESTARTS AGE
filestore-node-7havk 3/3 Running 0 9m56s
filestore-node-hzc64 0/0 ---- 0 9m56s
fluentbit-gce-small-4n47s 0/0 ---- 0 9m56s
kube-api-access-tnhmb 0/0 ---- 0 9m56s
gke-metadata-server-6srb6 1/1 Running 0 9m56s
gke-metrics-agent-tmb8p 1/1 Running 0 9m56s
ip-attach-agent-4kjdz 0/0 ---- 0 9m56s
konnectivity-agent-8t894 1/1 Running 0 9m56s
kube-dns-648f67d9c4-kz6h6 1/1 Running 0 10m
kube-dns-648f67d9c4-6rxnl 1/1 Running 0 10m
metrics-server-6d49bb6c5-7xjg 1/1 Running 0 10m
metadefender 0/0 ---- 0 9m56s
metra-8cfb5dff73-9c8g 1/1 Running 0 9m55s
node-local-dns-9v4vd 2/2 Running 0 9m56s
```
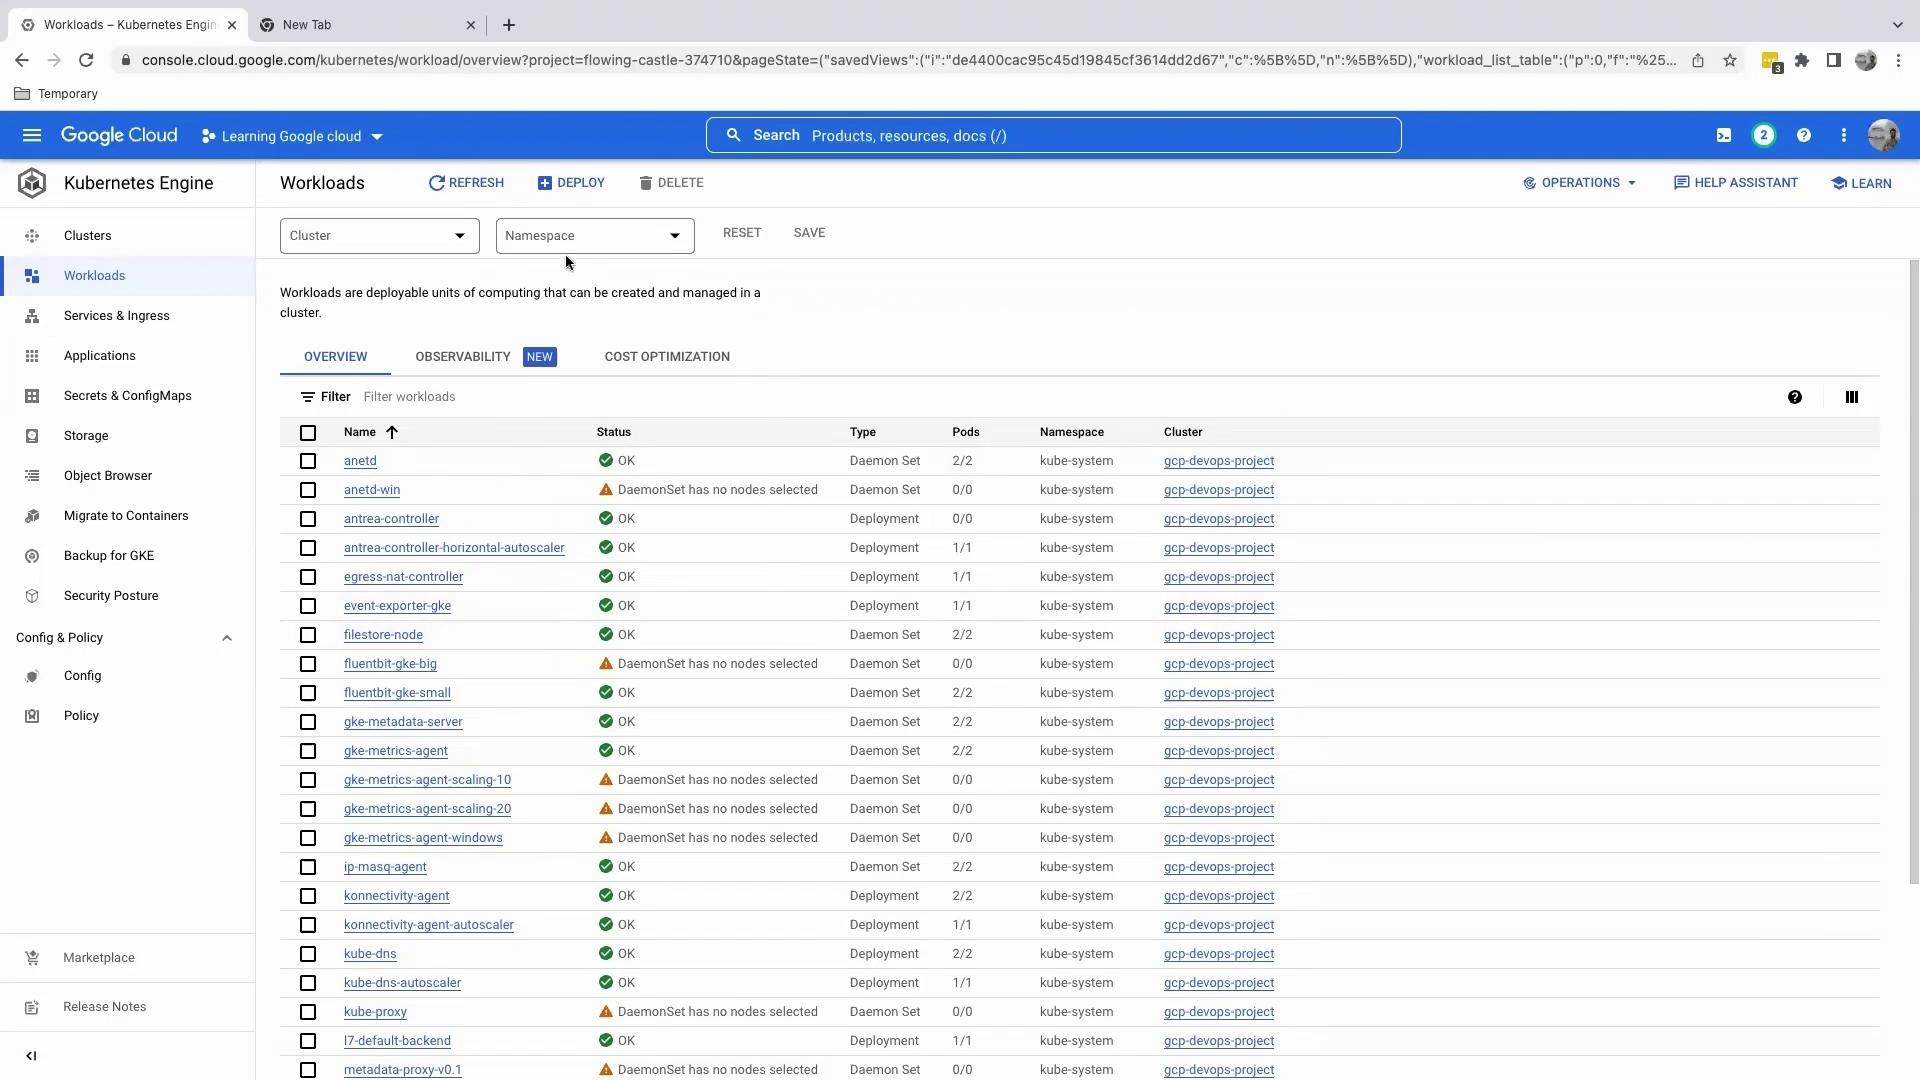
## 3. View Workloads in Google Cloud Console
Inspect workloads and system metrics without leaving the Console:
1. Close the Cloud Shell terminal window.
2. In the left-hand navigation, click **Workloads**.
3. Toggle **Show system workloads**.
4. Filter by **kube-system** to view system pods.
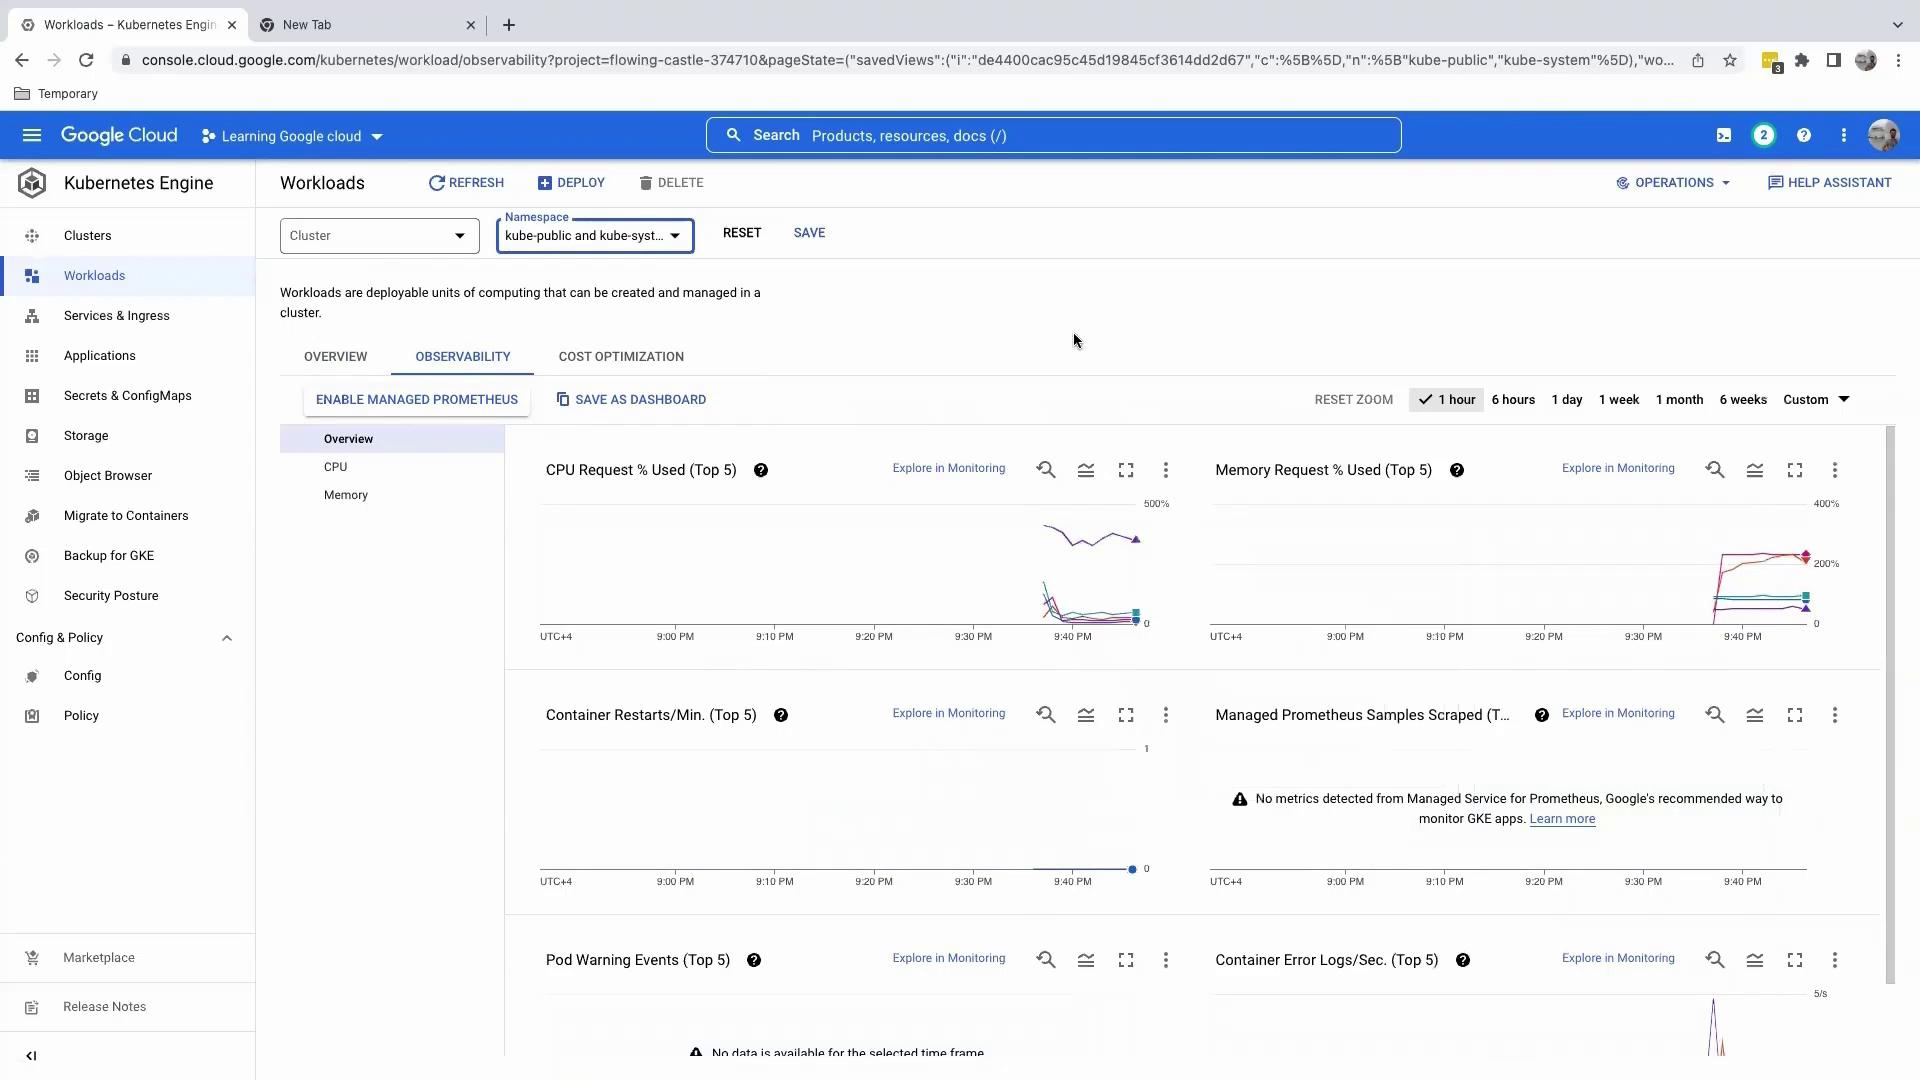
To see per-pod resource metrics:
* Use the namespace filter to select one or more namespaces.
* Examine CPU and memory usage, restarts, and error logs in the metrics panel.
***
You’ve successfully connected to your GKE cluster via Cloud Shell, executed essential `kubectl` commands, and explored workloads in the GCP Console. Next, we’ll guide you through deploying applications to your cluster.
## References
* [Google Kubernetes Engine Documentation](https://cloud.google.com/kubernetes-engine/docs)
* [kubectl Cheat Sheet](https://kubernetes.io/docs/reference/kubectl/cheatsheet/)
* [Google Cloud Shell Overview](https://cloud.google.com/shell/docs/)