> ## Documentation Index
> Fetch the complete documentation index at: https://notes.kodekloud.com/llms.txt
> Use this file to discover all available pages before exploring further.
# Monitoring and Logging Cloud Operations for GKE
> This guide explores the Cloud Operations Suite for GKE, focusing on monitoring and logging to enhance cluster performance and issue detection.
In this guide, we’ll dive into the **Cloud Operations Suite** for Google Kubernetes Engine (GKE) using a construction-site analogy. Just as each contractor on a build site has a specialized role, monitoring and logging act as your supervisors and record-keepers—helping you track progress, detect issues early, and keep your cluster running smoothly.
## Monitoring: Your Dedicated Supervisor
Monitoring in Cloud Operations Suite for GKE is like having a dedicated supervisor on-site. It collects, analyzes, and visualizes data about your cluster’s performance, health, and resource usage. With real-time visibility, you can spot anomalies or potential problems before they escalate.
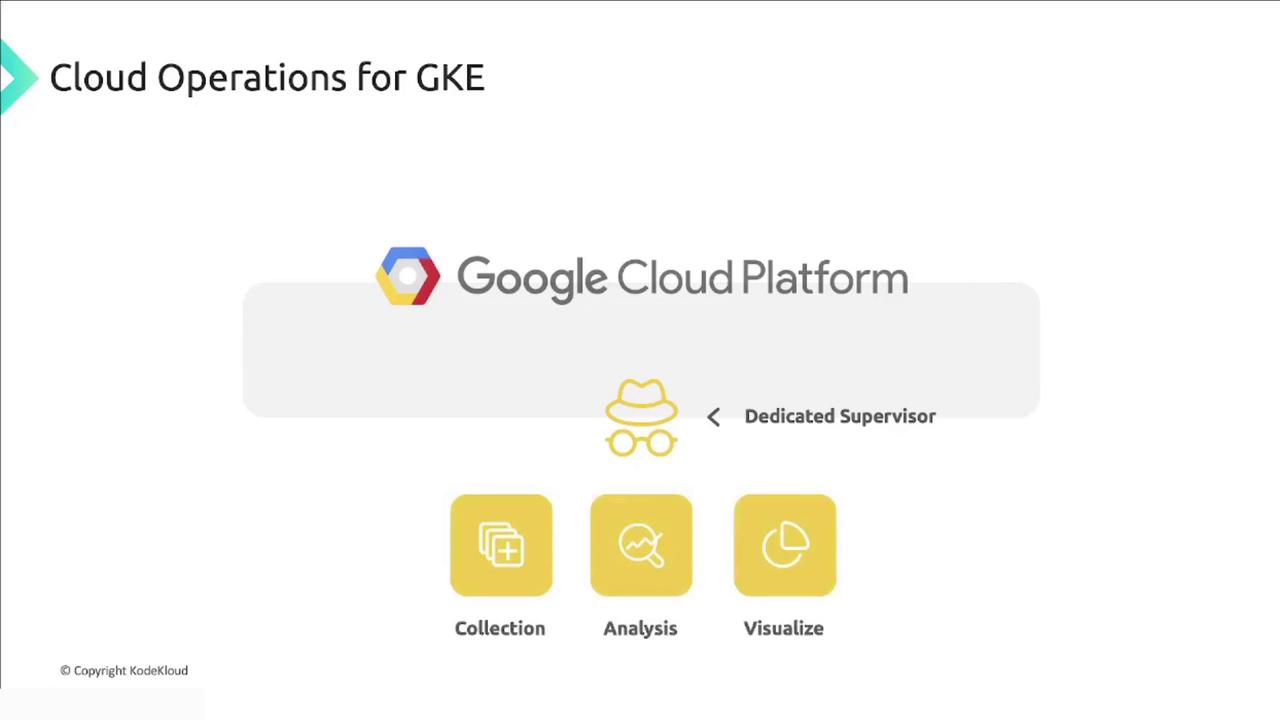
Key metrics you can track include:
* CPU and memory utilization
* Network traffic (ingress/egress)
* Application-level statistics (request rates, error rates)
GKE monitoring provides insight into:
* Node health and resource pressure
* Pod performance and status
* Network connectivity and latency
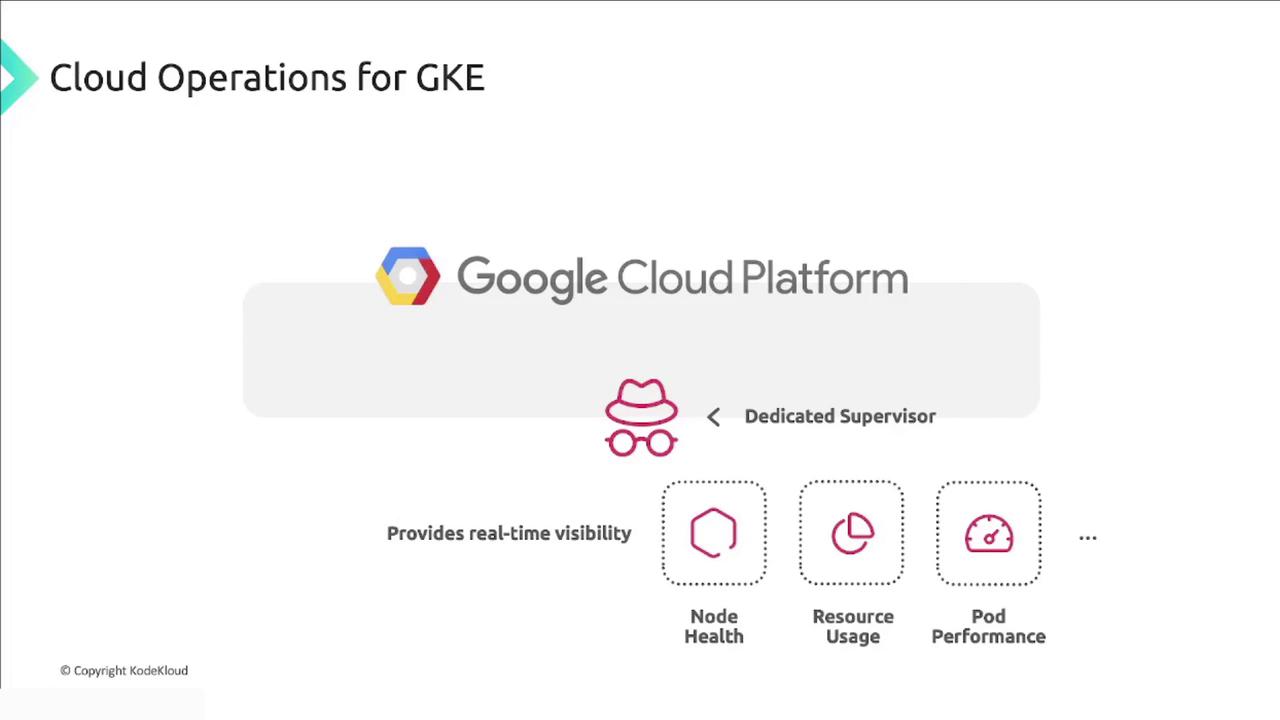
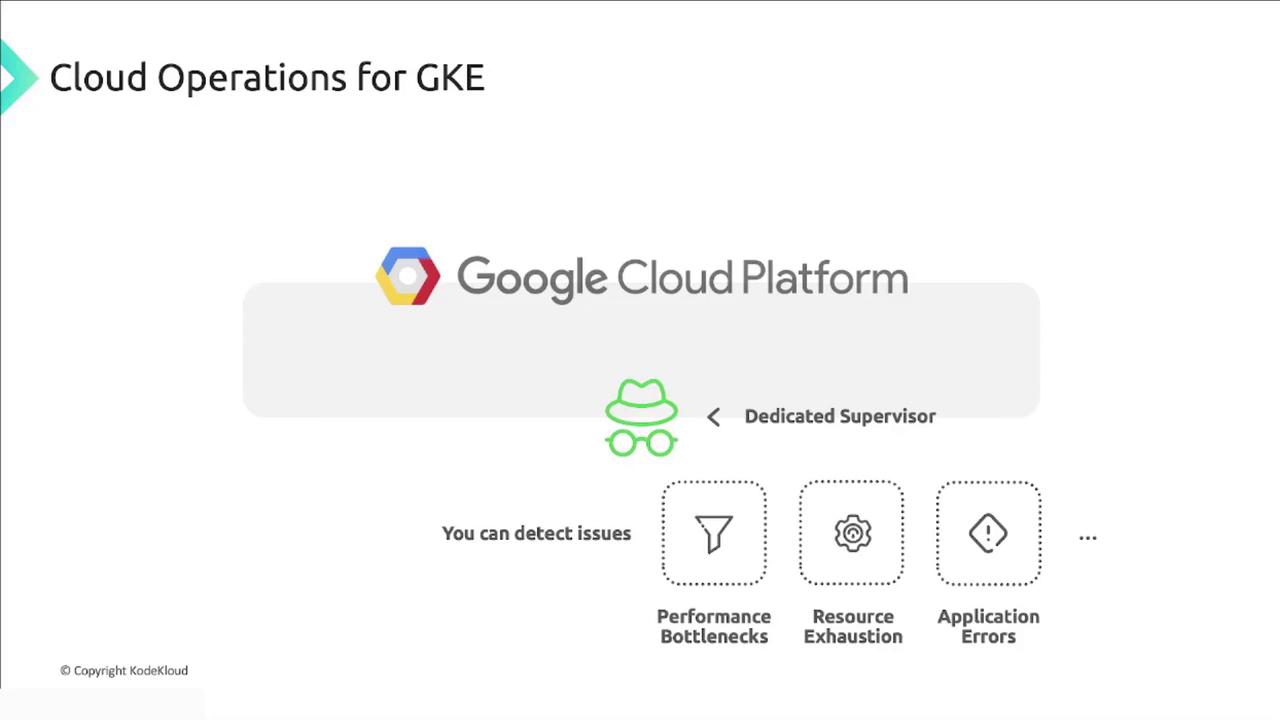
By continuously analyzing these metrics, you can detect issues such as CPU spikes, memory exhaustion, or network bottlenecks before they impact your applications.
## Logging: Your Detailed Record
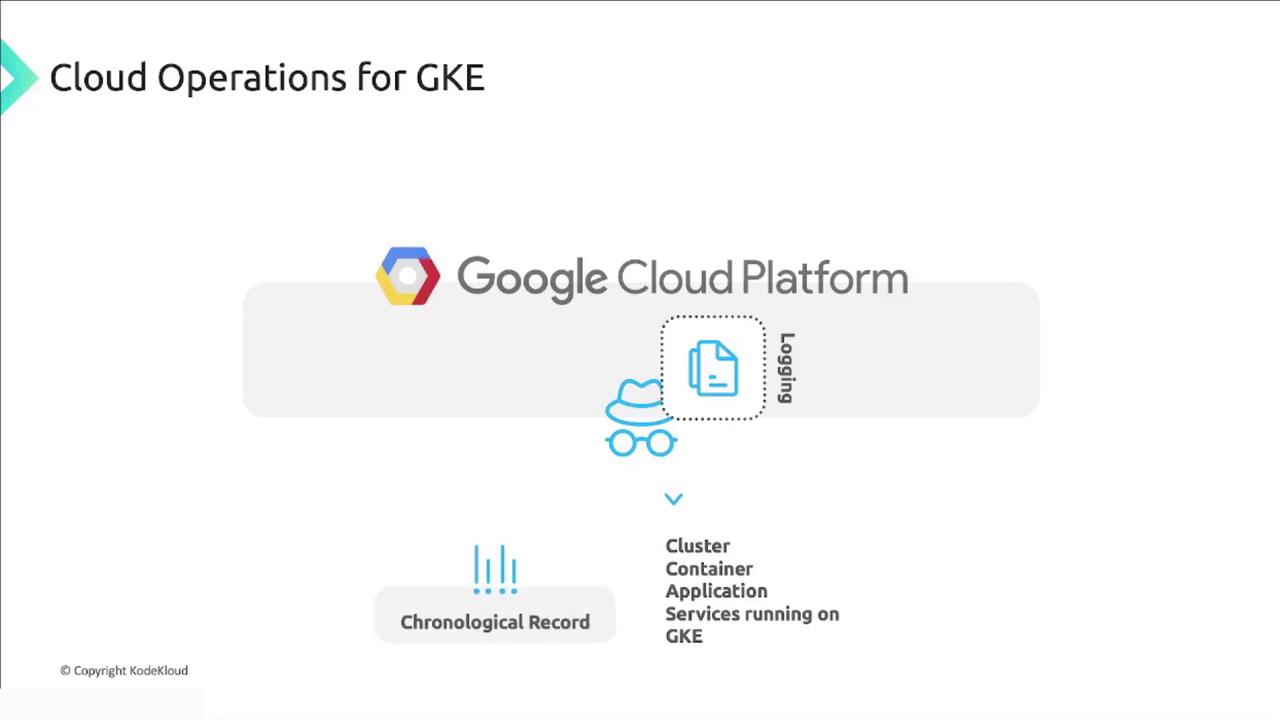
Logging acts like a comprehensive site logbook—capturing every event, error, and warning generated by your GKE cluster, containers, applications, and services. These logs form a chronological record essential for troubleshooting, auditing, and understanding system behavior.
Use cases for log analysis:
* Trace request flows across microservices
* Pinpoint root causes during incidents
* Audit changes and security events
Leverage log-based metrics to create custom dashboards and alerts for application-specific events.
## Seamless Integrations and Defaults
When you provision a new GKE cluster on Google Cloud, **Cloud Monitoring** and **Cloud Logging** are enabled by default—providing Kubernetes-native observability out of the box. You can fine-tune which logs and metrics are ingested, ensuring you capture only what you need.
High log and metric retention can increase costs. Use [log exclusions](/docs/logging/exclusions) and metric filters to manage your budget.
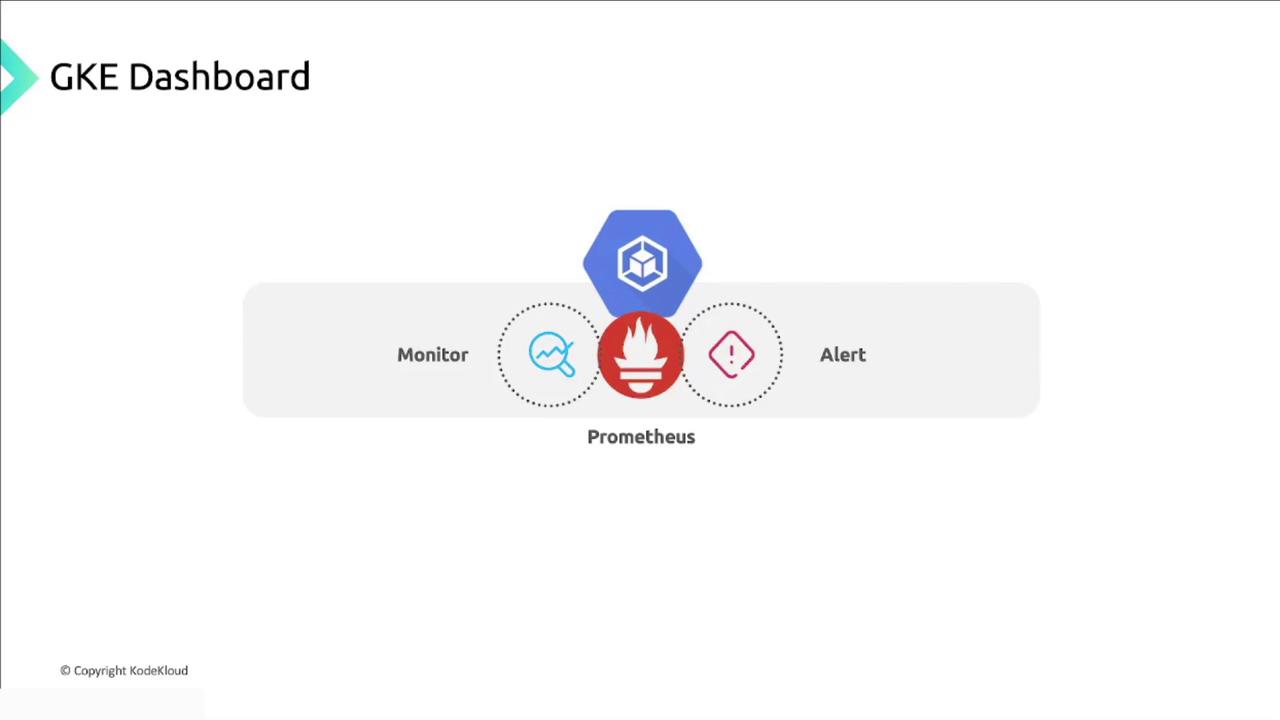
GKE also integrates with **Google Cloud Managed Service for Prometheus**. This allows you to ingest, monitor, and alert on Prometheus metrics at scale—without managing your own servers.
| Integration | Purpose | Benefit |
| ------------------------------ | -------------------------------- | ----------------------------------------------- |
| Cloud Monitoring | Collects cluster & pod metrics | Real-time dashboards and alerting |
| Cloud Logging | Aggregates logs from all sources | Centralized search, analysis, and archive |
| Managed Service for Prometheus | Ingests Prometheus metrics | Scalable monitoring without self-hosted servers |
For detailed installation and configuration steps, refer to the course materials or the official documentation below.
## Links and References
* [GKE Documentation](https://cloud.google.com/kubernetes-engine/docs)
* [Cloud Monitoring Overview](https://cloud.google.com/monitoring/docs)
* [Cloud Logging Overview](https://cloud.google.com/logging/docs)
* [Managed Service for Prometheus](https://cloud.google.com/stackdriver/docs/managed-prometheus)