> ## Documentation Index
> Fetch the complete documentation index at: https://notes.kodekloud.com/llms.txt
> Use this file to discover all available pages before exploring further.

# Pipeline Monitoring with Prometheus and Grafana

> This guide details a centralized monitoring solution for GitLab CI/CD pipelines using Prometheus and Grafana.

In this guide, we’ll architect a centralized monitoring solution for all your GitLab CI/CD pipelines using the [GitLab CI Pipelines Exporter][1], Prometheus, and Grafana. Collect metrics across multiple projects and visualize them in real time.

## 1. GitLab’s Built-in CI/CD Analytics

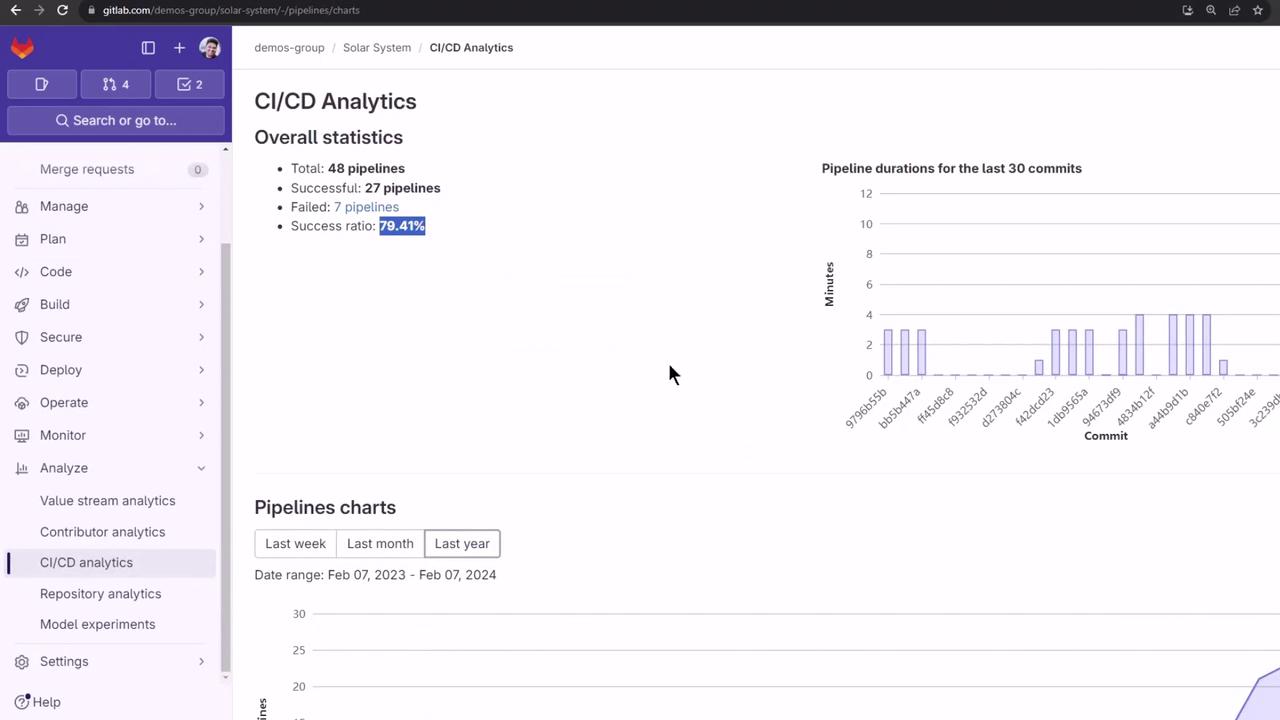
GitLab offers a per-project CI/CD analytics dashboard that displays overall pipeline success rates and duration trends. While convenient for a handful of repositories, it doesn’t scale to dozens of projects:
<Frame>
  ![The image shows a CI/CD analytics dashboard from GitLab, displaying overall pipeline statistics and a chart of pipeline durations for the last 30 commits.](https://kodekloud.com/kk-media/image/upload/v1752877370/notes-assets/images/GitLab-CICD-Architecting-Deploying-and-Optimizing-Pipelines-Pipeline-Monitoring-with-Prometheus-and-Grafana/gitlab-cicd-analytics-dashboard.jpg)
</Frame>

## 2. Centralized Pipeline Monitoring

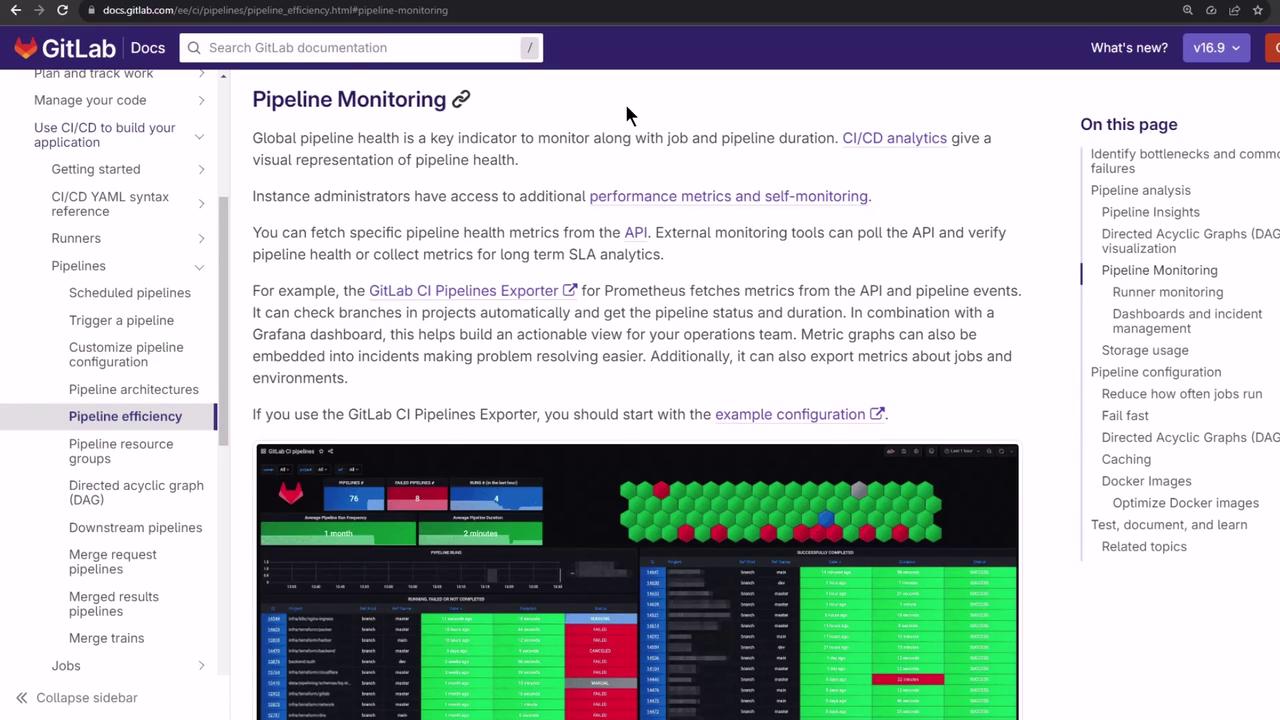
To obtain a global view, pair Prometheus with Grafana and the GitLab CI Pipelines Exporter:
<Frame>
  ![The image shows a GitLab documentation page about pipeline monitoring, including text and a dashboard screenshot with metrics and visualizations.](https://kodekloud.com/kk-media/image/upload/v1752877371/notes-assets/images/GitLab-CICD-Architecting-Deploying-and-Optimizing-Pipelines-Pipeline-Monitoring-with-Prometheus-and-Grafana/gitlab-pipeline-monitoring-dashboard.jpg)
</Frame>

The **GitLab CI Pipelines Exporter** polls GitLab’s API, translates pipelines, jobs, and environment metrics into Prometheus format, and ships three Grafana dashboards out of the box.

## 3. GitLab CI Pipelines Exporter
<Frame>
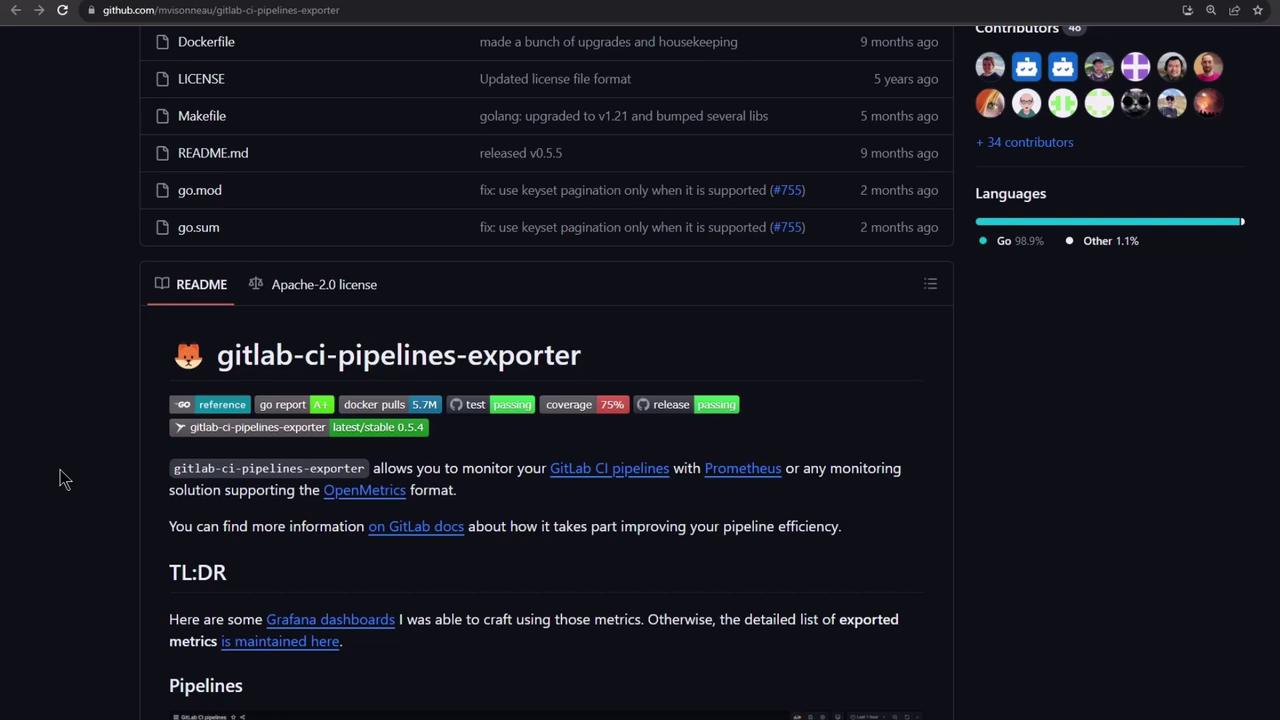
  ![The image shows a GitHub repository page for "gitlab-ci-pipelines-exporter," including file listings, a README section, and contributor information. The repository is primarily written in Go.](https://kodekloud.com/kk-media/image/upload/v1752877372/notes-assets/images/GitLab-CICD-Architecting-Deploying-and-Optimizing-Pipelines-Pipeline-Monitoring-with-Prometheus-and-Grafana/github-repo-gitlab-ci-pipelines.jpg)
</Frame>

### 3.1 Installation Options

Choose the installer that matches your environment:

| Platform         | Install Command                                                                                                                        |
| ---------------- | -------------------------------------------------------------------------------------------------------------------------------------- |
| macOS (Homebrew) | `brew install mvisonneau/tap/gitlab-ci-pipelines-exporter`                                                                             |
| Docker           | `docker run -it --rm quay.io/mvisonneau/gitlab-ci-pipelines-exporter:latest`                                                           |
| Windows (Scoop)  | `scoop bucket add gitlab-ci-pipelines-exporter https://github.com/mvisonneau/scoops`<br />`scoop install gitlab-ci-pipelines-exporter` |
| Nix              | `nix-env -iA nixos.prometheus-gitlab-ci-pipelines-exporter`                                                                            |

### 3.2 Quickstart Example

A Docker Compose quickstart brings up the exporter, Prometheus, and Grafana in one go:

```bash theme={null}
git clone https://github.com/mvisonneau/gitlab-ci-pipelines-exporter.git
cd gitlab-ci-pipelines-exporter/examples/quickstart

# Replace <your_token> in config file
sed -i 's/<your_token>/YOUR_TOKEN/' gitlab-ci-pipelines-exporter.yml

docker-compose up -d
```

Once running, access the stack at:

| Service          | URL                                                            |
| ---------------- | -------------------------------------------------------------- |
| Exporter Metrics | [http://localhost:8080/metrics](http://localhost:8080/metrics) |
| Prometheus UI    | [http://localhost:9090](http://localhost:9090)                 |
| Grafana UI       | [http://localhost:3000](http://localhost:3000) (admin/admin)   |

### 3.3 Docker Compose Overview

```yaml theme={null}
version: '3'
services:
  gitlab-ci-pipelines-exporter:
    image: quay.io/mvisonneau/gitlab-ci-pipelines-exporter:latest
    ports:
      - '8080:8080'
    environment:
      GCPE_GITLAB_TOKEN: ${GCPE_GITLAB_TOKEN}
      GCPE_CONFIG: /etc/gitlab-ci-pipelines-exporter.yml
    volumes:
      - ./gitlab-ci-pipelines-exporter.yml:/etc/gitlab-ci-pipelines-exporter.yml

  prometheus:
    image: prom/prometheus:v2.44.0
    ports:
      - '9090:9090'
    volumes:
      - ./prometheus/config.yml:/etc/prometheus/prometheus.yml

  grafana:
    image: grafana/grafana:9.5.2
    ports:
      - '3000:3000'
    environment:
      GF_AUTH_ANONYMOUS_ENABLED: 'true'
      GF_INSTALL_PLUGINS: grafana-polystat-panel,yesoreyeram-boomtable-panel
    volumes:
      - ./grafana/dashboards.yml:/etc/grafana/provisioning/dashboards/default.yml
      - ./grafana/datasources.yml:/etc/grafana/provisioning/datasources/default.yml
```

### 3.4 Prometheus Scraping Config

Configure Prometheus to scrape the exporter:

```yaml theme={null}
# prometheus/config.yml
global:
  scrape_interval: 15s

scrape_configs:
  - job_name: 'gitlab-ci-pipelines-exporter'
    scrape_interval: 10s
    static_configs:
      - targets: ['gitlab-ci-pipelines-exporter:8080']
```

### 3.5 Exporter Configuration

A minimal `gitlab-ci-pipelines-exporter.yml`:

```yaml theme={null}
---
log:
  level: debug

gitlab:
  url: https://gitlab.com
  token: <your_token>

project_defaults:
  pull:
    pipeline:
      jobs:
        enabled: true

projects:
  - name: gitlab-org/gitlab-runner
    pull:
      environments:
        enabled: true
        name_regexp: '^stable.*'
  - name: gitlab-org/charts/auto-deploy-app
```

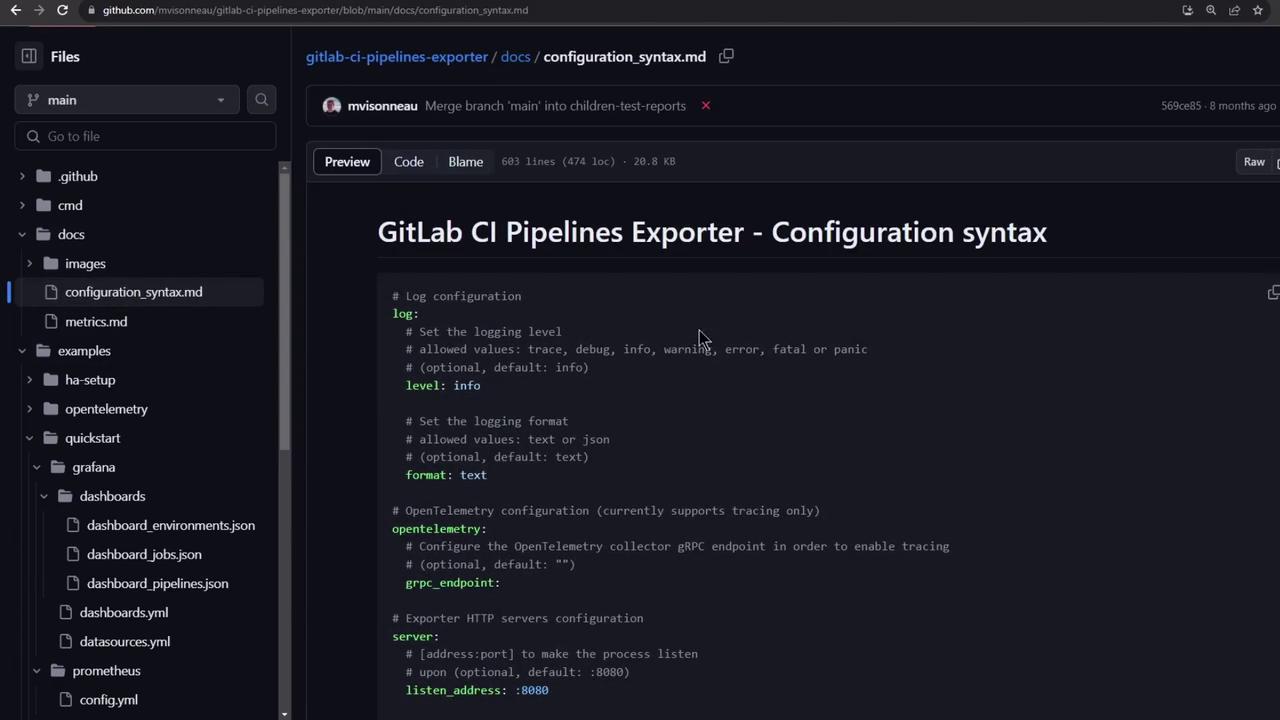
For the full configuration schema, refer to the exporter’s docs:
<Frame>
  ![The image shows a GitHub repository page displaying a markdown file titled "GitLab CI Pipelines Exporter - Configuration syntax," with code snippets for log configuration and server settings.](https://kodekloud.com/kk-media/image/upload/v1752877373/notes-assets/images/GitLab-CICD-Architecting-Deploying-and-Optimizing-Pipelines-Pipeline-Monitoring-with-Prometheus-and-Grafana/github-repo-markdown-gitlab-ci.jpg)
</Frame>

## 4. Creating a Personal Access Token

Generate a token under **User Settings → Access Tokens** with at least `read_api` scope:

<Frame>
  ![The image shows a GitLab user interface for creating a personal access token, with fields for token name, expiration date, and scope selection. The sidebar includes various user settings options like Profile, Account, and Access Tokens.](https://kodekloud.com/kk-media/image/upload/v1752877374/notes-assets/images/GitLab-CICD-Architecting-Deploying-and-Optimizing-Pipelines-Pipeline-Monitoring-with-Prometheus-and-Grafana/gitlab-personal-access-token-ui.jpg)
</Frame>

<Callout icon="triangle-alert" color="#FF6B6B">
  Keep your personal access token secure. Do not commit it to public repositories or share it in logs.
</Callout>

Paste this token into `gitlab-ci-pipelines-exporter.yml` before launching the stack.

## 5. Verifying the Exporter

Ensure the exporter is up and exposing metrics:

```bash theme={null}
docker-compose ps
docker logs -f quickstart_gitlab-ci-pipelines-exporter_1
# Check metrics output:
curl -s http://localhost:8080/metrics | grep gcpe_
```

A sample output might include:

```text theme={null}
gcpe_projects_count 47
gcpe_gitlab_api_requests_remaining 1997
gcpe_metrics_count 0
...
```

## 6. Exploring in Prometheus

Visit **Status → Targets** in Prometheus ([http://localhost:9090](http://localhost:9090)) to confirm the exporter is up:
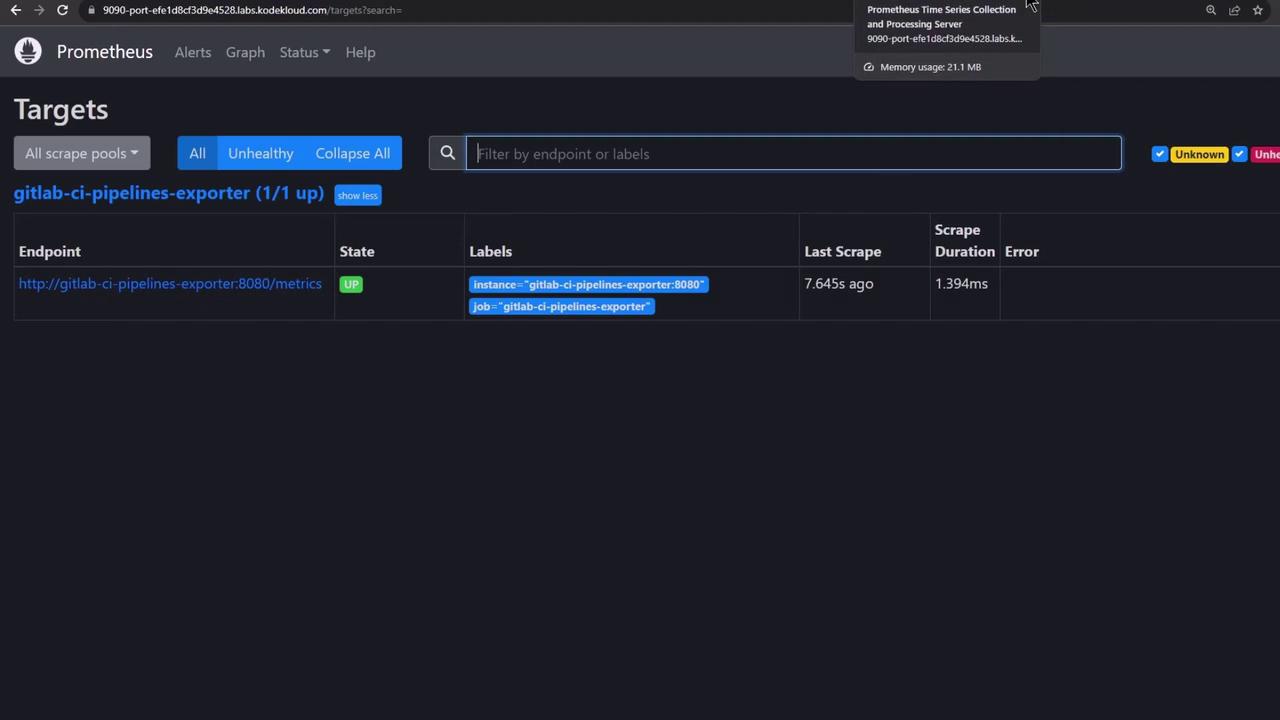
<Frame>
  ![The image shows a Prometheus monitoring dashboard displaying the status of a target called "gitlab-ci-pipelines-exporter," which is up and running with details about its endpoint, state, labels, last scrape time, and scrape duration.](https://kodekloud.com/kk-media/image/upload/v1752877374/notes-assets/images/GitLab-CICD-Architecting-Deploying-and-Optimizing-Pipelines-Pipeline-Monitoring-with-Prometheus-and-Grafana/prometheus-gitlab-ci-pipelines-dashboard.jpg)
</Frame>

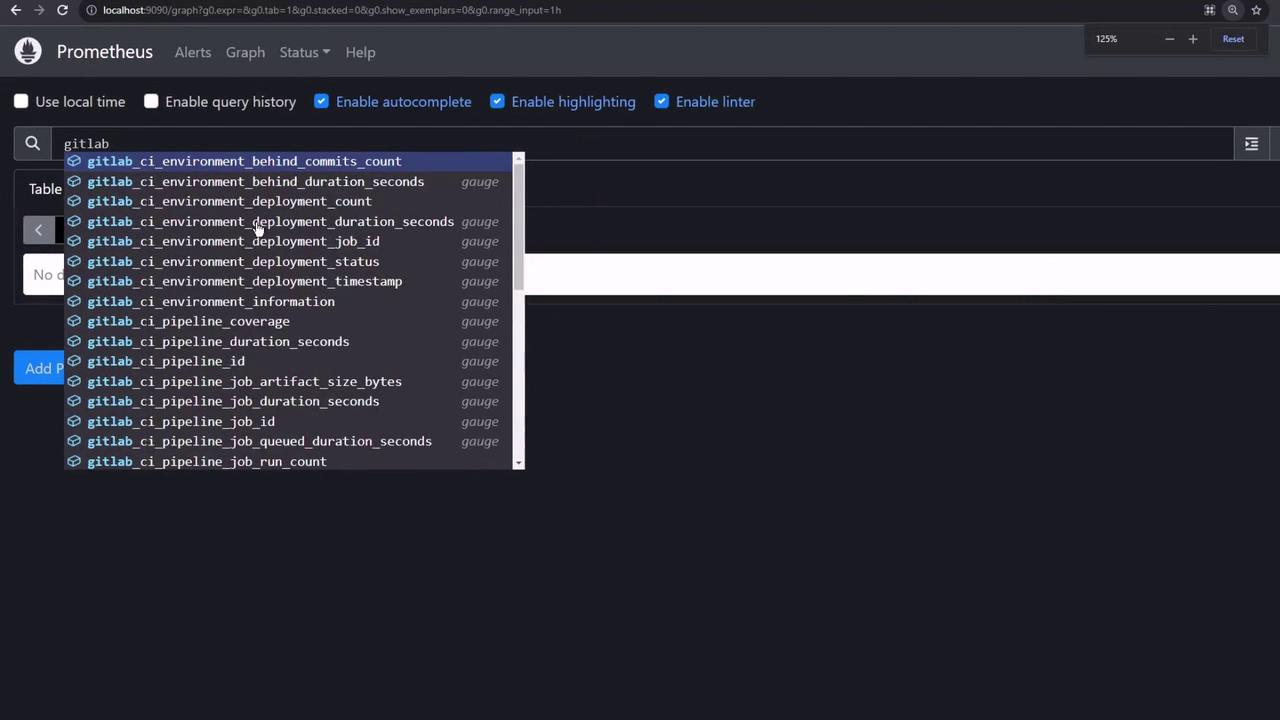
Query your GitLab metrics:

<Frame>
  ![The image shows the Prometheus interface with a search query for GitLab metrics, displaying a list of available metrics related to GitLab CI/CD pipelines.](https://kodekloud.com/kk-media/image/upload/v1752877376/notes-assets/images/GitLab-CICD-Architecting-Deploying-and-Optimizing-Pipelines-Pipeline-Monitoring-with-Prometheus-and-Grafana/prometheus-gitlab-metrics-query.jpg)
</Frame>

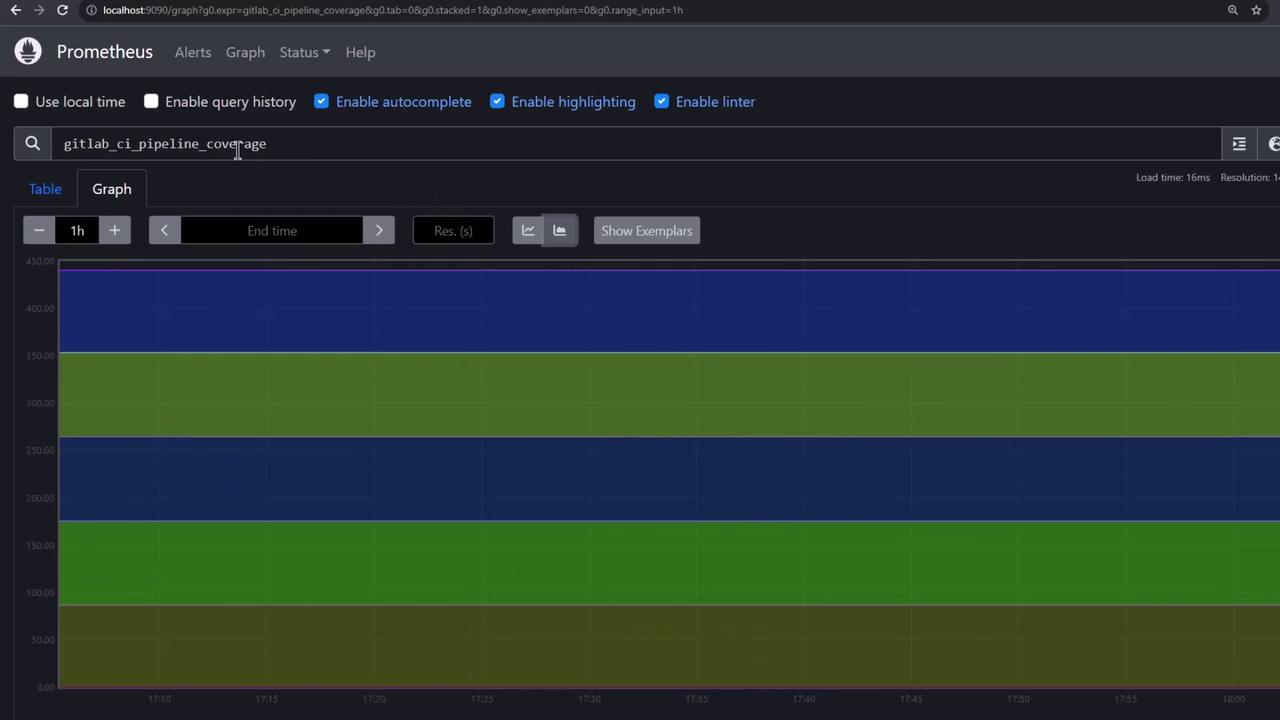
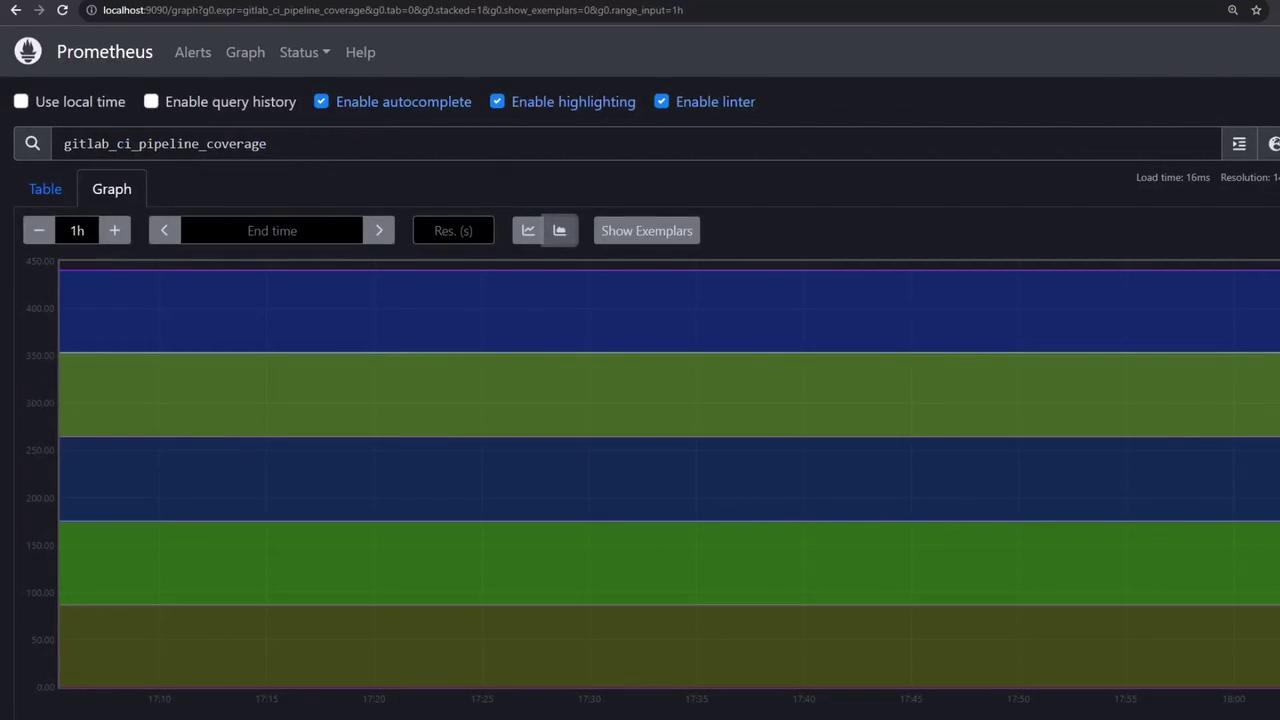
Render a time series graph:

<Frame>
  ![The image shows a Prometheus dashboard displaying a stacked graph of GitLab CI pipeline coverage over time, with blue and green horizontal bands.](https://kodekloud.com/kk-media/image/upload/v1752877377/notes-assets/images/GitLab-CICD-Architecting-Deploying-and-Optimizing-Pipelines-Pipeline-Monitoring-with-Prometheus-and-Grafana/prometheus-dashboard-gitlab-ci-coverage.jpg)
</Frame>

Adjust time ranges and resolution to dig into historical data:
<Frame>
  ![The image shows a Prometheus dashboard with a stacked graph displaying data over time, likely related to GitLab CI pipeline coverage. The interface includes options for time range, resolution, and various settings.](https://kodekloud.com/kk-media/image/upload/v1752877377/notes-assets/images/GitLab-CICD-Architecting-Deploying-and-Optimizing-Pipelines-Pipeline-Monitoring-with-Prometheus-and-Grafana/prometheus-dashboard-gitlab-ci-graph.jpg)
</Frame>

## 7. Grafana Dashboards

Log in to Grafana ([http://localhost:3000](http://localhost:3000), admin/admin). The exporter provides three ready-to-use dashboards:

### Environments & Deployments

<Frame>
  ![The image shows a dashboard for GitLab CI environments and deployments, displaying various metrics such as availability, deployment status, and environment details in a graphical and tabular format.](https://kodekloud.com/kk-media/image/upload/v1752877379/notes-assets/images/GitLab-CICD-Architecting-Deploying-and-Optimizing-Pipelines-Pipeline-Monitoring-with-Prometheus-and-Grafana/gitlab-ci-dashboard-environments-metrics.jpg)
</Frame>

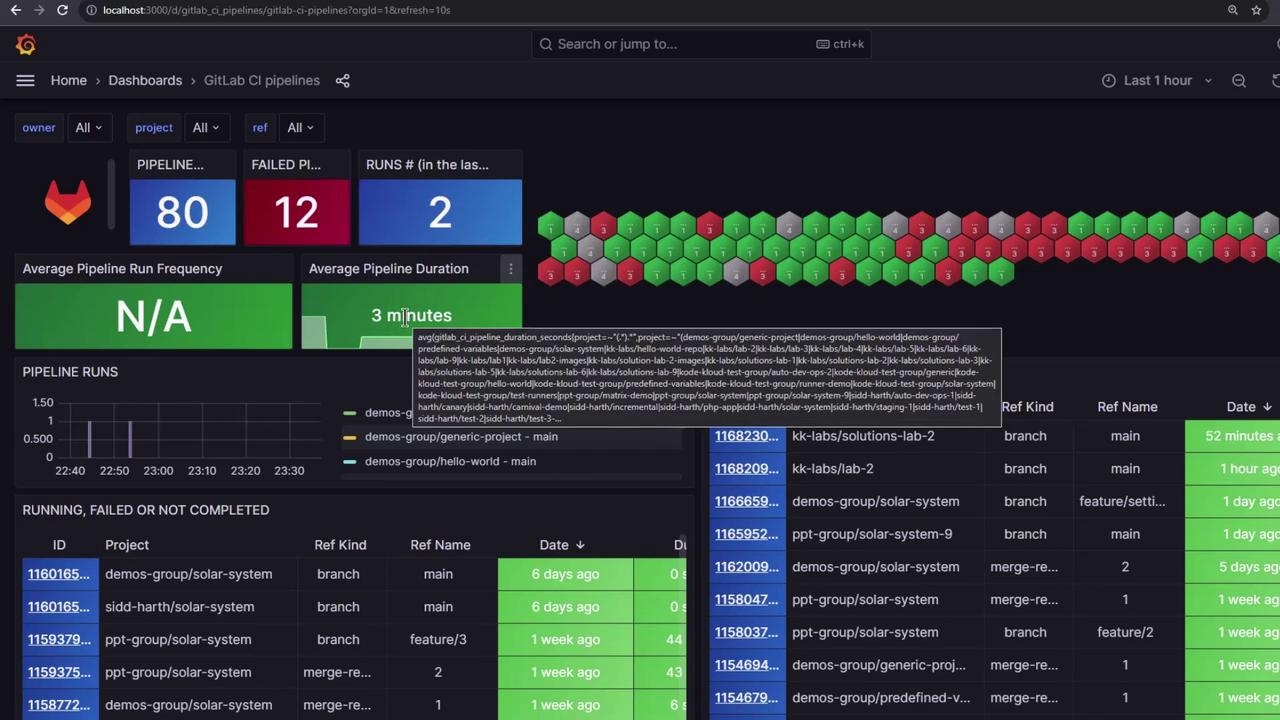
### Pipelines Overview

<Frame>
  ![The image shows a dashboard for GitLab CI pipelines, displaying metrics such as the number of pipelines, failed pipelines, and average pipeline duration, along with a visual representation of pipeline runs and their statuses.](https://kodekloud.com/kk-media/image/upload/v1752877380/notes-assets/images/GitLab-CICD-Architecting-Deploying-and-Optimizing-Pipelines-Pipeline-Monitoring-with-Prometheus-and-Grafana/gitlab-ci-pipelines-dashboard-metrics.jpg)
</Frame>

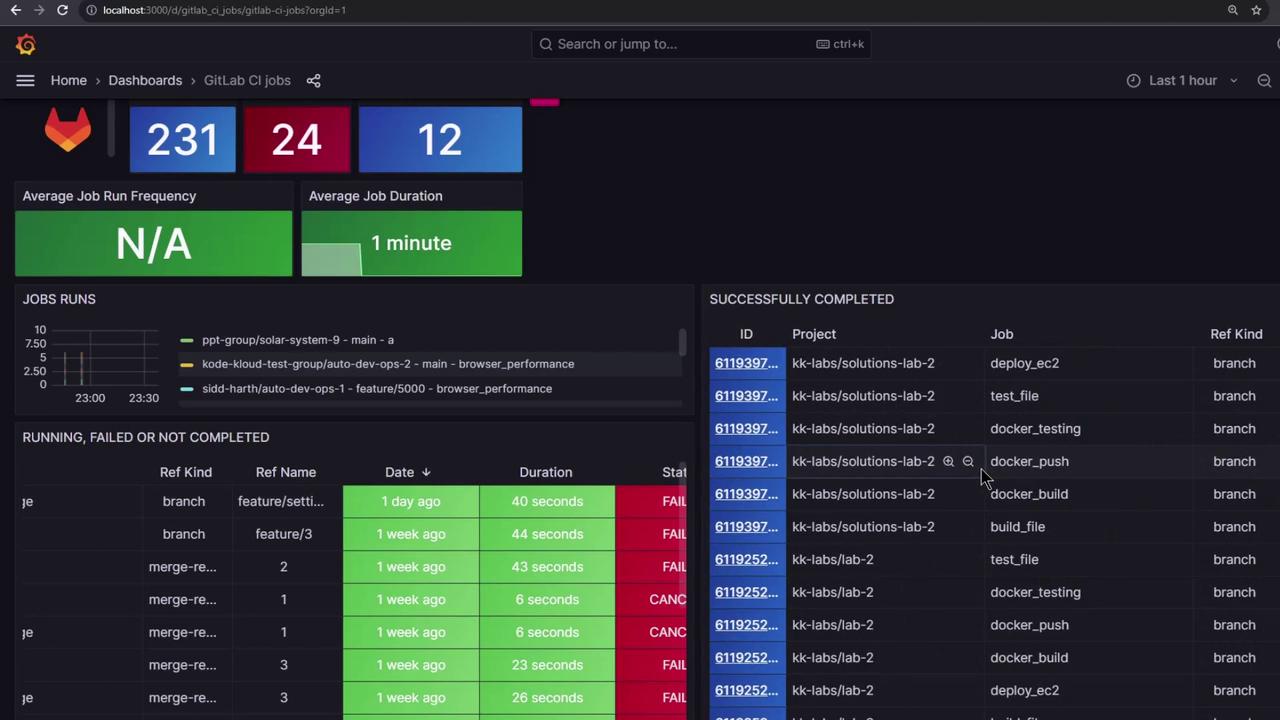
### Jobs Statistics

<Frame>
  ![The image shows a GitLab CI jobs dashboard with statistics on job runs, including average job duration and frequency, and lists of running, failed, and successfully completed jobs.](https://kodekloud.com/kk-media/image/upload/v1752877381/notes-assets/images/GitLab-CICD-Architecting-Deploying-and-Optimizing-Pipelines-Pipeline-Monitoring-with-Prometheus-and-Grafana/gitlab-ci-jobs-dashboard-statistics.jpg)
</Frame>

Dive into any metric and click through to GitLab for full context.

<Callout icon="lightbulb" color="#1CB2FE">
  For production environments, check out the [HA setup example][2] in the exporter repository.
</Callout>

***

## Links and References

* [GitLab CI Pipelines Exporter][1]
* [HA Setup Example][2]
* [Prometheus Documentation](https://prometheus.io/docs/)
* [Grafana Documentation](https://grafana.com/docs/)

[1]: https://github.com/mvisonneau/gitlab-ci-pipelines-exporter

[2]: https://github.com/mvisonneau/gitlab-ci-pipelines-exporter/tree/master/examples/ha

<CardGroup>
  <Card title="Watch Video" icon="video" cta="Learn more" href="https://learn.kodekloud.com/user/courses/gitlab-ci-cd-architecting-deploying-and-optimizing-pipelines/module/1573bc2e-563a-424a-a558-2081416601b3/lesson/111d1517-3fea-4e1d-84dd-3a00d18cdc93" />
</CardGroup>