> ## Documentation Index
> Fetch the complete documentation index at: https://notes.kodekloud.com/llms.txt
> Use this file to discover all available pages before exploring further.
# Monitoring through Prometheus Grafana
> Learn to visualize ArgoCD metrics using Prometheus and Grafana, including setup, configuration, and monitoring of various ArgoCD components.
In this lesson, you will learn how to utilize Prometheus and Grafana to visualize ArgoCD metrics. ArgoCD exposes a variety of Prometheus metrics across its different components—including the application controller, API server, repository server, and applicationset controller. This guide walks you through inspecting these metrics within your cluster, setting up Prometheus and Grafana using Helm, configuring ServiceMonitor resources to scrape ArgoCD metrics, and visualizing the collected data.
***
## Examining ArgoCD Metrics
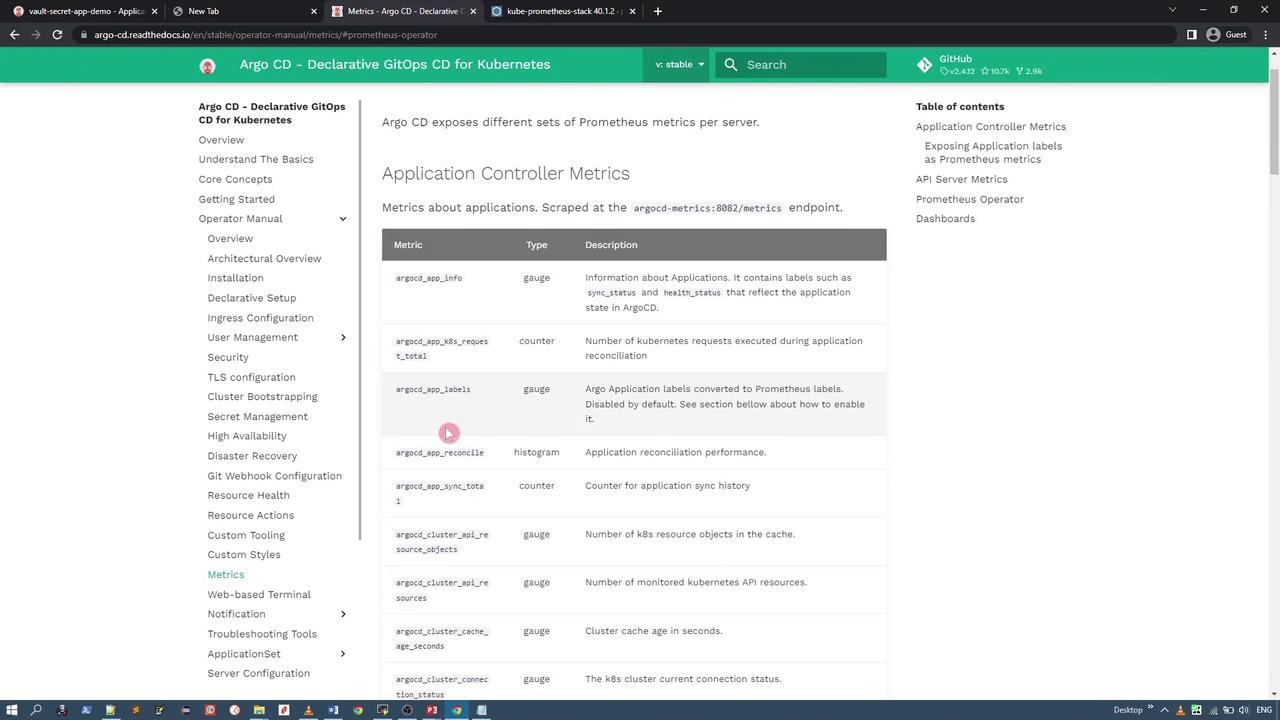
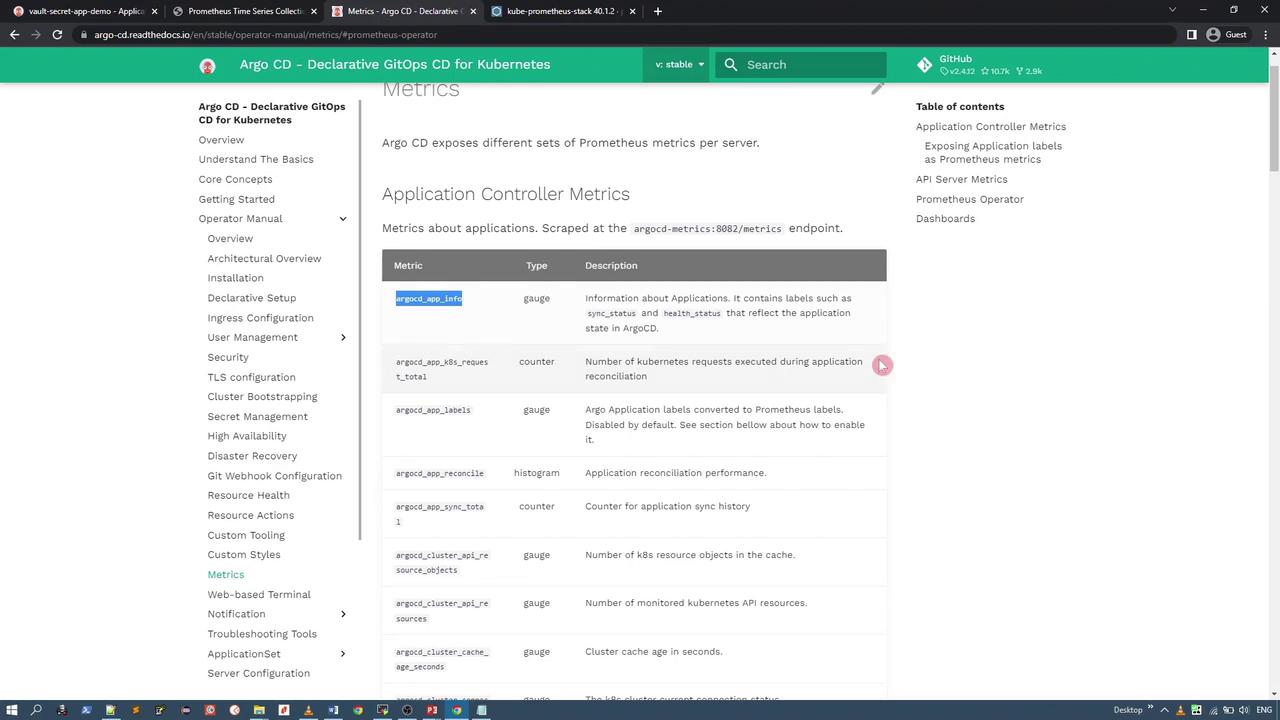
ArgoCD’s documentation provides detailed descriptions of the metrics exposed by its components. For instance, the following image illustrates the metrics for the ArgoCD application controller, including names, types, and descriptions:
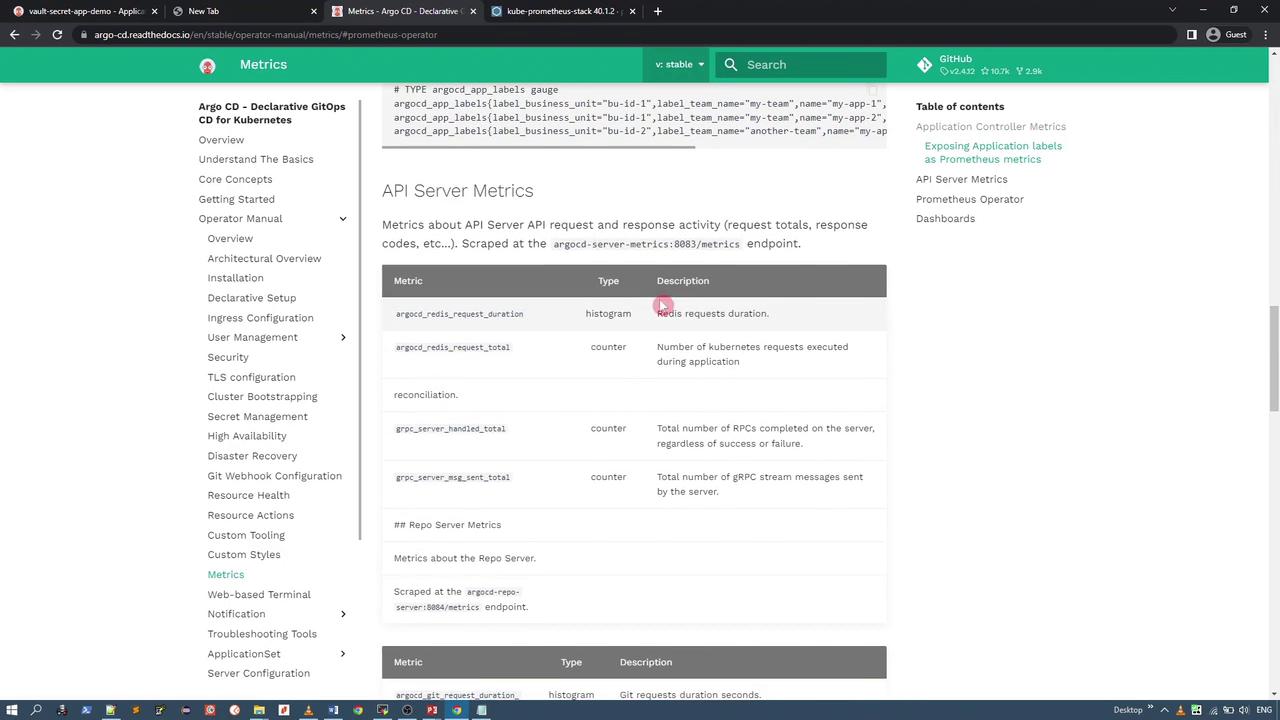
Similarly, the API server provides its own set of metric endpoints:
To inspect all ArgoCD services in your cluster, run the following command to list the services in the ArgoCD namespace:
```bash theme={null}
kubectl -n argocd get svc
```
You might see output similar to this:
```plaintext theme={null}
NAME TYPE CLUSTER-IP EXTERNAL-IP PORT(S) AGE
argocd-applicationset-controller ClusterIP 10.100.58.34 7000/TCP,8080/TCP 29h
argocd-dex-server ClusterIP 10.109.179.192 5556/TCP,5557/TCP,5558/TCP 29h
argocd-metrics ClusterIP 10.100.111.162 8082/TCP 29h
argocd-notifications-controller-metrics ClusterIP 10.110.116.143 9001/TCP 29h
argocd-redis ClusterIP 10.106.239.172 6379/TCP 29h
argocd-repo-server ClusterIP 10.101.4.27 8081/TCP,8084/TCP 29h
argocd-server NodePort 10.98.110.228 80:30663/TCP,443:31194/TCP 29h
argocd-server-metrics ClusterIP 10.97.180.219 8083/TCP 29h
```
Accessing the server’s metrics using a curl command on the default port (80) may return a “404 page not found” error:
```bash theme={null}
curl 10.98.110.228:80/metrics
```
Instead, use the dedicated metrics endpoint on the `argocd-metrics` service (port 8082) to retrieve Prometheus metrics. You might see output similar to:
```plaintext theme={null}
workqueue_work_duration_seconds_bucket{name="app_reconciliation_queue",le="1e-05"} 413
workqueue_work_duration_seconds_bucket{name="app_reconciliation_queue",le="0.001"} 5333
workqueue_work_duration_seconds_bucket{name="app_reconciliation_queue",le="0.01"} 5978
...
workqueue_work_duration_seconds_count{name="project_reconciliation_queue"} 1225
```
***
## Setting Up Prometheus and Grafana
To visualize ArgoCD metrics, you must deploy a Prometheus server. The Kube Prometheus Stack available on Artifact Hub provides Prometheus, Grafana, Alertmanager, and other essential custom resource definitions.
### Adding the Prometheus Helm Repository
First, add the Prometheus community repository and update your local Helm repository cache:
```bash theme={null}
helm repo add prometheus-community https://prometheus-community.github.io/helm-charts
helm repo update
```
### Installing the Prometheus Stack
Create a new namespace for monitoring (e.g., `monitoring`) and install the Prometheus stack. Depending on your requirements, you can choose between different chart versions. Here are two examples:
Using a recent version (e.g., 40.1.2):
```bash theme={null}
kubectl create ns monitoring
helm install my-kube-prometheus-stack prometheus-community/kube-prometheus-stack --version 40.1.2 -n monitoring
```
Or using an alternative version (e.g., 35.3.0):
```bash theme={null}
kubectl create ns monitoring
helm install my-kube-prometheus-stack prometheus-community/kube-prometheus-stack --version 35.3.0 -n monitoring
```
The installation process creates multiple resources (services, pods, daemonsets, statefulsets, etc.). To view the Prometheus service (set as NodePort), run:
```bash theme={null}
kubectl -n monitoring get svc
```
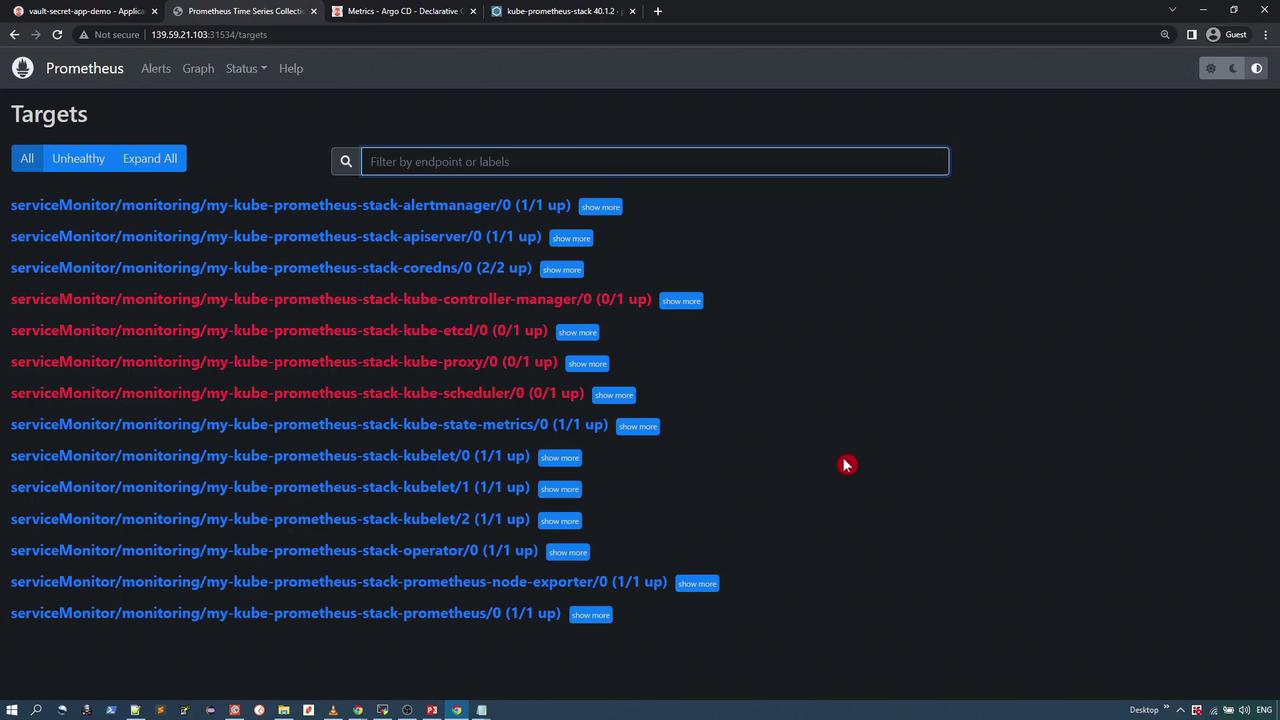
You can then access the Prometheus UI by navigating to the node’s IP with the assigned NodePort (e.g., 31534). In the Prometheus interface, go to “Status” → “Targets” to see the list of scraped endpoints.
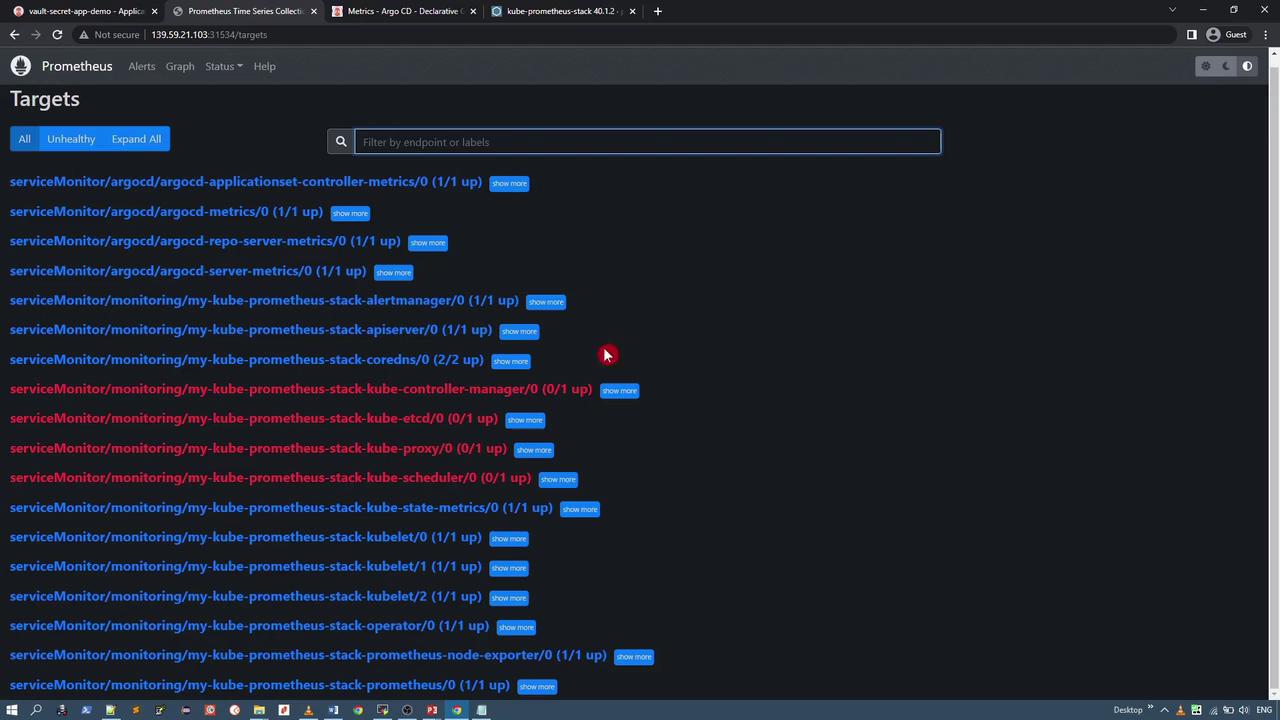
Filtering the target list for ArgoCD-related endpoints should display the newly added targets:
***
## Configuring ServiceMonitors for ArgoCD
To allow Prometheus to scrape ArgoCD metrics, create ServiceMonitor resources in the ArgoCD namespace. These YAML manifests specify the services to be monitored and must include a label that matches the Prometheus operator’s selector (in this case, the release name “my-kube-prometheus-stack”).
Below is an example configuration with three ServiceMonitors—for general metrics, server metrics, and repository server metrics. Similar manifests can be created for monitoring the applicationset controller.
```yaml theme={null}
apiVersion: monitoring.coreos.com/v1
kind: ServiceMonitor
metadata:
name: argocd-metrics
labels:
release: my-kube-prometheus-stack
spec:
selector:
matchLabels:
app.kubernetes.io/name: argocd-metrics
endpoints:
- port: metrics
---
apiVersion: monitoring.coreos.com/v1
kind: ServiceMonitor
metadata:
name: argocd-server-metrics
labels:
release: my-kube-prometheus-stack
spec:
selector:
matchLabels:
app.kubernetes.io/name: argocd-server-metrics
endpoints:
- port: metrics
---
apiVersion: monitoring.coreos.com/v1
kind: ServiceMonitor
metadata:
name: argocd-repo-server-metrics
labels:
release: my-kube-prometheus-stack
spec:
selector:
matchLabels:
app.kubernetes.io/name: argocd-repo-server
endpoints:
- port: metrics
```
Apply these manifests to the ArgoCD namespace (replace `argocd-service-monitors.yaml` with your filename):
```bash theme={null}
kubectl -n argocd apply -f argocd-service-monitors.yaml
```
Verify the ServiceMonitors are set up correctly:
```bash theme={null}
kubectl -n argocd get servicemonitors
```
You should see output similar to:
```plaintext theme={null}
NAME AGE
argocd-applicationset-controller-metrics 11s
argocd-metrics 11s
argocd-repo-server-metrics 11s
argocd-server-metrics 11s
```
Ensure that the metadata label “release” in each ServiceMonitor exactly matches the Helm release name used during the Prometheus stack installation (e.g., “my-kube-prometheus-stack”). You can confirm the Prometheus operator’s selector labels by running:
```bash theme={null}
kubectl -n monitoring get prometheus.monitoring.coreos.com -o yaml | grep -i servicemonitorselector -A5
```
***
## Visualizing ArgoCD Metrics
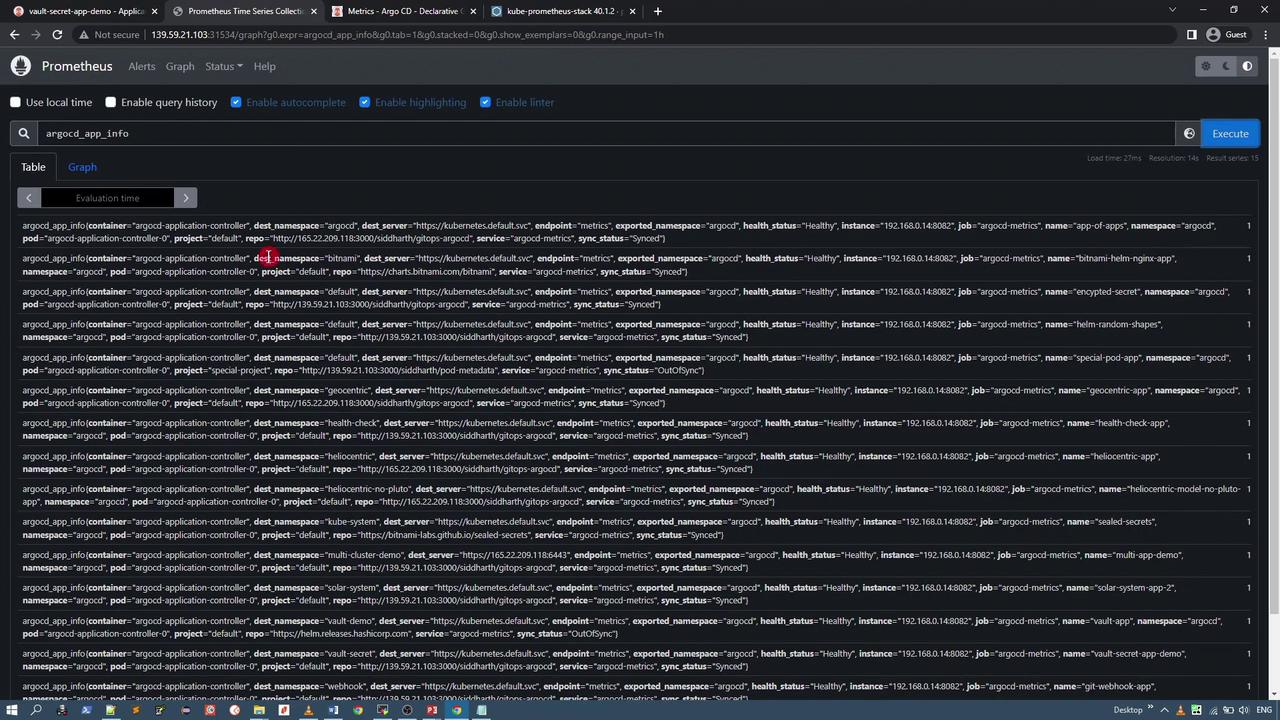
After the ServiceMonitors are active, Prometheus automatically adds ArgoCD targets. In the Prometheus UI, search for “argocd” (for example, using a query like `argocd_app_info`) to display detailed metrics and statuses for your applications.
***
## Using Grafana for Visualization
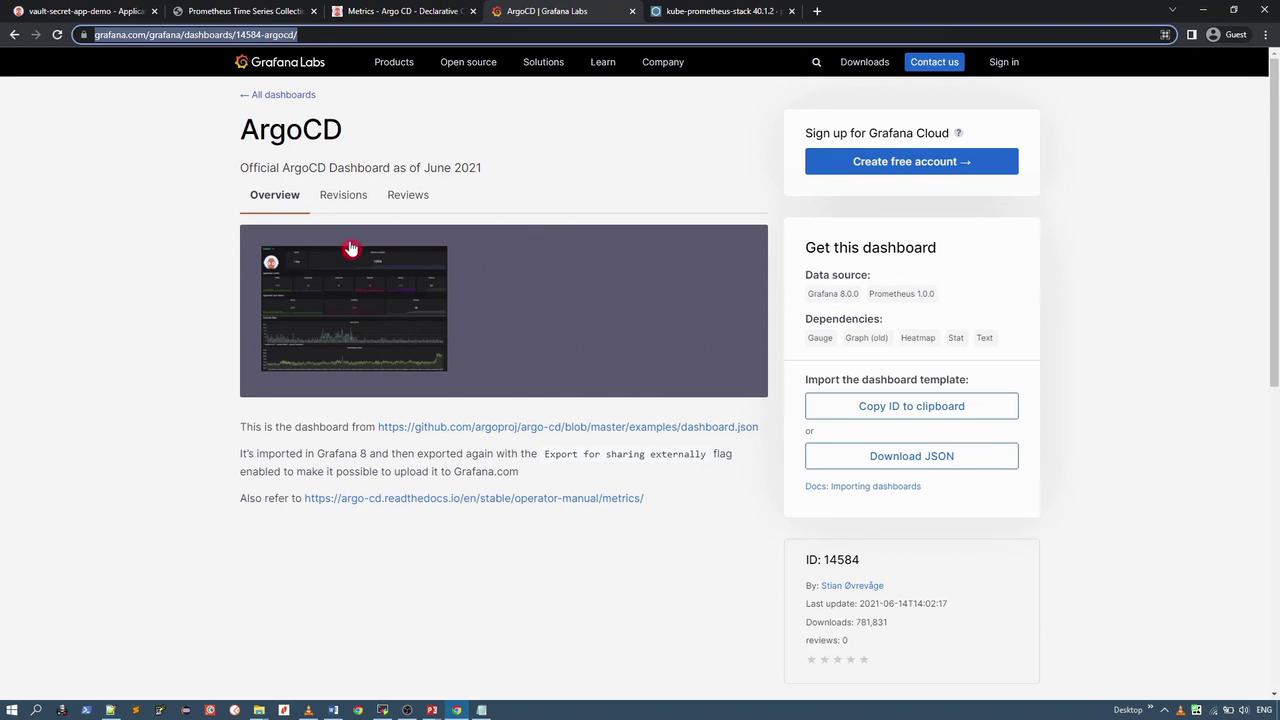
Grafana offers rich visual dashboards to analyze these metrics. The recommended ArgoCD Grafana dashboard displays application health, sync status, component statistics, and more.
For reference, the image below shows a portion of the ArgoCD Grafana dashboard:
### Steps to Access the Grafana Dashboard
1. **Identify the Grafana Service:**\
Locate the Grafana service in the `monitoring` namespace. By default, it is a ClusterIP service; modify it to a NodePort for external access if needed. Use the following command to edit the service:
```bash theme={null}
kubectl -n monitoring edit svc my-kube-prometheus-stack-grafana
```
2. **Access Grafana:**\
After changing the service to NodePort (e.g., port 31762), navigate to the URL:\
http\://\:31762
3. **Log In:**\
The default username is `admin`. Retrieve the password from the Grafana secret using:
```bash theme={null}
kubectl -n monitoring get secret my-kube-prometheus-stack-grafana -o json | jq -r '.data["admin-password"]' | base64 --decode
```
4. **Import the ArgoCD Dashboard:**\
Click on the “+” icon in Grafana and select “Import.” You can import the ArgoCD dashboard using its ID or by supplying a JSON file. For example, import directly from this link:\
[ArgoCD Grafana Dashboard](https://grafana.com/grafana/dashboards/149/argocd/)
After importing, you will see a comprehensive dashboard that displays metrics such as application status, sync performance, and overall health.
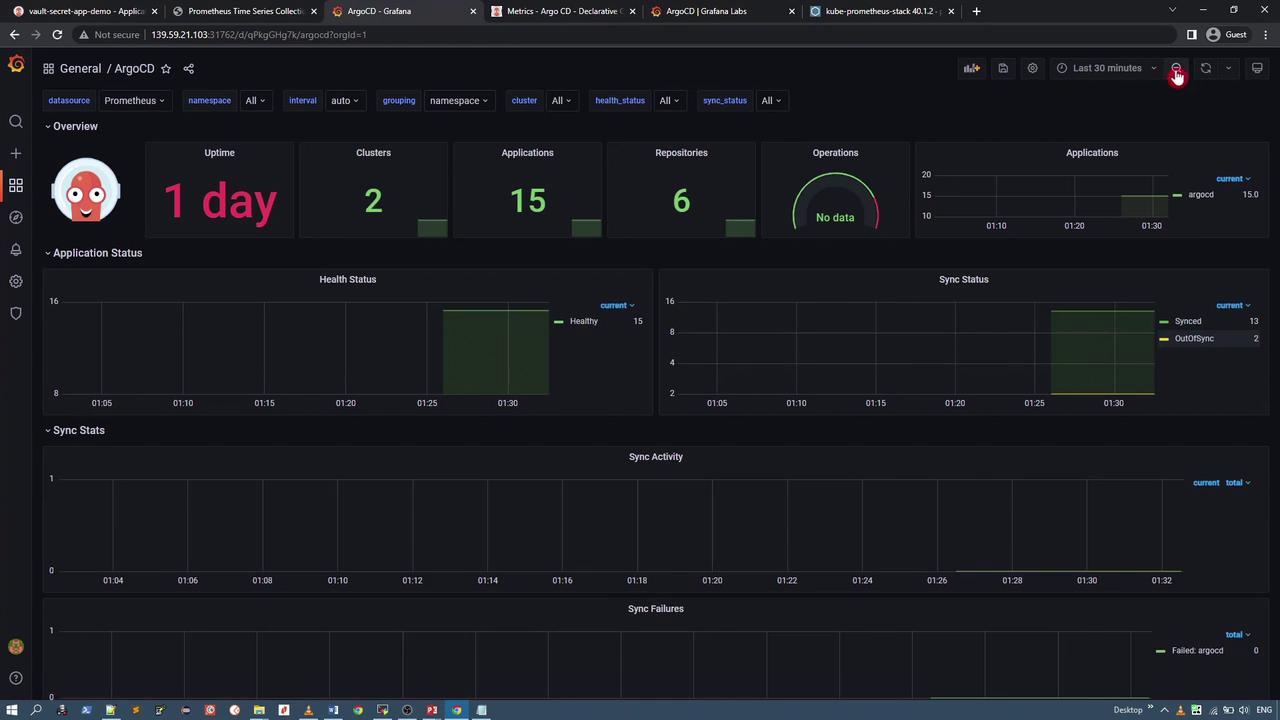
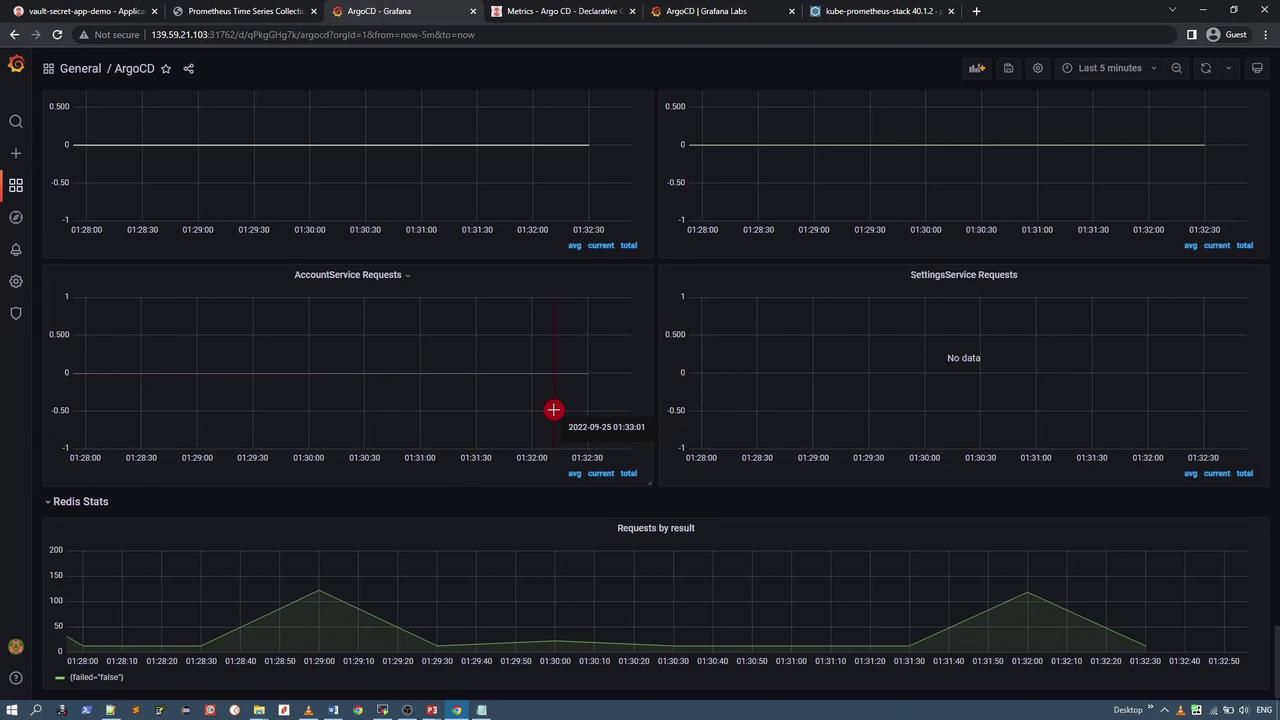
This Grafana dashboard provides actionable insights for both operations and development teams by summarizing the health, performance, and synchronization status of your ArgoCD-managed applications.
***
## Conclusion
In this lesson, we have shown you how to expose ArgoCD metrics using Prometheus and visualize these metrics with Grafana. By deploying the Kube Prometheus Stack and integrating ServiceMonitor resources, you can achieve real-time monitoring of your ArgoCD environment, ensuring optimized application delivery and system performance.
Thank you for reading, and happy monitoring!