> ## Documentation Index
> Fetch the complete documentation index at: https://notes.kodekloud.com/llms.txt
> Use this file to discover all available pages before exploring further.
# DEMO Install Kube Prometheus Stack
> This tutorial teaches deploying the Kube Prometheus Stack on Kubernetes using Flux 2 GitOps components for monitoring with Prometheus and Grafana.
In this tutorial, you'll learn how to deploy the Kube Prometheus Stack on Kubernetes using Flux 2 GitOps components. By the end, you'll have Prometheus and Grafana running on your cluster, exposed via `NodePort` services.
## Why Use Flux 2 for Monitoring?
Using Flux 2 to manage your monitoring stack as GitOps ensures:
* Declarative configuration
* Automated drift detection and remediation
* Version control of all resource definitions
## 1. Prepare the Flux Monitoring Manifests
Flux maintains example manifests for the Kube Prometheus Stack in its repository under `manifests/monitoring/kube-prometheus-stack`:
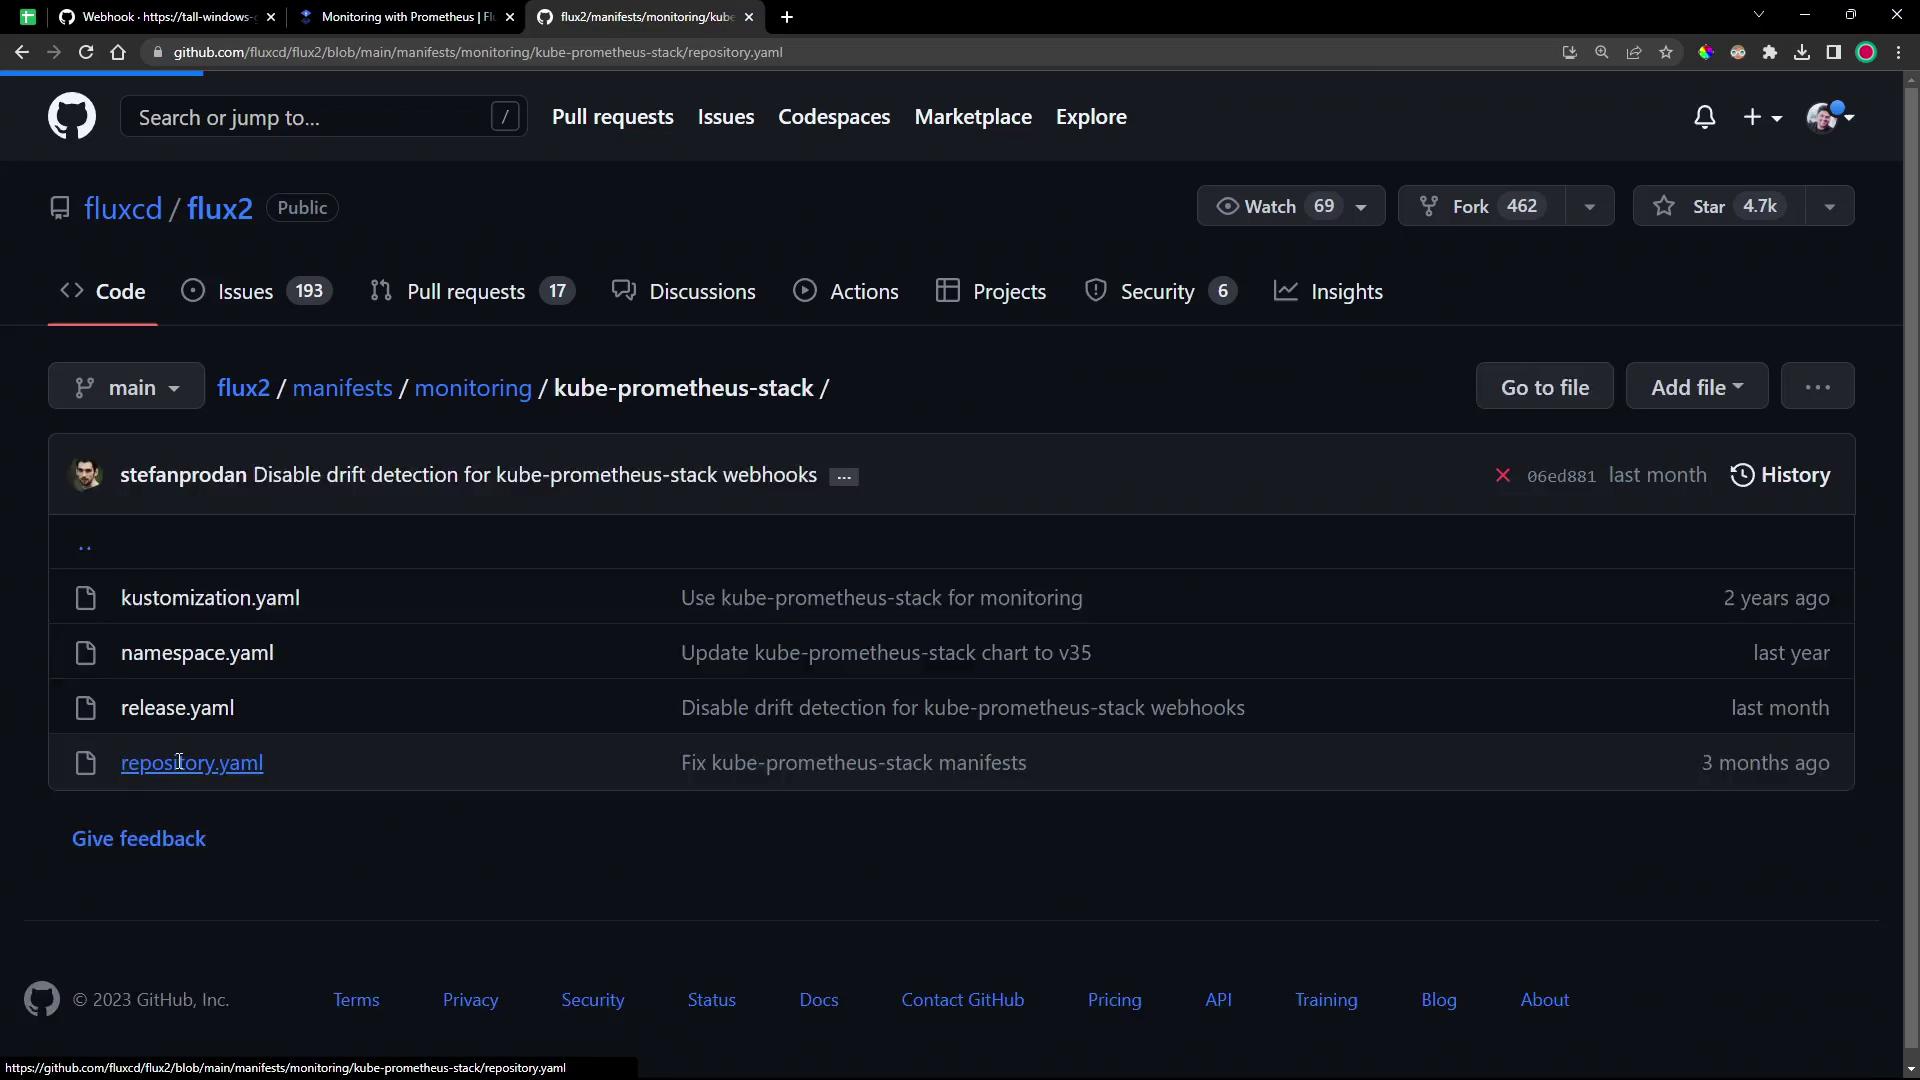
Here are the two key resources you will apply:
### a. HelmRepository
This resource fetches the Helm charts from the [Prometheus Community Helm Repository](https://prometheus-community.github.io/helm-charts):
```yaml theme={null}
apiVersion: source.toolkit.fluxcd.io/v1beta2
kind: HelmRepository
metadata:
name: prometheus-community
spec:
interval: 120m
# OCI builds for kube-prometheus-stack have been temporarily disabled:
# https://github.com/prometheus-community/helm-charts/issues/2940
type: default
url: https://prometheus-community.github.io/helm-charts
```
### b. HelmRelease
The `HelmRelease` installs version `0.45.x` of the `kube-prometheus-stack` chart into the `monitoring` namespace. It also configures custom retention and resource requests:
```yaml theme={null}
apiVersion: helm.toolkit.fluxcd.io/v2beta1
kind: HelmRelease
metadata:
name: kube-prometheus-stack
namespace: monitoring
spec:
interval: 5m
chart:
spec:
chart: kube-prometheus-stack
version: "45.x"
sourceRef:
kind: HelmRepository
name: prometheus-community
interval: 60m
install:
crds: Create
upgrade:
crds: CreateReplace
values:
alertmanager:
enabled: false
prometheus:
prometheusSpec:
retention: 24h
resources:
requests:
cpu: 200m
memory: 200Mi
podMonitorNamespaceSelector: {}
podMonitorSelector:
matchLabels:
app.kubernetes.io/component: monitoring
```
Defining `crds: Create` ensures that all CustomResourceDefinitions required by the chart are installed before the HelmRelease.
## 2. Deploy the Flux Resources
In your cluster Git repository (for example, `flux-clusters/dev-cluster`), create the Flux sources and kustomization:
```bash theme={null}
# 1. Create a GitRepository source for the Flux 2 manifests
flux create source git monitoring-source-prometheus-stack \
--url https://github.com/fluxcd/flux2 \
--branch main \
--interval 30m \
--export > monitoring-source-prometheus-stack.yaml
# 2. Create a Kustomization to apply the monitoring directory
flux create kustomization monitoring-kustomization-prometheus-stack \
--source GitRepository/monitoring-source-prometheus-stack \
--path "./manifests/monitoring/kube-prometheus-stack" \
--interval 1h \
--prune \
--export > monitoring-kustomization-prometheus-stack.yaml
# Commit and push to your Git repository
git add .
git commit -m "Add Kube Prometheus Stack monitoring with Flux 2"
git push
```
Make sure the `monitoring` namespace does not already exist or is managed by another tool, as Flux will create it.
| Resource | Purpose | Flux CLI Example |
| -------------- | ------------------------------------------------- | -------------------------------------------------------------- |
| GitRepository | Point Flux at a Git repo for manifests | `flux create source git ...` |
| Kustomization | Apply resources from a source directory | `flux create kustomization ...` |
| HelmRepository | Download Helm charts from an OCI or HTTP endpoint | Defined in `monitoring/kube-prometheus-stack/helmrepo.yaml` |
| HelmRelease | Install and manage a Helm chart | Defined in `monitoring/kube-prometheus-stack/helmrelease.yaml` |
## 3. Verify Deployment
After Flux syncs, confirm that the `monitoring` namespace and its resources are created:
```bash theme={null}
kubectl get ns
# ...
monitoring Active 30s
kubectl get all -n monitoring
# Should list Deployments, StatefulSets, DaemonSets and Services for Prometheus and Grafana
```
## 4. Expose Prometheus and Grafana
By default, both Prometheus and Grafana services use `ClusterIP`. To access them externally, switch to `NodePort`:
```bash theme={null}
kubectl -n monitoring edit svc kube-prometheus-stack-prometheus
kubectl -n monitoring edit svc kube-prometheus-stack-grafana
kubectl -n monitoring get svc
```
Example output:
```bash theme={null}
NAME TYPE CLUSTER-IP PORT(S) AGE
kube-prometheus-stack-grafana NodePort 10.99.232.155 80:31921/TCP 5m
kube-prometheus-stack-prometheus NodePort 10.97.179.234 9090:30753/TCP 5m
# ...
```
## 5. Access the Prometheus UI
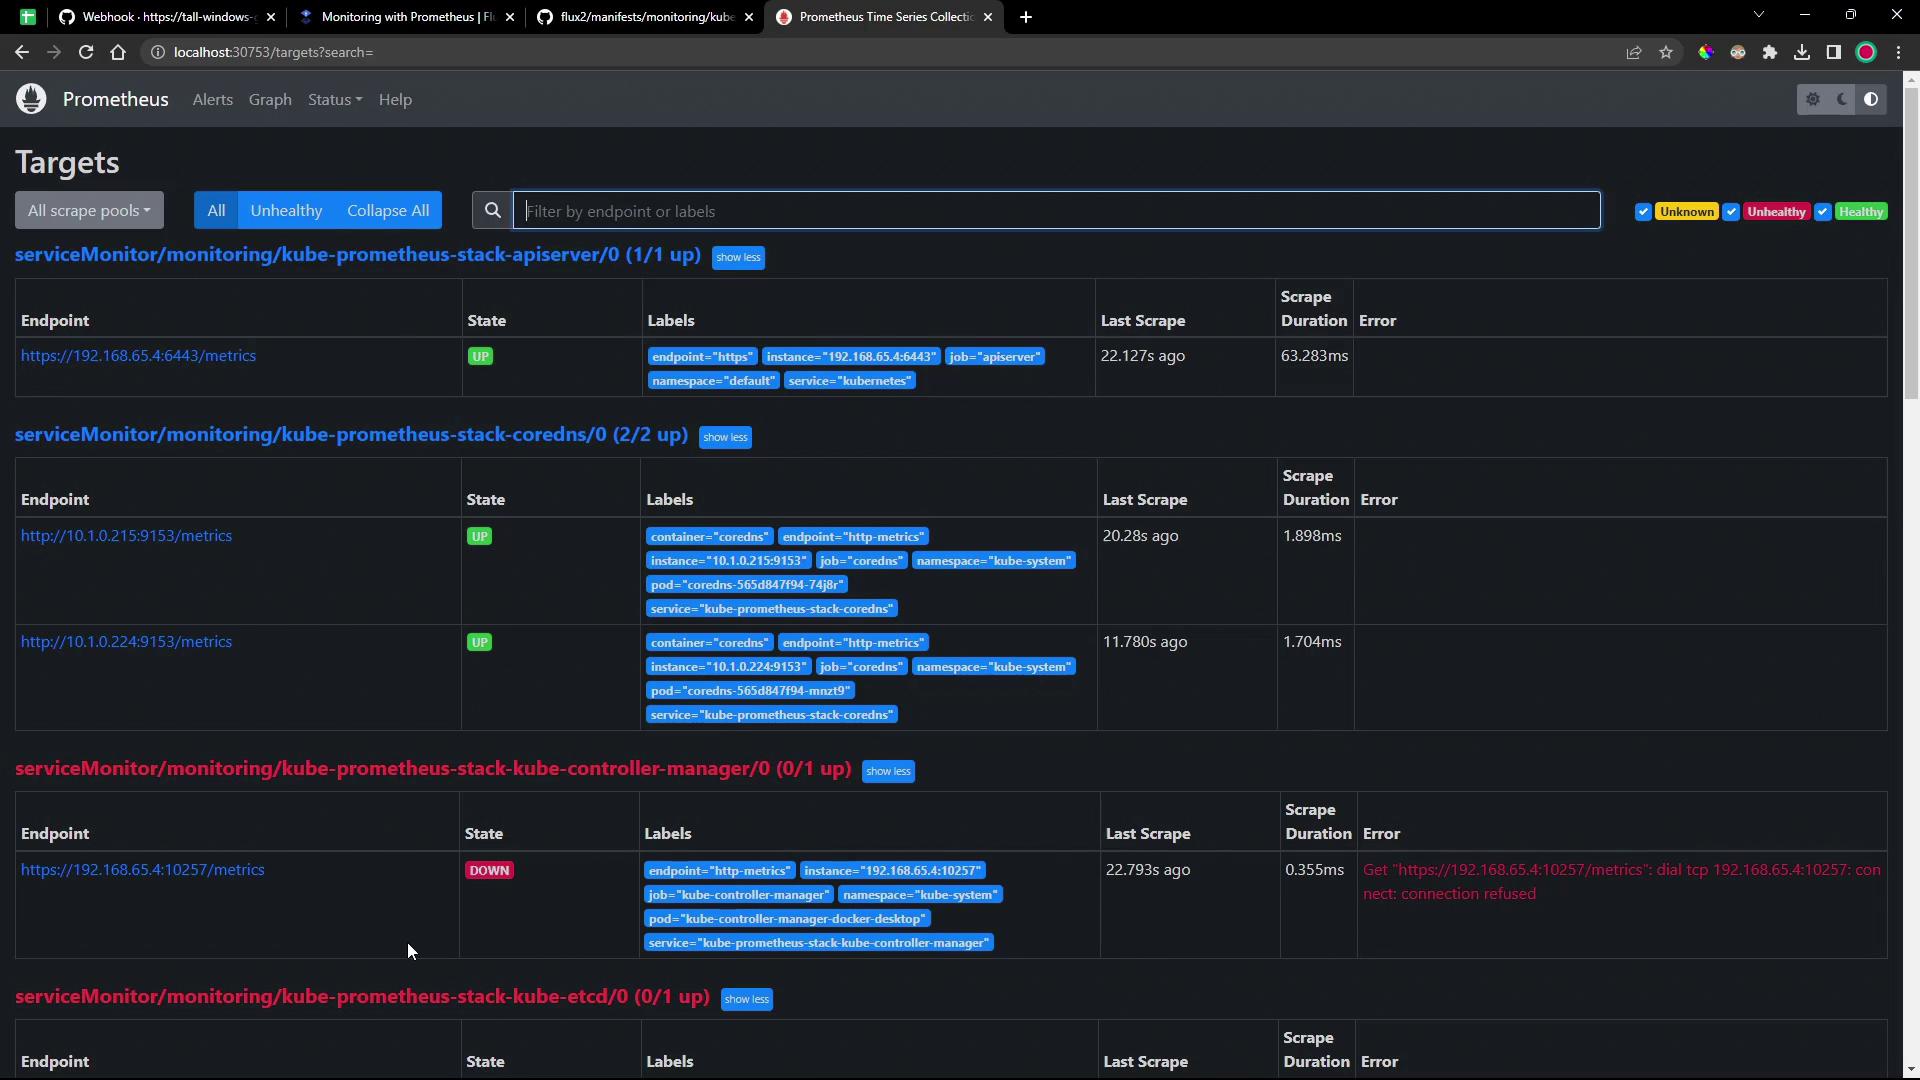
Open the Prometheus interface in your browser at `http://:30753`. The dashboard displays service monitor health:
## 6. Access the Grafana Dashboard
Visit `http://:31921` and log in with credentials stored in the `kube-prometheus-stack-grafana` secret:
```bash theme={null}
kubectl -n monitoring get secret kube-prometheus-stack-grafana -o yaml
```
Decode the base64 values:
```bash theme={null}
echo # YWRtaW4= -> admin
echo # cHJvbS1hZG1pbi1vcGVyYXRvcg== -> prom-admin-operator
```
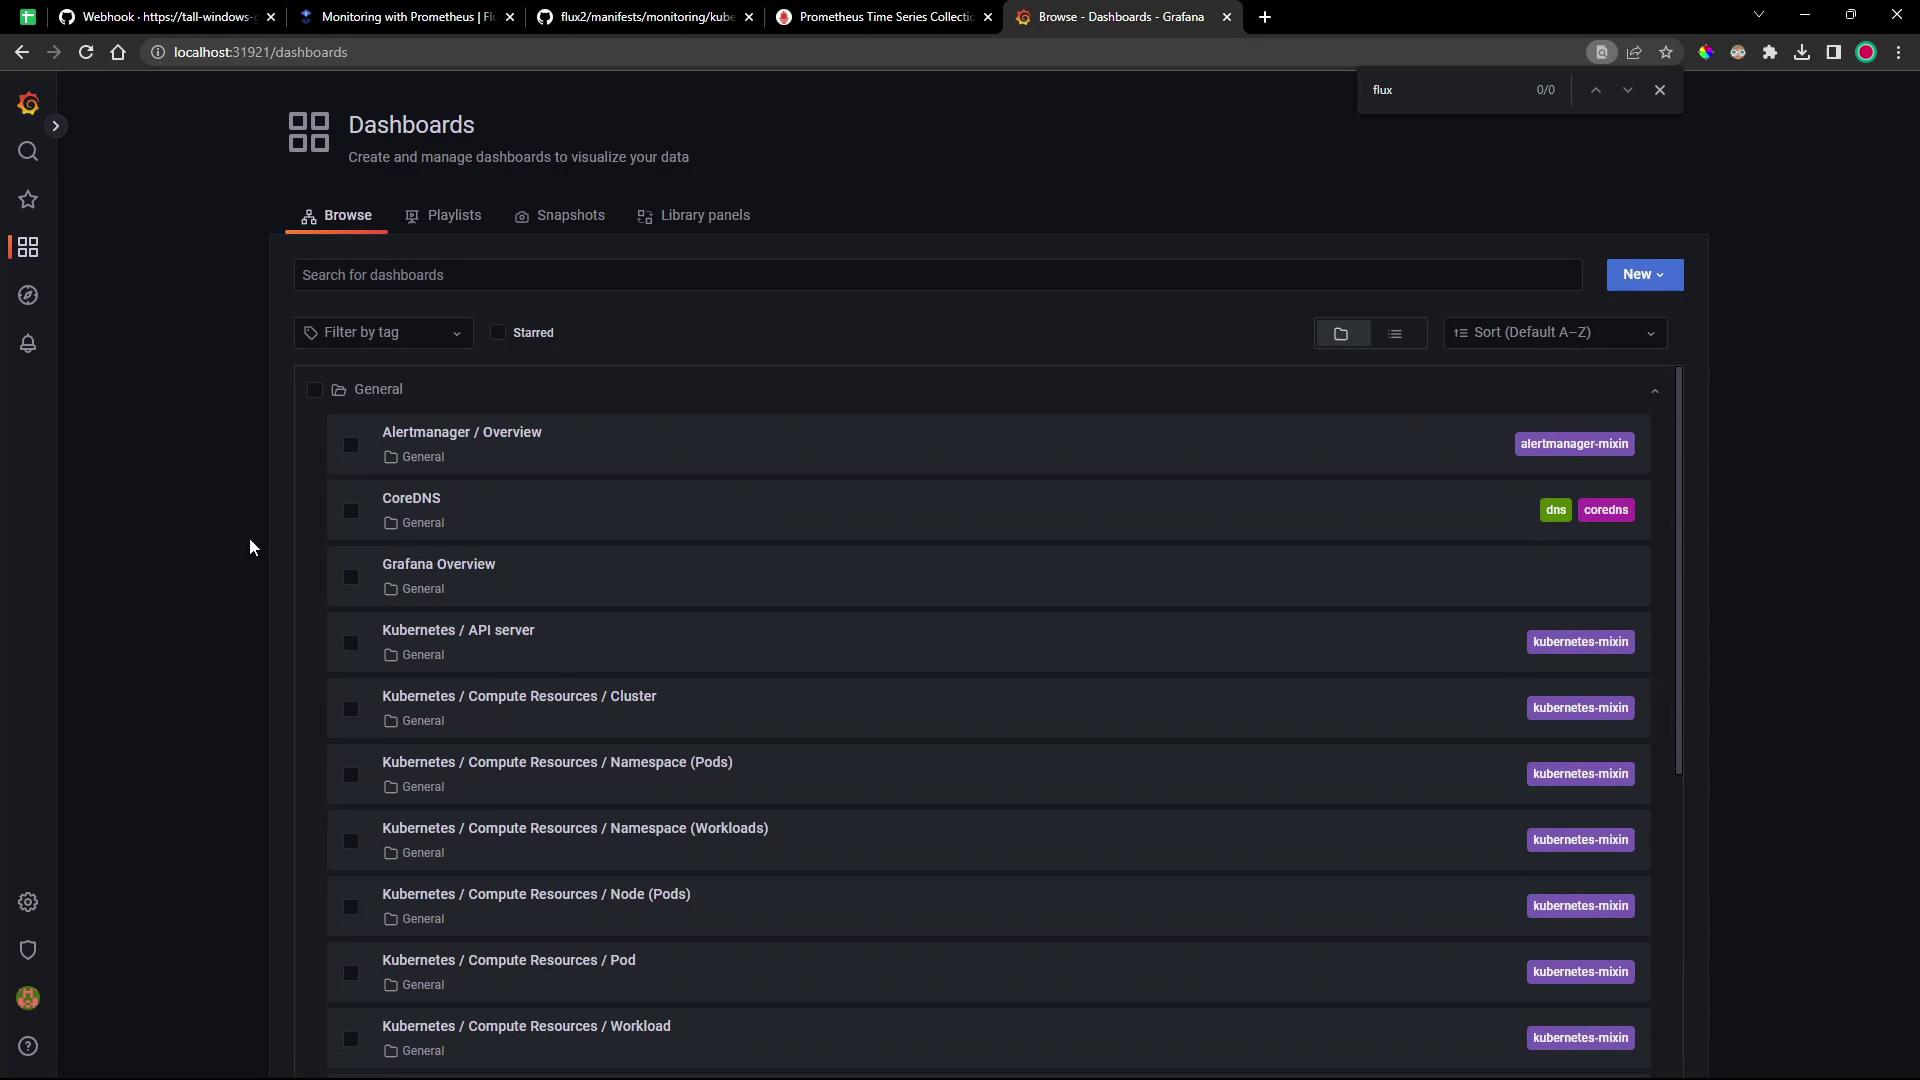
Initially, no Flux-specific dashboards are available:

However, you can browse the built-in Kubernetes monitoring dashboards:
## 7. Explore Prometheus Targets
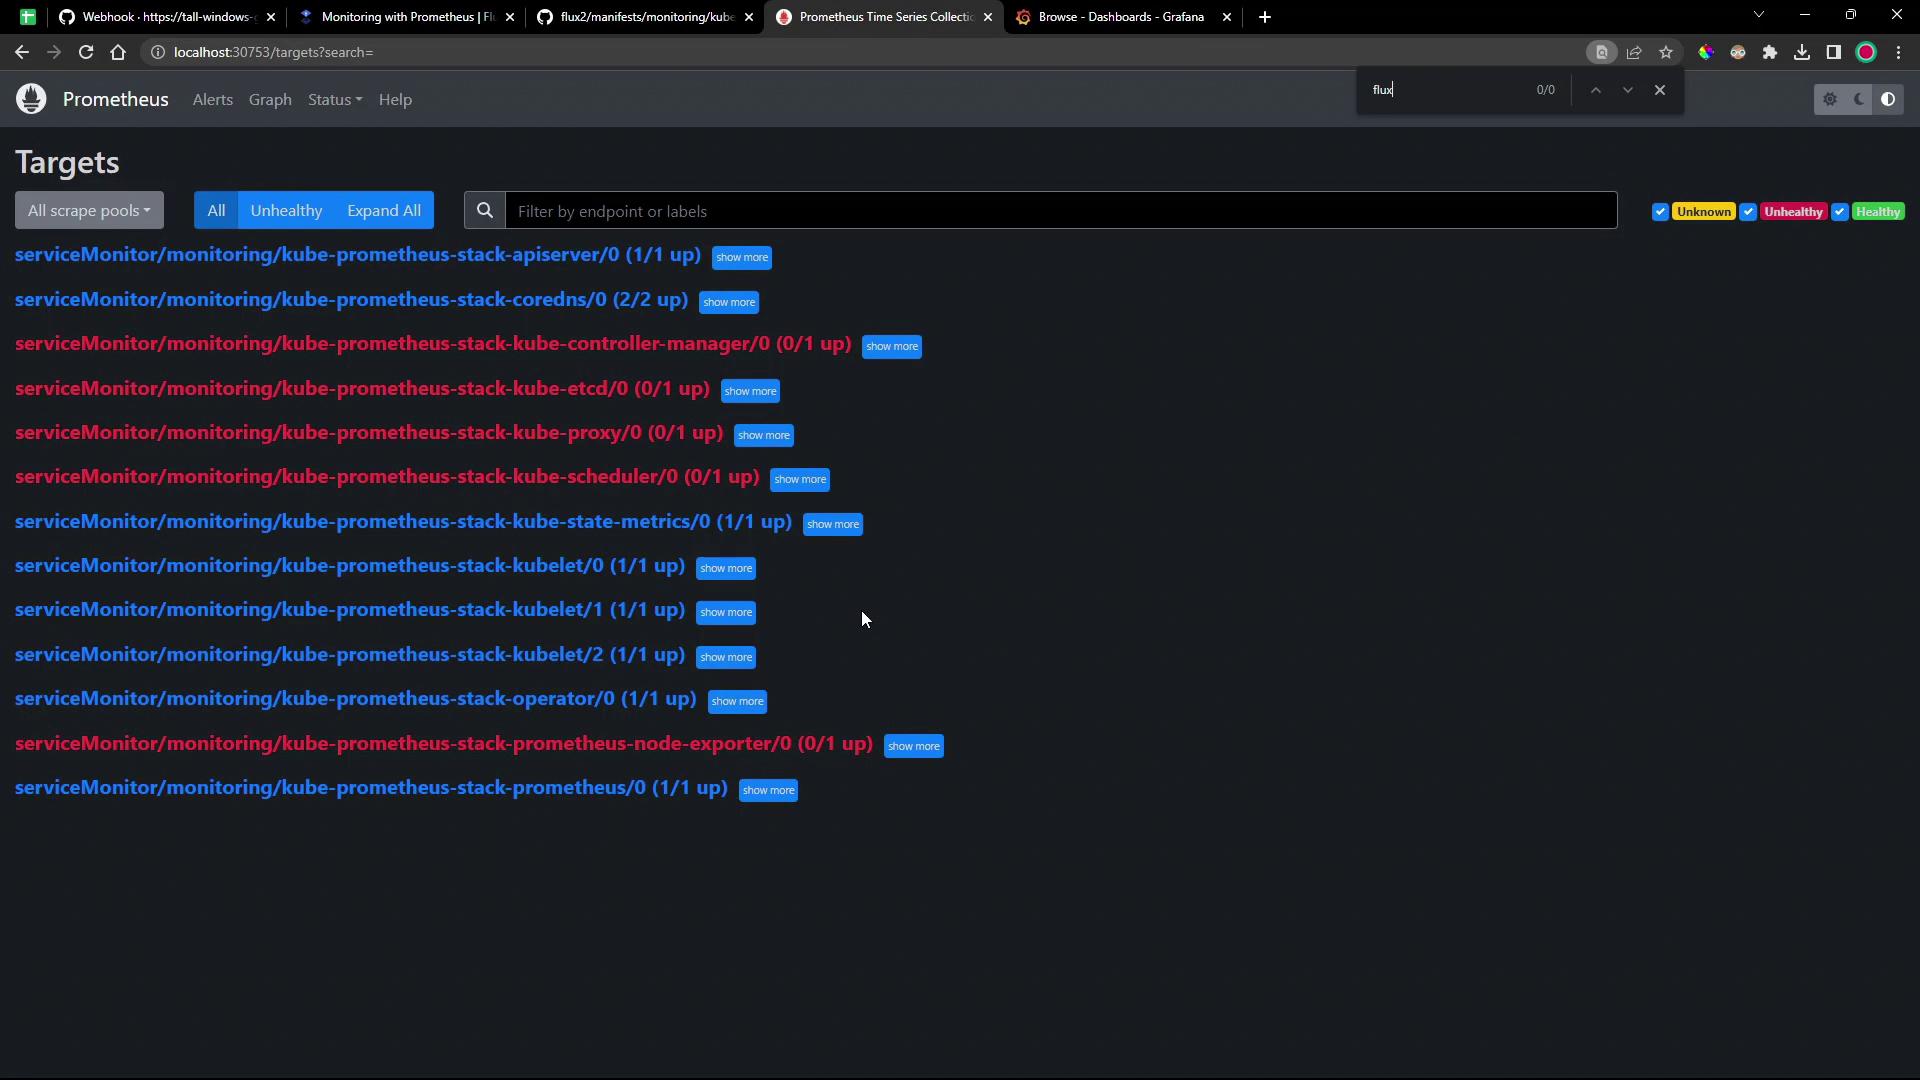
Check the Prometheus `/targets` page to see which endpoints are scraped:
## Next Steps
* Configure `ServiceMonitor` resources to scrape Flux controllers.
* Deploy custom Grafana dashboards for Flux metrics.
* Integrate alerts into your incident management workflow.
## References
* [Flux GitRepository Source Documentation](https://fluxcd.io/docs/components/source/gitrepository/)
* [Flux Kustomization Documentation](https://fluxcd.io/docs/components/kustomize/kustomization/)
* [Prometheus Community Helm Charts](https://prometheus-community.github.io/helm-charts)
* [Kube Prometheus Stack on Artifact Hub](https://artifacthub.io/packages/helm/prometheus-community/kube-prometheus-stack)