> ## Documentation Index
> Fetch the complete documentation index at: https://notes.kodekloud.com/llms.txt
> Use this file to discover all available pages before exploring further.
# DEMO Monitor Flux using Prometheus Grafana
> This guide explains how to integrate Prometheus with Flux v2 for monitoring and visualizing metrics in Grafana.
In this guide, you’ll learn how to integrate [Prometheus](https://prometheus.io/) with Flux v2 to scrape controller metrics and visualize them in [Grafana](https://grafana.com/). We’ll leverage the `monitoring` folder from the [fluxcd/flux2 GitHub repo](https://github.com/fluxcd/flux2) and deploy a `PodMonitor` CRD and Grafana dashboards via Flux Kustomizations.
## 1. Explore the monitoring directory
Clone or browse the Flux repository and locate the `monitoring` folder:
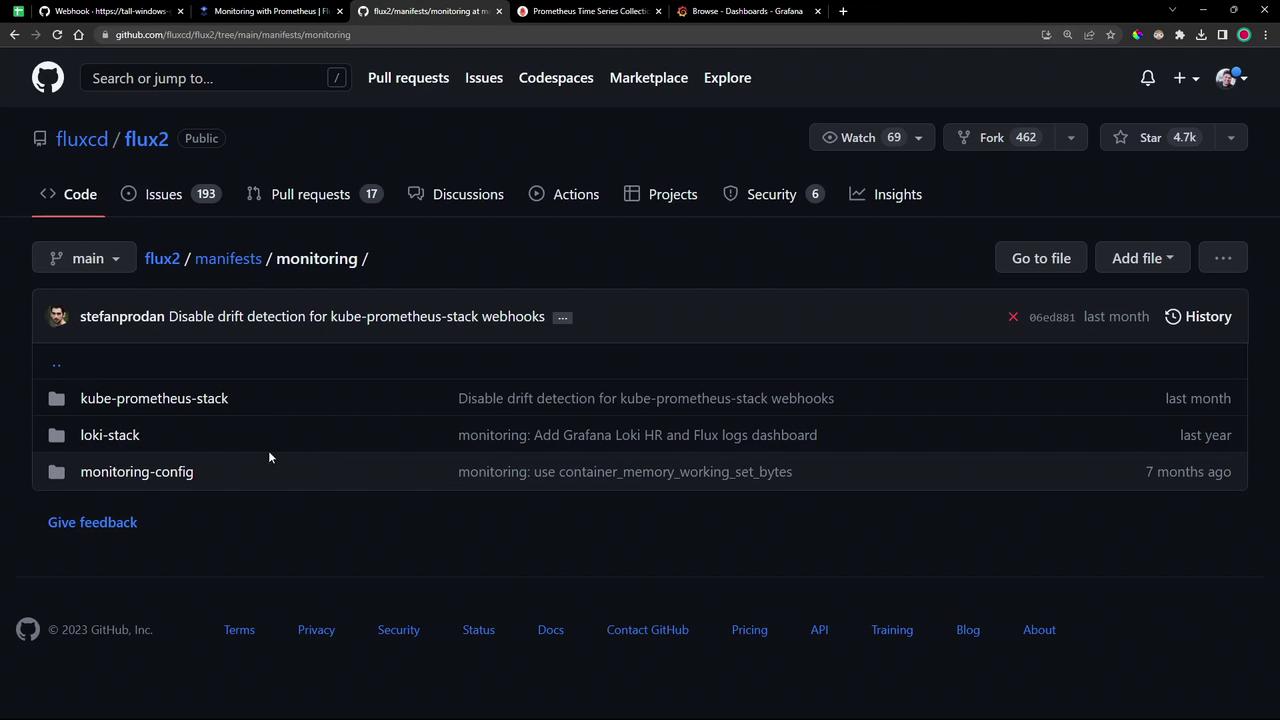
Inside `monitoring/` you’ll find:
* **PodMonitor** YAML for scraping all Flux controllers.
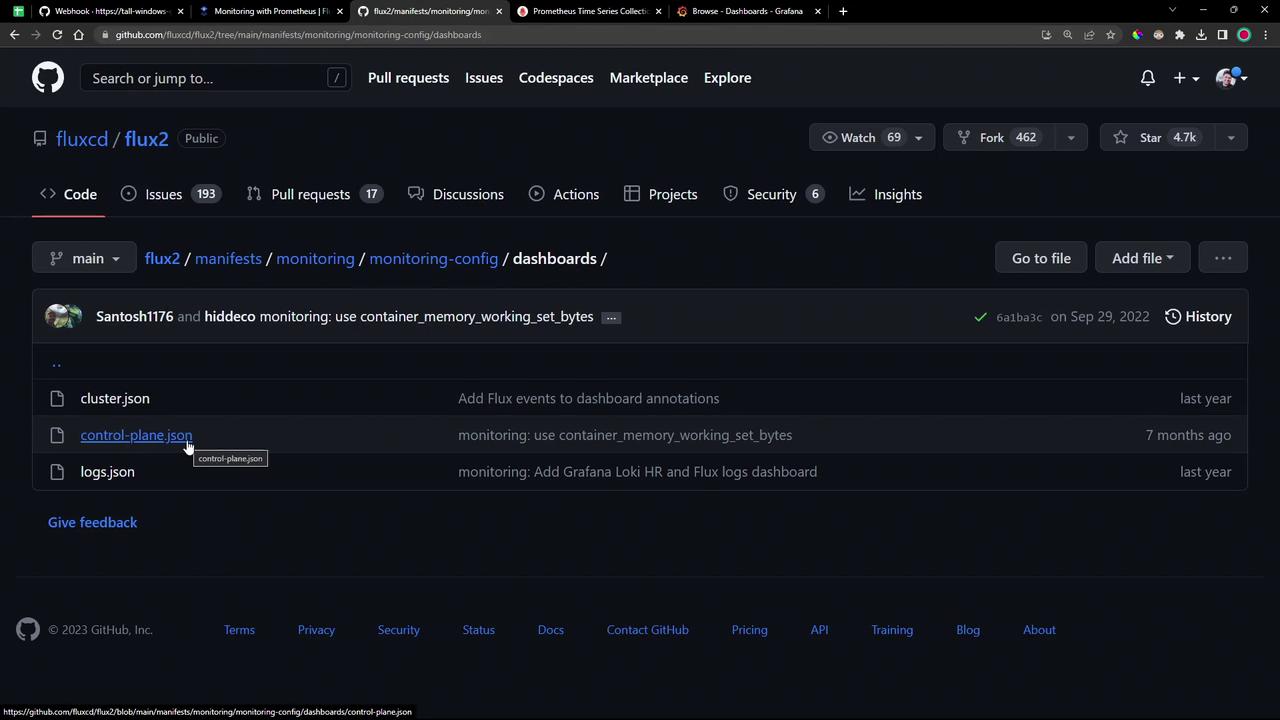
* A `dashboards/` folder with two Grafana JSON files:
* `cluster.json`
* `controlplane.json`
## 2. Apply the Flux PodMonitor
The `PodMonitor` CRD instructs Prometheus to scrape metrics from Flux controllers in the `flux-system` namespace:
```yaml theme={null}
apiVersion: monitoring.coreos.com/v1
kind: PodMonitor
metadata:
name: flux-system
namespace: flux-system
labels:
app.kubernetes.io/part-of: flux
app.kubernetes.io/component: monitoring
spec:
namespaceSelector:
matchNames:
- flux-system
selector:
matchExpressions:
- key: app
operator: In
values:
- helm-controller
- source-controller
- kustomize-controller
- notification-controller
- image-automation-controller
- image-reflector-controller
podMetricsEndpoints:
- port: http-prom
relabelings: []
```
Ensure the Prometheus Operator and its CRDs (including `PodMonitor`) are installed (for example via the `kube-prometheus-stack`).
Apply it directly or via Flux:
```bash theme={null}
kubectl apply -f monitoring/manifests/monitoring-config/podmonitor.yaml
```
## 3. Create a Flux Kustomization
Automate the deployment by defining a Flux `Kustomization` that points to your Git source:
```yaml theme={null}
apiVersion: kustomize.toolkit.fluxcd.io/v1beta2
kind: Kustomization
metadata:
name: monitoring-config
namespace: flux-system
spec:
dependsOn:
- name: monitoring-kustomization-prometheus-stack
interval: 1h0m0s
path: ./manifests/monitoring/monitoring-config
prune: true
sourceRef:
kind: GitRepository
name: monitoring-source-prometheus-stack
```
You can export this with the Flux CLI:
```bash theme={null}
flux create kustomization monitoring-config \
--namespace flux-system \
--depends-on monitoring-kustomization-prometheus-stack \
--interval 1h0m0s \
--path "./manifests/monitoring/monitoring-config" \
--prune=true \
--source GitRepository/monitoring-source-prometheus-stack \
--export > monitoring-config.yaml
```
Commit and push:
```bash theme={null}
git add manifests/monitoring/monitoring-config
git commit -m "Add Flux PodMonitor and Grafana dashboards"
git push
```
Reconcile the Git source and kustomization:
```bash theme={null}
flux reconcile source git flux-system --namespace flux-system
flux reconcile kustomization monitoring-config --namespace flux-system
```
Verify the PodMonitor is ready:
```bash theme={null}
kubectl get podmonitor -n flux-system
```
## 4. Validate in Prometheus
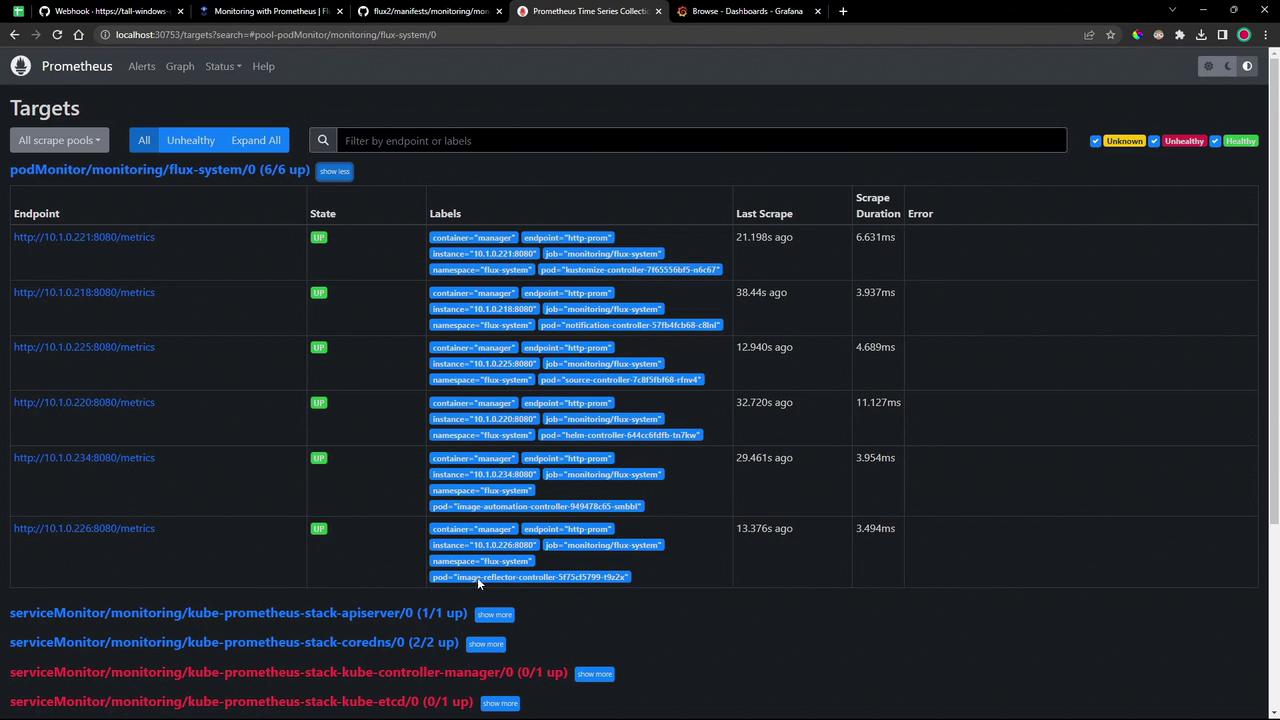
Open your Prometheus UI and go to **Status → Targets**. Within seconds, the Flux controller endpoints should appear as `UP`:
### Common `gotk_` Queries
| Query | Description |
| -------------------------------------------------------- | ------------------------------------------- |
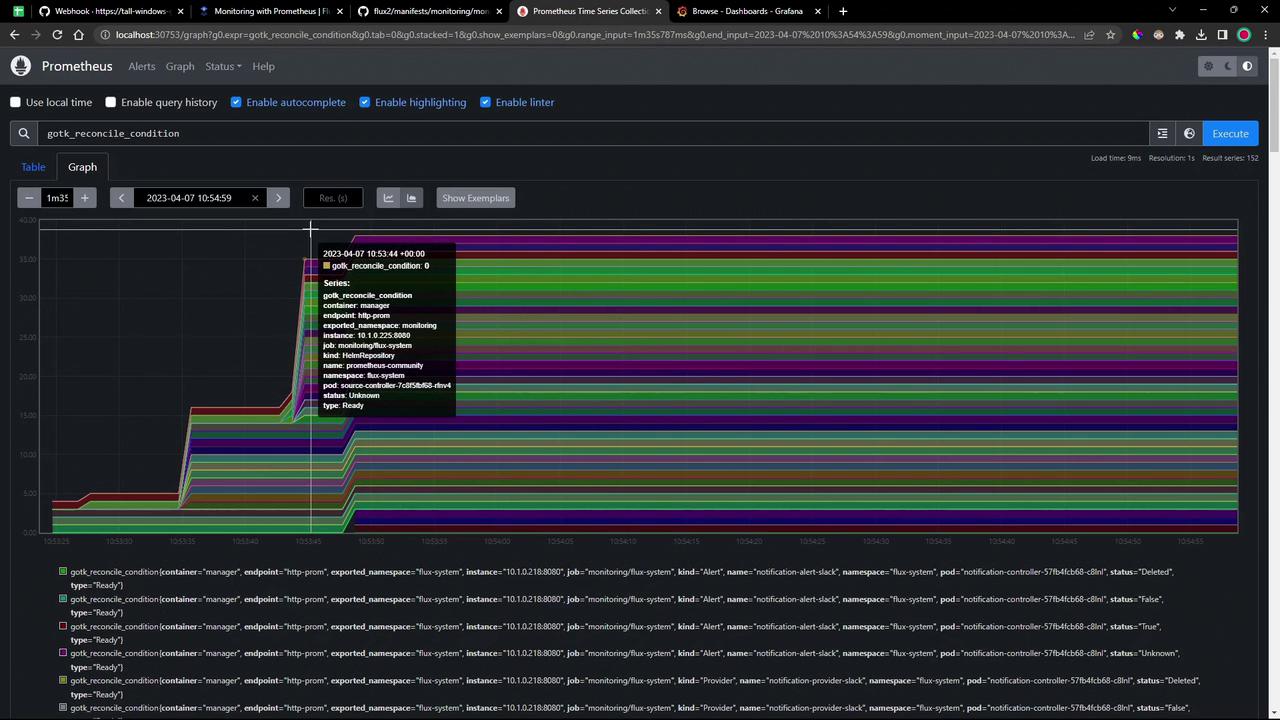
| `gotk_reconcile_condition{type="Ready", status="True"}` | Count of successful reconciliations |
| `gotk_reconcile_condition{type="Ready", status="False"}` | Count of failed reconciliations |
| `gotk_suspend_status` | Suspension state of Git sources/controllers |
| `gotk_reconcile_duration_seconds_bucket` | Histogram buckets for reconcile durations |
| `gotk_reconcile_duration_seconds_sum` | Total reconcile duration |
| `gotk_reconcile_duration_seconds_count` | Number of reconcile operations |
Run any query in **Graph** view to see real-time metrics:
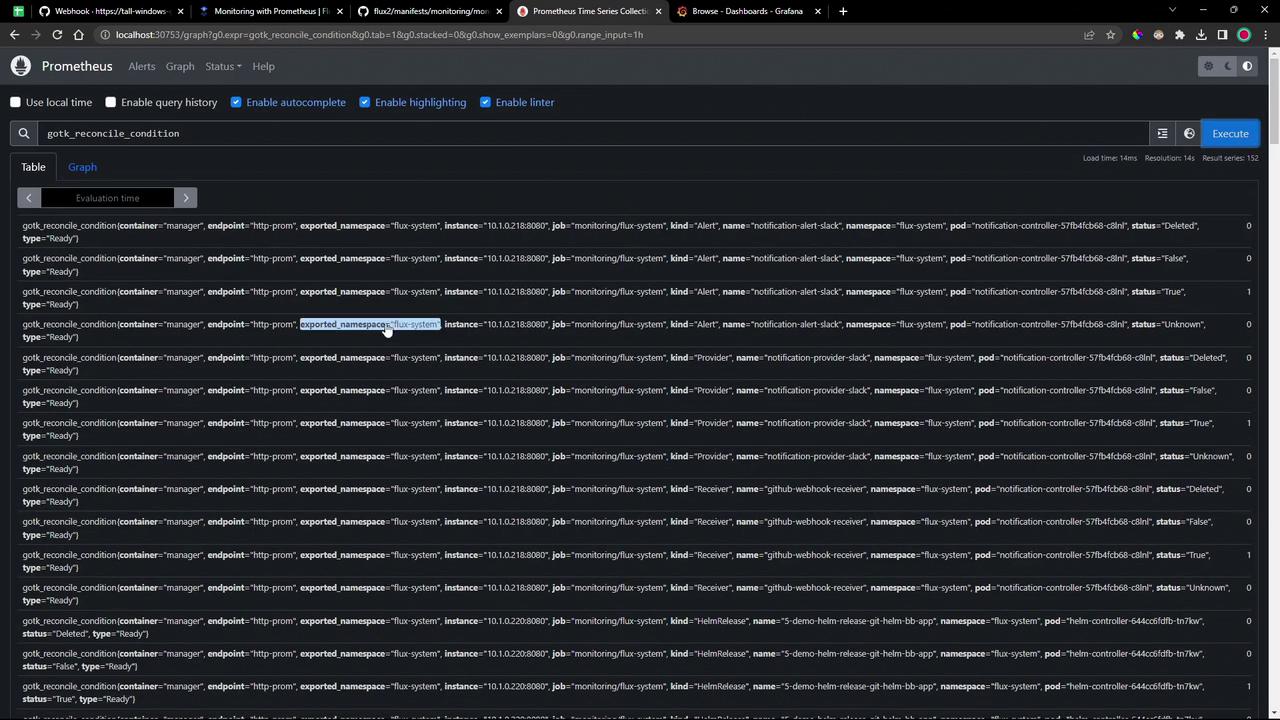
Switch to **Graph** mode for time-series visualization:
## 5. Explore Grafana Dashboards
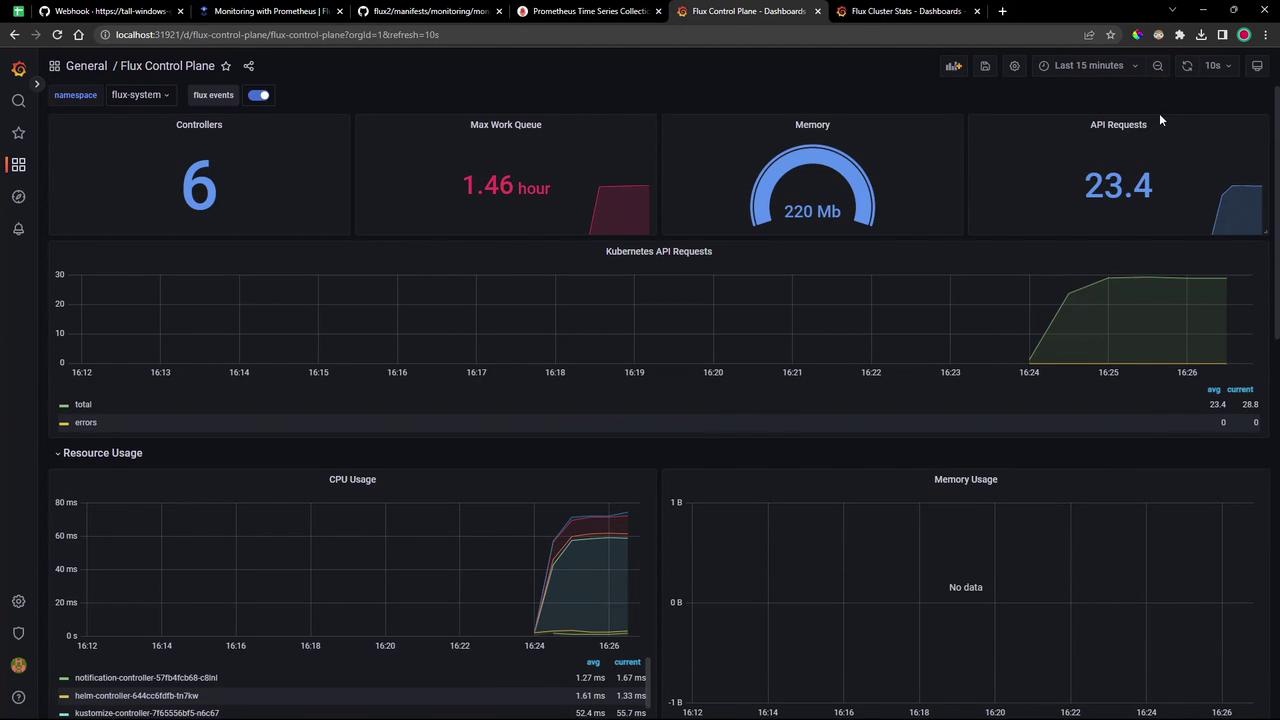
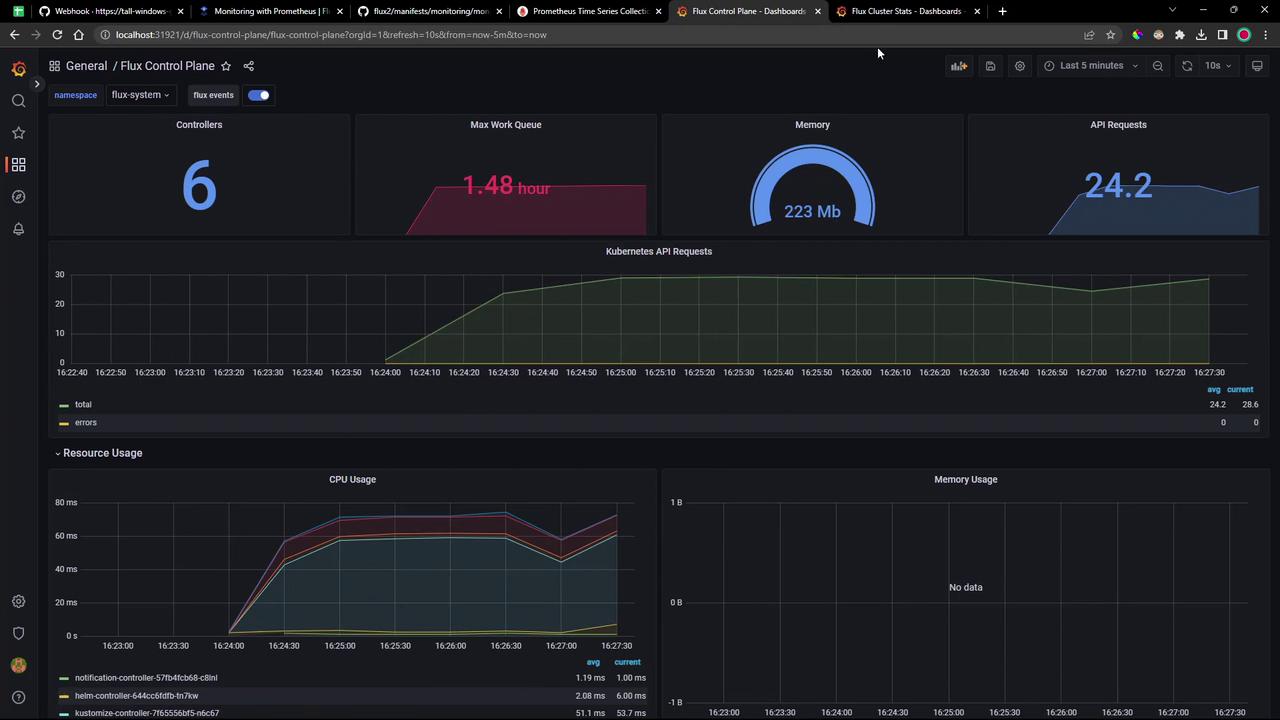
After Flux applies the dashboard JSON, refresh Grafana. Two dashboards are now available:
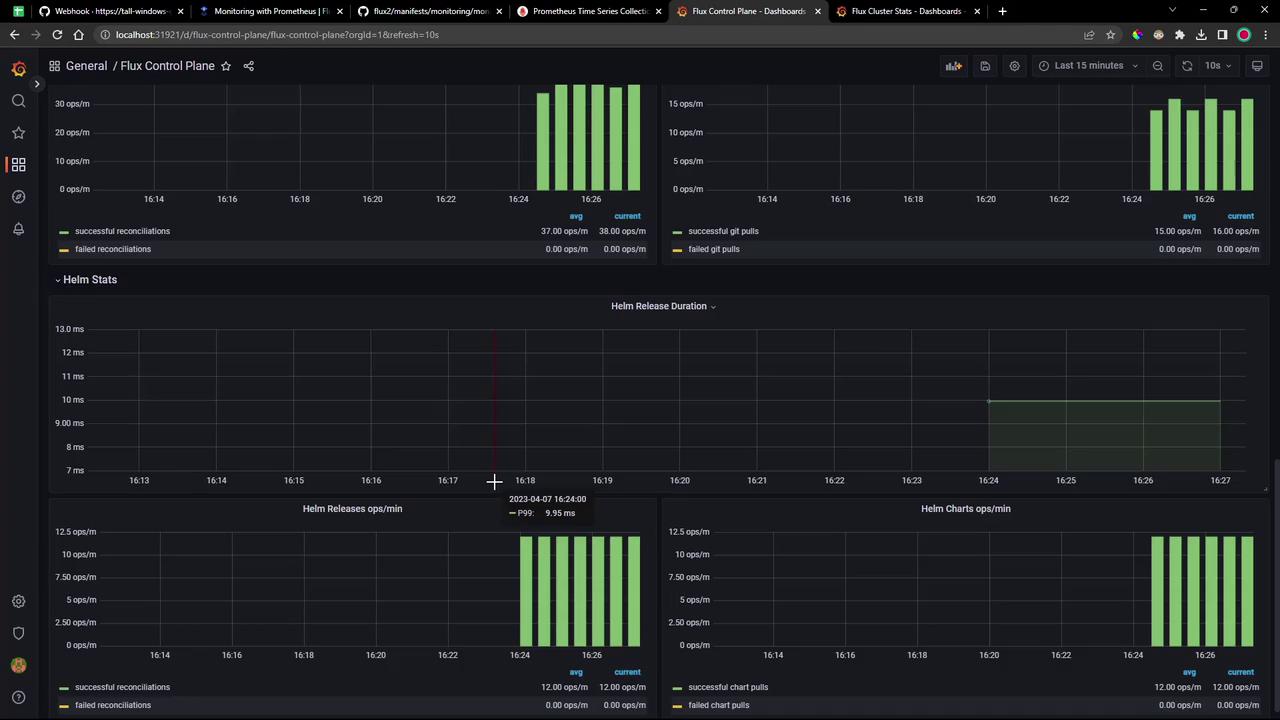
* **Flux Control Plane**
* **Flux Cluster Stats**
### Flux Control Plane
Tracks each controller’s queue lengths, CPU/memory usage, API request rates, and reconciliation durations:
### Flux Cluster Stats
Provides cluster-wide health: counts of reconcilers, failing controllers, manifest source statuses, operation durations, and readiness tables:
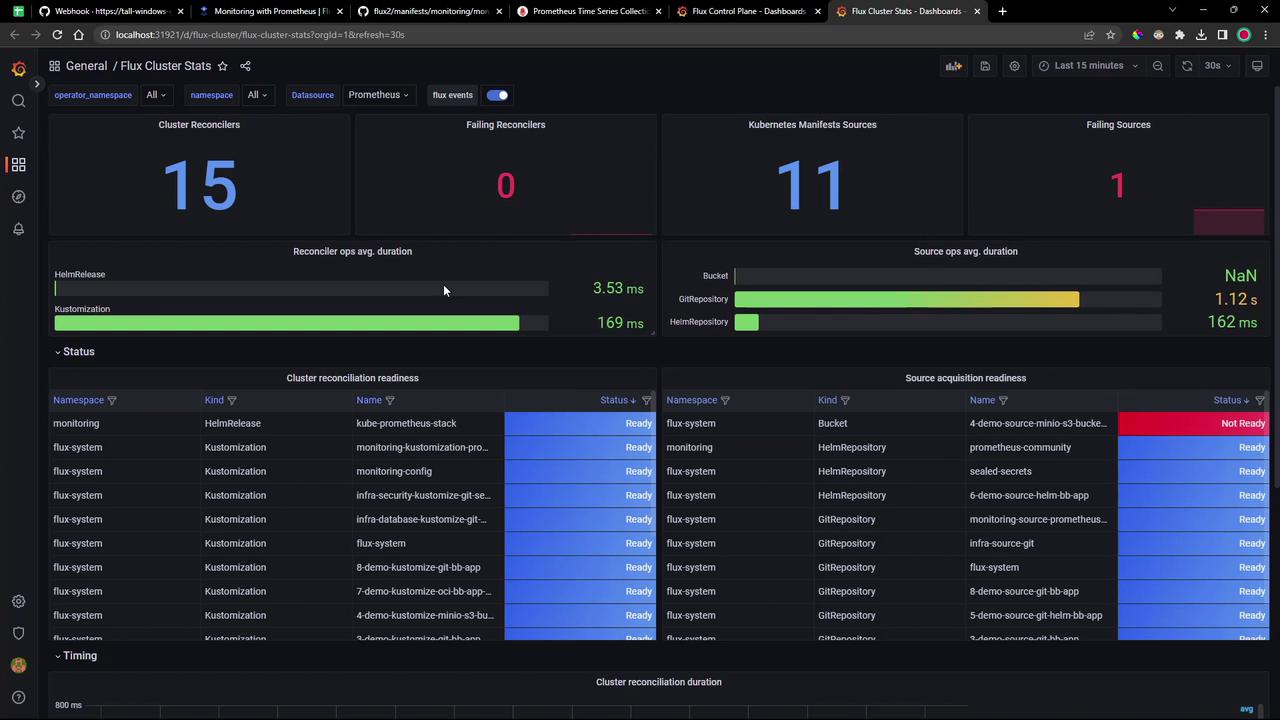
These dashboards ship out of the box—just apply them to get comprehensive visibility into your Flux GitOps workflows.
***
## Links and References
* [Flux v2 Documentation](https://fluxcd.io/docs/)
* [Prometheus Documentation](https://prometheus.io/docs/)
* [Grafana Dashboards](https://grafana.com/grafana/dashboards)
* [GitOps with Flux](https://fluxcd.io/)