> ## Documentation Index
> Fetch the complete documentation index at: https://notes.kodekloud.com/llms.txt
> Use this file to discover all available pages before exploring further.
# ADK Web Interface
> Guide to the ADK web interface for developing, debugging, and tracing agent behavior, demonstrating a minimal agent, local server setup, invocation traces, and UI tools for performance diagnosis.
This article walks through the ADK web interface used for developing, debugging, and iterating on agents. It covers a minimal example agent, how to run the local web server, interpreting invocation traces, and UI features that help you diagnose performance and tool execution.
## Minimal example agent
Below is a minimal Python agent used for the demo. It exposes two simple tool functions: `get_current_time` and `get_current_weather`. In production you would replace these stubs with real API calls; here they return deterministic, hard-coded values so UI behavior and traces are predictable.
```python theme={null}
from google.adk.agents.llm_agent import Agent
def get_current_time(city: str) -> dict:
"""Returns the current time in a specified city."""
return {"status": "success", "city": city, "time": "10:30 AM"}
def get_current_weather(city: str) -> dict:
"""Returns the current weather in a specified city."""
return {"status": "success", "city": city, "weather": "Sunny and 75"}
root_agent = Agent(
model="gemini-3-pro-preview",
name="root_agent",
description="Tells the current time or current weather in a specific city",
instruction="You are a helpful assistant that tells the current time or weather in cities. Use the 'get_current_time' tool to get the current time, and use 'get_current_weather' to get the weather.",
tools=[get_current_time, get_current_weather],
)
```
## Start the ADK web server locally
Run the ADK web UI locally with the CLI:
```bash theme={null}
(.venv) jeremy@MACSTUDIO hello-world % adk web
INFO: Started server process [5481]
INFO: Waiting for application startup.
+-----------------------------------------------------+
| ADK Web Server started |
| |
| For local testing, access at http://127.0.0.1:8000 |
+-----------------------------------------------------+
INFO: Application startup complete.
INFO: Uvicorn running on http://127.0.0.1:8000 (Press CTRL+C to quit)
```
By default the web UI is available at [http://127.0.0.1:8000](http://127.0.0.1:8000). Use it to interact with agents, inspect traces, and test tool behavior before deploying to production.
## Web UI: main controls and indicators
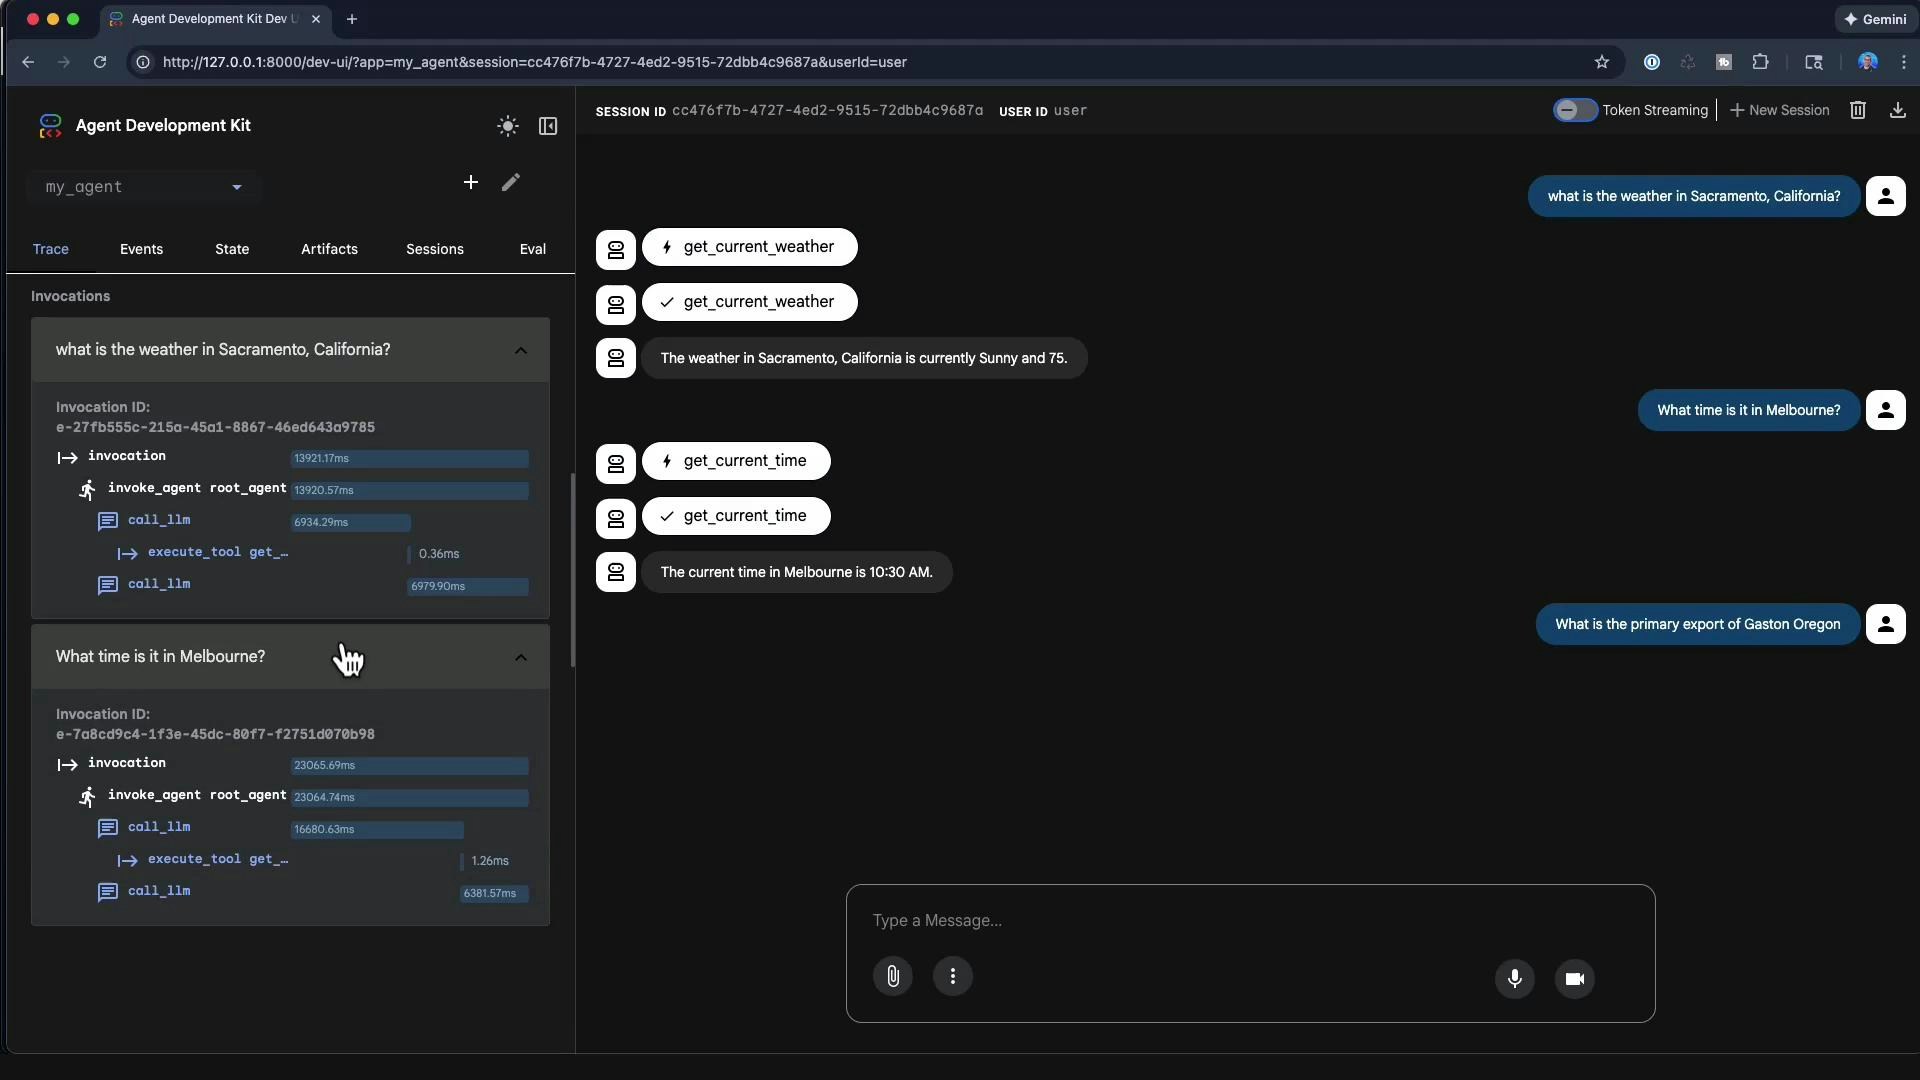
The ADK web interface provides a developer-focused environment for testing agents. Typical controls and indicators include:
| Control / Indicator | Purpose |
| ------------------------------- | ----------------------------------------------------------------------- |
| Session ID & user identity | Tracks the session and user (local runs may show a default user) |
| Token streaming toggle | Toggle streaming of model tokens to the client for live-token debugging |
| Agent selection | Choose among multiple agents available in your environment |
| Create new agents | Create and persist agents directly from the UI |
| Message input & chat history | Interact with the agent and review conversation history |
| Invocation and performance logs | Inspect timing and sequence of LLM calls and tool executions |
These controls help you observe model routing, tool selection, and response composition in real time.
## Example interactions and how tools are selected
Using the minimal agent above:
* If you ask: "What is the weather in Sacramento, California?"
* The LLM routing step selects `get_current_weather`.
* The tool is invoked with `city="Sacramento, California"`.
* The tool returns:
```json theme={null}
{"status": "success", "city": "Sacramento, California", "weather": "Sunny and 75"}
```
* The chat UI displays: "The weather in Sacramento, California is currently sunny and 75."
* If you ask: "What time is it in Melbourne?"
* The LLM selects `get_current_time` and the tool returns `"10:30 AM"` for the provided city.
Because the demo tools return fixed values, results are predictable. Replace the stubs with real APIs and add disambiguation logic to handle ambiguous city names in production.
This demo uses hard-coded tool results. In production, ensure your tools call reliable APIs and implement input disambiguation, timeouts, and retry policies to avoid incorrect or stale outputs.
## Handling queries with no matching tool
If the agent receives a query for which no tool exists (for example, "What is the primary export of Gaston, Oregon?"), the model may try to respond without a tool and appear to hang while generating. To avoid this:
* Implement an explicit fallback path (e.g., respond "I don't have a tool for that, would you like me to search the web?").
* Add a "web lookup" or generic search tool as a fallback.
* Set model/tool timeouts and meaningful error responses.
These measures reduce stalls and produce more predictable UX.
## Traces, logs, and performance analysis
The web UI exposes detailed invocation traces and timing bars that let you inspect where time is being spent (LLM routing vs. tool execution). Each user interaction can show:
* Function-call events and tool executions
* The sequence of LLM calls (routing -> tool -> final response)
* Millisecond-level timing for each phase
Here is a sample invocation trace that routed to `get_current_weather`:
```text theme={null}
Invocation e-27fb555c-215a-45a1-8867-46ed643a9785
I-> invocation (13921.17ms)
└> invoke_agent root_agent (13920.57ms)
call_llm (6934.29ms)
└> execute_tool get_current_weather (0.36ms)
call_llm (6979.90ms)
```
Interpretation tips:
* Compare LLM call durations to tool execution times to determine where latency is occurring.
* Long LLM routing steps may indicate overly large contexts, complex prompt engineering, or model latency.
* Small tool execution times suggest the tool is fast; if user-perceived latency is high, focus on model and network timeouts.
 ## Other useful UI features during development
* Upload local files to include them in the agent's session state or to use as evaluation inputs.
* Edit and persist session state to reproduce scenarios and debug complex flows.
* Use microphone or camera inputs if your agent supports multimodal features.
* Create evaluation sets: curated input/output cases to score and regression-test agent behavior over time.
## Best practices
* Use the ADK web interface as a development and debugging tool — iterate on model prompts, tool definitions, and routing policies here.
* Add robust error handling and explicit "no tool found" responses to avoid apparent hangs.
* Collect evaluation sets and trace logs to measure regressions and improvements after changes.
The ADK web interface is primarily a developer tool for debugging, tracing, and iterating on agents. It is not intended to be the final production UI for an agent; use it to tune tools, traces, and fallbacks before deploying.
## References and further reading
* Agent Development Kit (ADK) — use the ADK web UI to inspect routing, tools, and traces before production.
* Consider adding monitoring, timeouts, and fallbacks to production agents to ensure reliability and responsiveness.
Use the traces and event logs shown in the UI to guide improvements: add fallback responses, a web-lookup tool, and clearer error reporting to make your agent robust for broader queries.
## Other useful UI features during development
* Upload local files to include them in the agent's session state or to use as evaluation inputs.
* Edit and persist session state to reproduce scenarios and debug complex flows.
* Use microphone or camera inputs if your agent supports multimodal features.
* Create evaluation sets: curated input/output cases to score and regression-test agent behavior over time.
## Best practices
* Use the ADK web interface as a development and debugging tool — iterate on model prompts, tool definitions, and routing policies here.
* Add robust error handling and explicit "no tool found" responses to avoid apparent hangs.
* Collect evaluation sets and trace logs to measure regressions and improvements after changes.
The ADK web interface is primarily a developer tool for debugging, tracing, and iterating on agents. It is not intended to be the final production UI for an agent; use it to tune tools, traces, and fallbacks before deploying.
## References and further reading
* Agent Development Kit (ADK) — use the ADK web UI to inspect routing, tools, and traces before production.
* Consider adding monitoring, timeouts, and fallbacks to production agents to ensure reliability and responsiveness.
Use the traces and event logs shown in the UI to guide improvements: add fallback responses, a web-lookup tool, and clearer error reporting to make your agent robust for broader queries.