> ## Documentation Index
> Fetch the complete documentation index at: https://notes.kodekloud.com/llms.txt
> Use this file to discover all available pages before exploring further.
# Looker Studio for Visualization
> Overview of Looker Studio integration with BigQuery and Google Cloud, covering dashboards, real-time connectors, performance and cost best practices for scalable, shareable reporting.
Welcome back. In this lesson we explore Looker Studio — Google's browser-based data visualization and reporting tool — and how it integrates with Google Cloud, especially BigQuery. Looker Studio lets teams build dashboards, charts, and scheduled reports that read live data directly from sources such as [BigQuery](https://cloud.google.com/bigquery) with no client installation and no per-viewer license fees (free tier). This guide explains why it’s widely used, where it fits in an analytics stack, and best practices to keep dashboards performant and cost-effective.
## Why Looker Studio is widely used
* Direct data connectors\
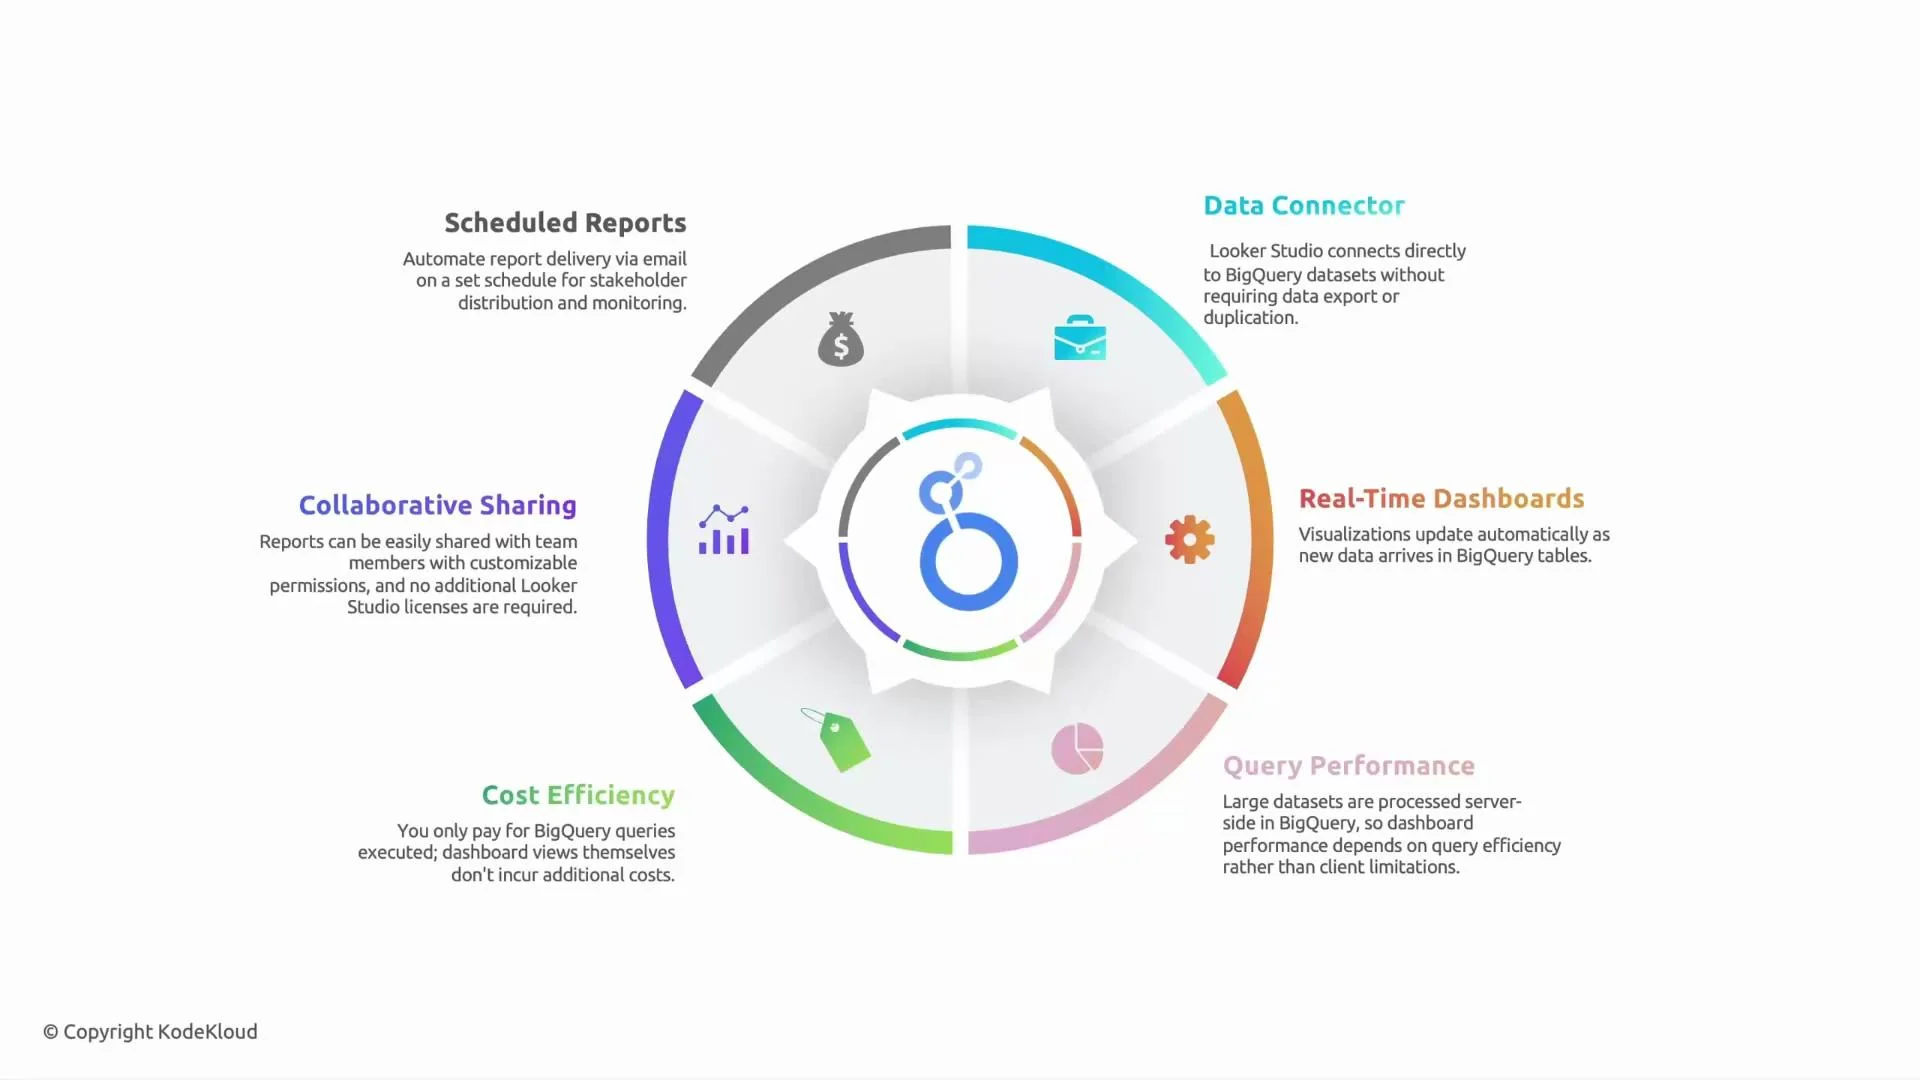
Looker Studio provides native connectors to data platforms like [BigQuery](https://cloud.google.com/bigquery), Google Sheets, and many third-party sources. Dashboards read data directly from the source, eliminating manual exports to CSV or spreadsheets and reducing the chance of data drift or errors.
* Real-time and near-real-time dashboards\
Visualizations can refresh automatically according to connector and cache settings, so dashboards can reflect recent changes—useful for monitoring website traffic, operational metrics, or SLA alerts.
* Server-side processing and performance\
Query execution is delegated to BigQuery (or the connected source). Looker Studio fetches only the data needed for each visualization, so performance depends mainly on query design, BigQuery slot availability, and connector caching. Optimize queries and pre-aggregate when possible to keep latency and query costs down.
* Cost efficiency and billing model\
Looker Studio does not require per-viewer licenses in the free tier. Billing is typically driven by the underlying data platform (for example, BigQuery query costs). This can be attractive for startups, education, and teams that want broad report access without licensing fees. However, poorly optimized dashboards can generate large query volumes and increase costs.
* Sharing, permissions, and collaboration\
Looker Studio uses Google’s sharing model (view, comment, edit). You can share dashboards with individuals, groups, or publicly while controlling access. Scheduled email delivery and embedded reports make distribution straightforward.
* Scheduled delivery and automation\
Reports can be scheduled for email delivery (daily, weekly, monthly) or exported automatically, making it easier to circulate regular summaries without manual intervention.
### Feature summary
| Feature | Benefit | Notes / Best practice |
| --------------------------------- | ----------------------------- | --------------------------------------------------------------------------- |
| Direct BigQuery connector | Live access to warehouse data | Use pre-aggregated tables or materialized views for heavy queries |
| Automatic refresh & caching | Near-real-time dashboards | Tune connector caching and schedule refreshes to balance freshness and cost |
| No per-viewer license (free tier) | Lower upfront reporting costs | Monitor query volume to control BigQuery costs |
| Google sharing model | Simple collaboration | Use groups and service accounts for consistent access control |
Looker Studio is lightweight and integrates smoothly with Google Cloud services — particularly BigQuery — enabling rapid dashboard delivery and easy collaboration. For best results, pair direct queries with aggregation tables, extracts, or scheduled refreshes to reduce latency and cost.
Be mindful of [BigQuery](https://cloud.google.com/bigquery) query costs: visualizations execute queries. Frequent or unoptimized queries can increase your bill. Use query optimization, aggregated tables, extracts/caching, and scheduled refresh intervals to control costs.
 ## Typical use cases and comparison
Looker Studio fits well in many reporting scenarios but is not a one-size-fits-all solution. Use the table below to decide when to choose Looker Studio and when to consider alternatives.
| Use case | Why choose Looker Studio | When to consider alternatives |
| ---------------------------------------- | ---------------------------------------------------------------------- | ----------------------------------------------------------------------------------------------------------------------------------------------------- |
| Operational monitoring / live dashboards | Native connectors and scheduled refreshes support near-real-time views | For sub-second latency or extremely high-frequency updates, consider specialized streaming dashboards |
| Executive and lightweight reporting | Simple sharing, embedding, and scheduled email delivery | If you need heavily customized visuals, advanced analytics, or governance at enterprise scale, consider Tableau, Power BI, or Looker (the platform) |
| Ad-hoc exploration for analysts | Quick visual prototypes & integration with GCP | For deep statistical modeling or complex visualization scripting, use dedicated analytics notebooks or BI tools with advanced visualization libraries |
Common enterprise patterns:
* Use Looker Studio for broad distribution of standardized reports and executive dashboards.
* Use Tableau, Power BI, or Looker (platform) for deep-dive analytics, complex visualizations, or enterprise governance.
* Combine Looker Studio dashboards with BigQuery scheduled aggregations or materialized views to minimize per-report query cost.
## Best practices for performance and cost control
* Pre-aggregate large datasets in BigQuery using scheduled queries or materialized views.
* Limit the number of charts on high-traffic report pages; each chart can trigger queries.
* Use extract-based connectors or cached data sources for views that don’t require real-time freshness.
* Apply filters and data range controls to restrict scanned data.
* Monitor BigQuery usage and set cost alerts or quotas for service accounts used by Looker Studio.
## Quick review question
Which Looker Studio feature allows dashboards to always show updated numbers from [BigQuery](https://cloud.google.com/bigquery) without exporting the data?
Options:
* A) CSV uploads
* B) Real-time data connectivity
* C) Offline storage
* D) Shared drives
Correct answer: B) Real-time data connectivity — Looker Studio connects directly to [BigQuery](https://cloud.google.com/bigquery) and can refresh visualizations automatically as new data arrives (subject to connector and caching settings).
## Conclusion
Looker Studio is a lightweight, cost-effective option for visualization and reporting tightly integrated with Google Cloud. It excels at delivering live dashboards, scheduled reports, and easy collaboration while relying on BigQuery for heavy data processing. Use it for fast, shareable reporting and pair it with advanced analytics tools when deeper analysis or specialized visuals are required.
Further reading and resources:
* [BigQuery documentation](https://cloud.google.com/bigquery)
* [Looker Studio connectors & setup](https://support.google.com/looker-studio)
* [Best practices for BigQuery cost control](https://cloud.google.com/bigquery/docs/best-practices-costs)
Thanks for reading — see you in the next lesson.
## Typical use cases and comparison
Looker Studio fits well in many reporting scenarios but is not a one-size-fits-all solution. Use the table below to decide when to choose Looker Studio and when to consider alternatives.
| Use case | Why choose Looker Studio | When to consider alternatives |
| ---------------------------------------- | ---------------------------------------------------------------------- | ----------------------------------------------------------------------------------------------------------------------------------------------------- |
| Operational monitoring / live dashboards | Native connectors and scheduled refreshes support near-real-time views | For sub-second latency or extremely high-frequency updates, consider specialized streaming dashboards |
| Executive and lightweight reporting | Simple sharing, embedding, and scheduled email delivery | If you need heavily customized visuals, advanced analytics, or governance at enterprise scale, consider Tableau, Power BI, or Looker (the platform) |
| Ad-hoc exploration for analysts | Quick visual prototypes & integration with GCP | For deep statistical modeling or complex visualization scripting, use dedicated analytics notebooks or BI tools with advanced visualization libraries |
Common enterprise patterns:
* Use Looker Studio for broad distribution of standardized reports and executive dashboards.
* Use Tableau, Power BI, or Looker (platform) for deep-dive analytics, complex visualizations, or enterprise governance.
* Combine Looker Studio dashboards with BigQuery scheduled aggregations or materialized views to minimize per-report query cost.
## Best practices for performance and cost control
* Pre-aggregate large datasets in BigQuery using scheduled queries or materialized views.
* Limit the number of charts on high-traffic report pages; each chart can trigger queries.
* Use extract-based connectors or cached data sources for views that don’t require real-time freshness.
* Apply filters and data range controls to restrict scanned data.
* Monitor BigQuery usage and set cost alerts or quotas for service accounts used by Looker Studio.
## Quick review question
Which Looker Studio feature allows dashboards to always show updated numbers from [BigQuery](https://cloud.google.com/bigquery) without exporting the data?
Options:
* A) CSV uploads
* B) Real-time data connectivity
* C) Offline storage
* D) Shared drives
Correct answer: B) Real-time data connectivity — Looker Studio connects directly to [BigQuery](https://cloud.google.com/bigquery) and can refresh visualizations automatically as new data arrives (subject to connector and caching settings).
## Conclusion
Looker Studio is a lightweight, cost-effective option for visualization and reporting tightly integrated with Google Cloud. It excels at delivering live dashboards, scheduled reports, and easy collaboration while relying on BigQuery for heavy data processing. Use it for fast, shareable reporting and pair it with advanced analytics tools when deeper analysis or specialized visuals are required.
Further reading and resources:
* [BigQuery documentation](https://cloud.google.com/bigquery)
* [Looker Studio connectors & setup](https://support.google.com/looker-studio)
* [Best practices for BigQuery cost control](https://cloud.google.com/bigquery/docs/best-practices-costs)
Thanks for reading — see you in the next lesson.