> ## Documentation Index
> Fetch the complete documentation index at: https://notes.kodekloud.com/llms.txt
> Use this file to discover all available pages before exploring further.
# Deploying view app logs
> Learn to deploy an API application with automatic log forwarding to Loki, configure log collection with Promtail, and verify logs in Grafana.
In this lesson, you'll learn how to deploy a new API application while ensuring its logs are automatically forwarded to Loki. This guide covers configuring log collection with Promtail, deploying the application on Kubernetes, and verifying the logs through Grafana.
## Configuring Log Collection
Begin by creating a file named `app-deployment.yaml` to define both the log collection settings and the deployment configuration for your application. Add the following Promtail snippet to configure how log labels are applied and where Promtail should locate log files from Kubernetes pods:
```yaml theme={null}
- action: replace
source_labels:
- __meta_kubernetes_pod_node_name
target_label: node_name
- action: replace
source_labels:
- __meta_kubernetes_namespace
target_label: namespace
- action: replace
replacement: '$1'
separator: /
source_labels:
- namespace
- app
target_label: job
- action: replace
source_labels:
- __meta_kubernetes_pod_name
target_label: pod
- action: replace
source_labels:
- __meta_kubernetes_pod_container_name
target_label: container
- action: replace
replacement: /var/log/pods/$1/*.log
separator: /
source_labels:
- __meta_kubernetes_pod_uid
- __meta_kubernetes_pod_container_name
```
This configuration directs Promtail on how to label and locate Kubernetes pod log files effectively.
## Deploying the Application
Next, add the deployment configuration to the same file. The YAML snippet below describes a standard Kubernetes Deployment for an API application. This deployment uses the `kodekloud/loki-demo` image from Docker Hub—a demo container that generates random logs to help verify log collection via Loki.
```yaml theme={null}
kind: Deployment
metadata:
name: api
spec:
selector:
matchLabels:
app: api
template:
metadata:
labels:
app: api
spec:
containers:
- name: api
image: kodekloud/loki-demo
resources:
limits:
memory: "128Mi"
cpu: "500m"
```
After adding this configuration, save the `app-deployment.yaml` file.
## Applying the Configuration
Deploy the new application using the following command:
```bash theme={null}
kubectl apply -f app-deployment.yaml
```
You should see output similar to the following:
```bash theme={null}
deployment.apps/api created
```
Wait a few seconds, then verify that the pod is running by executing:
```bash theme={null}
kubectl get pods
```
A successful deployment might produce an output like this:
```bash theme={null}
NAME READY STATUS RESTARTS AGE
api-5bb95b4844-ln5xk 1/1 Running 0 6s
loki-0 1/1 Running 0 14m
loki-grafana-5df4f4d7d99-x4794 2/2 Running 0 14m
loki-promtail-bk9rj 1/1 Running 0 14m
```
Ensure that all pods are up and running before proceeding to verify the logs.
## Verifying Logs in Grafana
To confirm that your API pod's logs are being captured, open Grafana and navigate to the query interface. Follow these steps:
1. Select the `pod` field from the available options.
2. Clear any current selections if necessary.
3. Find and click on your API pod to execute the query.
The logs generated by the application mimic a typical REST API, including details such as HTTP methods, routes, and response codes. For example:
```plaintext theme={null}
2023-08-06 19:19:33.823 {"log":"{\"level\":40,\"time\":1691369373699,\"pid\":1,\"hostname\":\"api-5bb95b4844-ln5kx\",\"method\":\"POST\",\"route\":\"/users/\",\"code\":\"200\",\"stream\":\"stdout\",\"time\":\"2023-08-06T19:19:33.699944589Z\"}\n"}
2023-08-06 19:19:32.819 {"log":"{\"level\":50,\"time\":1691369272969,\"pid\":1,\"hostname\":\"api-5bb95b4844-ln5kx\",\"method\":\"PATCH\",\"route\":\"/products\",\"code\":\"200\",\"stream\":\"stdout\",\"time\":\"2023-08-06T19:19:32.707664272Z\"}\n"}
2023-08-06 19:19:30.811 {"log":"{\"level\":40,\"time\":1691369259796,\"pid\":1,\"hostname\":\"api-5bb95b4844-ln5kx\",\"method\":\"DELETE\",\"route\":\"/users/\",\"code\":\"404\",\"stream\":\"stdout\",\"time\":\"2023-08-06T19:19:30.697300013Z\"}\n"}
```
These entries confirm that logs are correctly collected and forwarded to Loki.
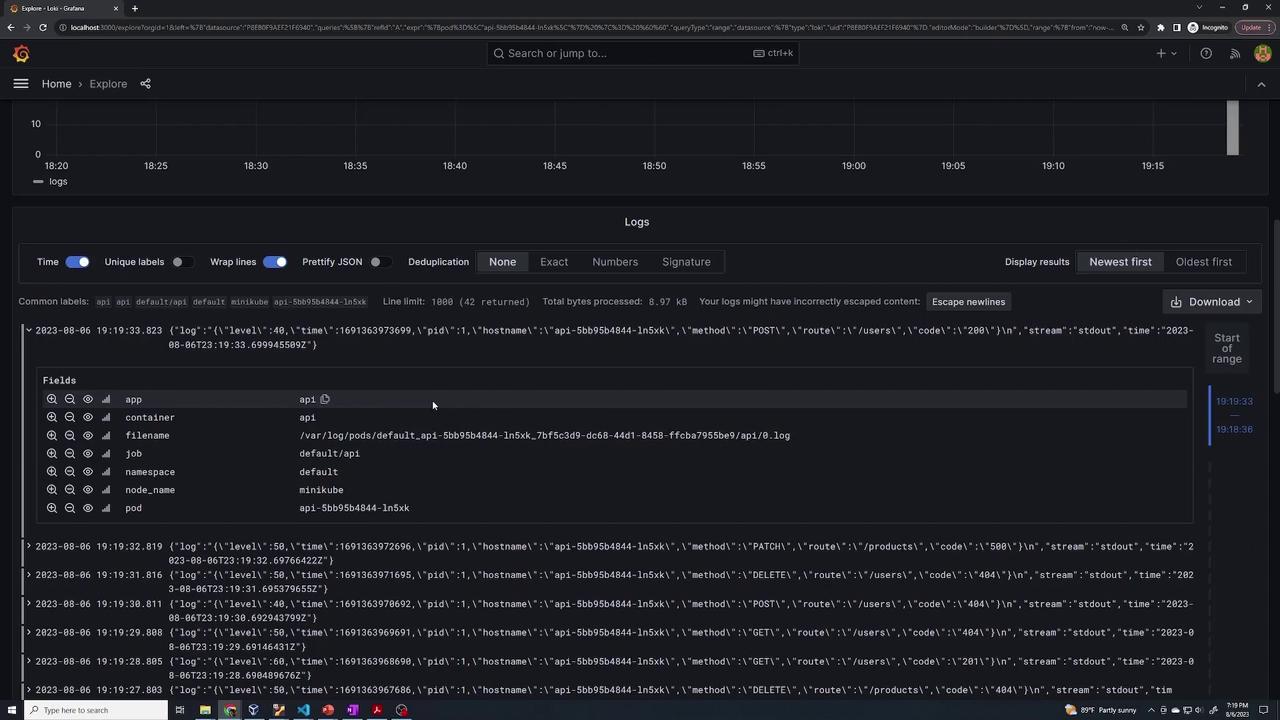
Promtail automatically collects these logs and sends them to Loki without requiring any additional configuration.
This concludes the lesson on deploying an application and monitoring its logs using Loki and Grafana. By following these steps, you ensure that your Kubernetes-based application logs are efficiently collected and easily viewed in Grafana.