> ## Documentation Index
> Fetch the complete documentation index at: https://notes.kodekloud.com/llms.txt
> Use this file to discover all available pages before exploring further.
# Section Overview Monitor a Vault Environment
> This article covers monitoring a Vault environment, focusing on telemetry, audit logs, and operational logs for effective operations and exam preparation.
In this lesson, we cover **Objective 2: Monitoring a Vault Environment**. While this section is concise, understanding Vault telemetry, audit logs, and operational logs is critical for both real-world operations and the Vault Operations Professional exam.
Below is an objective overview:
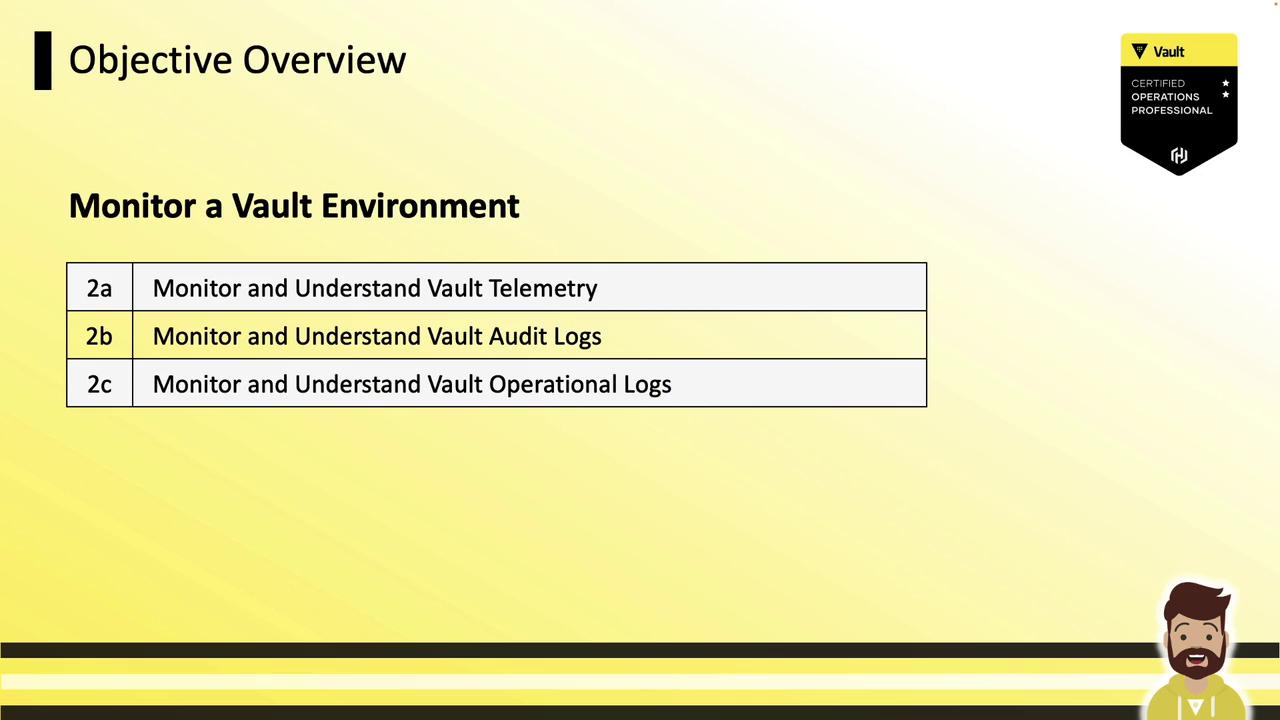
**Sub-objectives:**
* Monitor and understand Vault telemetry
* Monitor and understand Vault audit logs
* Monitor and understand Vault operational logs
“Understand” requires conceptual knowledge; “monitor” implies hands-on experience with setup or output analysis.
***
## Vault Telemetry
Vault telemetry provides runtime metrics on performance, resource usage, and component health. Leveraging telemetry helps you:
* Detect performance bottlenecks
* Debug latency spikes
* Track cluster health over time

Key telemetry attributes:
* **Metrics examples**: request latency, storage write/read durations, seal/unseal status
* **Aggregation interval**: every 10 seconds
* **In-memory retention**: 1 minute
* **Collection agents**: Datadog Agent, Prometheus `node_exporter`, etc., polling Vault then forwarding data upstream
### Supported Telemetry Providers
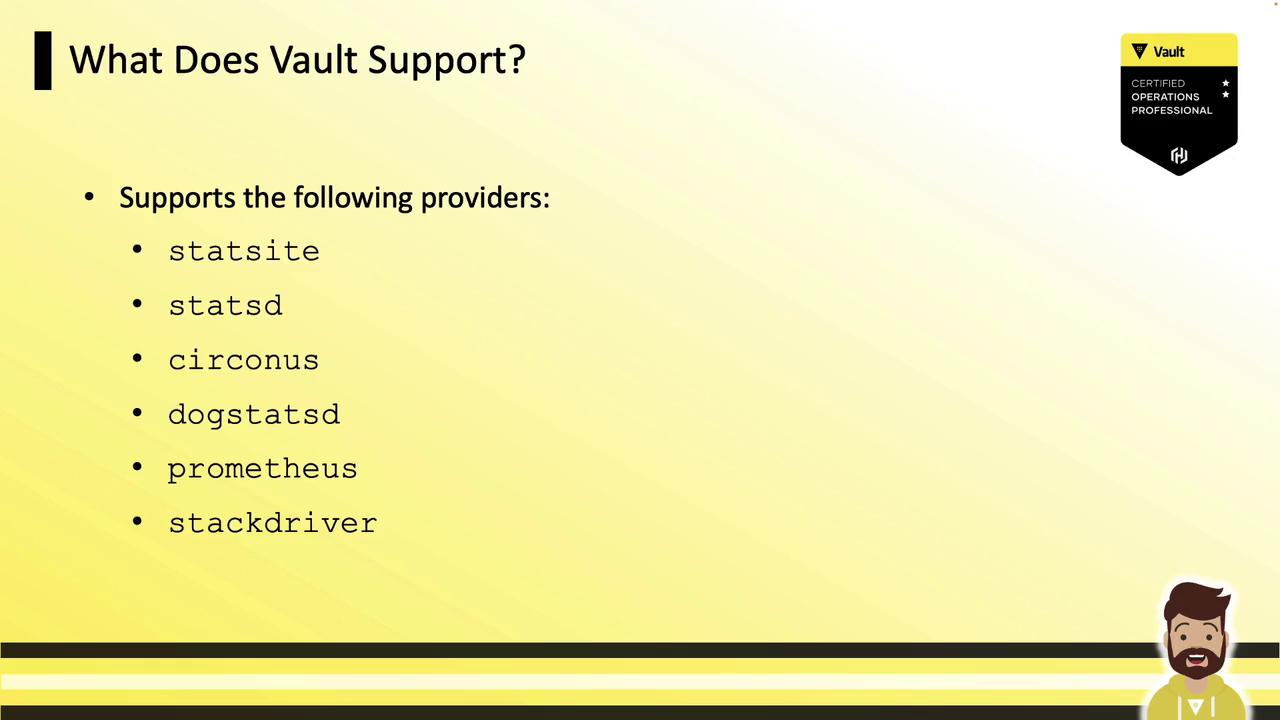
Configure your monitoring backend in the `telemetry` stanza of `config.hcl`. Vault supports:
| Provider | Protocol | Common Use Case |
| ----------- | ----------- | ------------------------- |
| statsite | Carbon | Graphite integrations |
| statsd | StatsD | Generic metrics pipelines |
| circonus | Circonus | High-scale monitoring |
| dogstatsd | DogStatsD | Datadog |
| prometheus | Prometheus | Prometheus + Grafana |
| stackdriver | Stackdriver | Google Cloud Monitoring |
### Example Telemetry Metrics
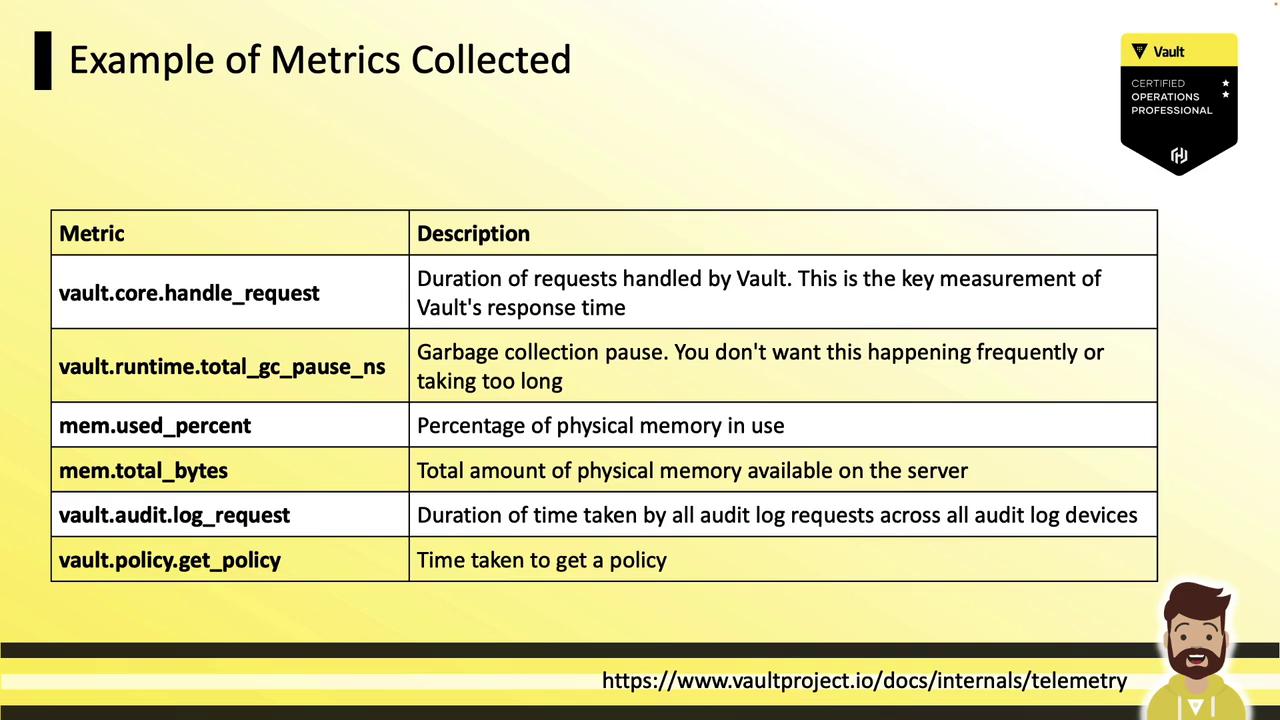
Vault emits dozens of metrics covering HTTP handlers, storage backends, memory usage, and GC pauses:
| Metric | Description |
| ----------------------------------- | ---------------------------------------- |
| `vault.core.handleRequest` | Duration of handled requests (ms) |
| `vault.runtime.totalGCPauseNS` | GC stop-the-world pause duration (ns) |
| `vault.runtime.memoryUsePercentage` | Percentage of physical memory in use (%) |
| `vault.runtime.memoryUseTotalBytes` | Total physical memory used (bytes) |
| `vault.audit.log.request` | Time to write to all audit devices (ms) |
| `vault.policy.getPolicy` | Policy retrieval latency (ms) |
For the full list of metrics, see the official [Vault telemetry documentation](https://www.vaultproject.io/docs/configuration/telemetry).
### Configuring Telemetry
Add or update the `telemetry` block in your Vault HCL config (`config.hcl`), then restart or reload Vault:
```hcl theme={null}
telemetry {
dogstatsd_addr = "metrics.hcvop.com:8125"
dogstatsd_tags = ["vault_env:production"]
}
seal "transit" {
address = "transit.hcvop.com:8200"
key_name = "autounseal"
}
```
Replace `dogstatsd_*` with the settings for your chosen backend (Prometheus, statsd, etc.).
### Telemetry Workflow
Vault emits metrics locally → Telemetry agent collects them → Aggregation platform visualizes data:
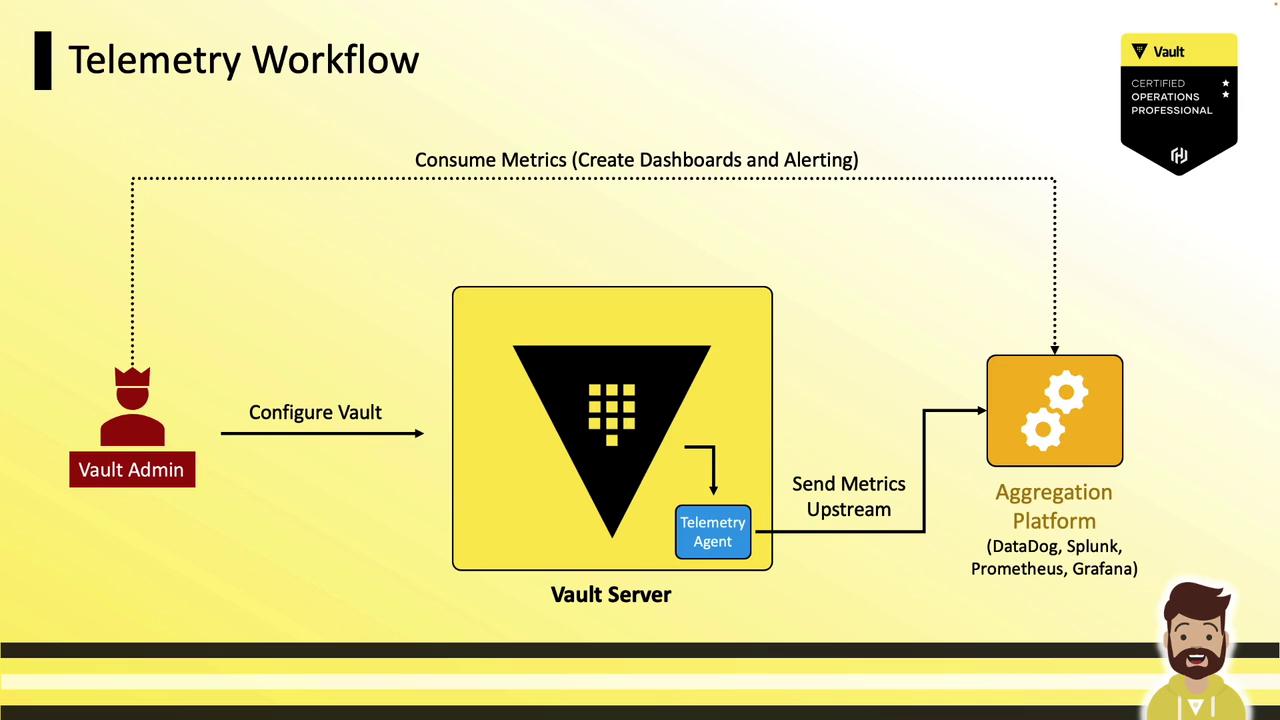
1. Vault server with `telemetry` stanza
2. Local agent (sidecar or host)
3. Aggregation platform (Datadog, Splunk, Prometheus + Grafana, etc.)
4. Dashboards, alerts, and capacity planning
### Sample Dashboard
Below is a Datadog dashboard example showing latency, GC pauses, login rates, and storage metrics:
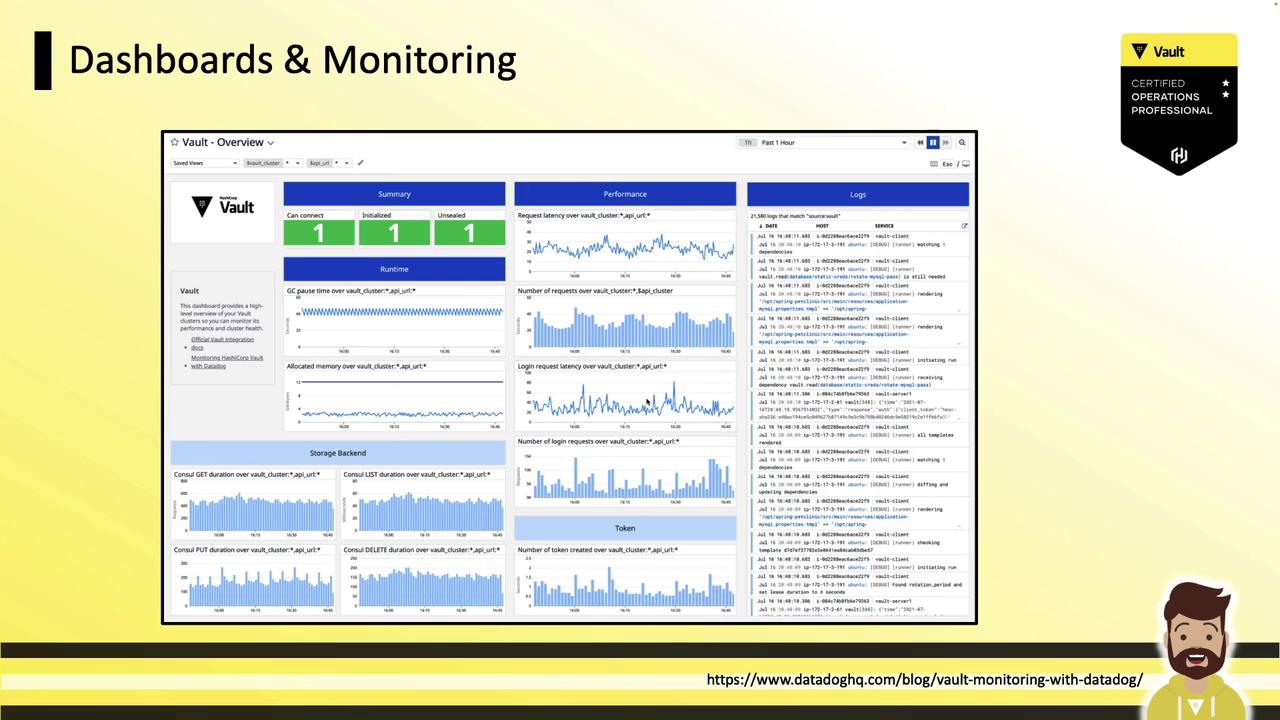
Key panels include:
* Garbage collection pause durations
* Login request rate and P99 latency
* Token creation throughput
* Consul storage operations (put/get/delete)
Be prepared to:
* Define Vault telemetry
* Identify common metrics
* Locate the telemetry stanza in the Vault HCL config\
Practical setup is unlikely, but you may be asked where to add telemetry settings.
***
Next up, we will explore **Vault audit logs**.