Istio Service Mesh
Observability
Demo Visualizing Metrics with Prometheus and Grafana
In this guide, we explore the Prometheus dashboard and various Istio metrics to gain insights into the performance of your service mesh. The Bookinfo "info" service is deployed with default settings and is actively running in your cluster. We will first open the Kiali dashboard to monitor browser requests and then simulate realistic load by generating continuous traffic.
Generating Traffic and Launching Prometheus
To simulate continuous traffic on your application, run the following command in your terminal:
while sleep 0.01; do curl -s 'http://"${INGRESS_HOST}":"${INGRESS_PORT}"/productpage' &> /dev/null; done
Next, launch the Prometheus dashboard using the Istio CLI tool with this command:
istioctl dashboard prometheus
Within Prometheus, you can execute queries to explore raw metrics data. Although Prometheus provides extensive querying capabilities, it is not primarily designed for rich graphical displays. For detailed visualizations, Grafana is the superior tool.
Querying Istio Metrics in Prometheus
When you enter the term “Istio” in Prometheus, you will notice a list of metrics originating from both the Istio control plane and the deployed applications. For instance, you can execute the following query to review diagnostic metrics generated by the Istio agent:
istio_agent_pilot_cluster_xds_bootstrap
istio_agent_pilot_conflict_listener_http_over_current_tcp
istio_agent_pilot_conflict_outbound_listener_tcp_over_current_http
istio_agent_pilot_destrule_subsets
istio_agent_pilot_duplicate_envoy_clusters
istio_agent_pilot_eds_no_instances
istio_agent_pilot_endpoint_not_ready
istio_agent_pilot_no_ip
istio_agent_pilot_proxy_convergence_time_bucket
istio_agent_pilot_proxy_convergence_time_count
istio_agent_pilot_proxy_convergence_time_sum
istio_agent_pilot_proxy_queue_time_bucket
istio_agent_pilot_proxy_queue_time_count
istio_agent_pilot_proxy_queue_time_sum
istio_agent_pilot_virt_services
istio_agent_pilot_vservice_dup_domain
istio_agent_pilot_xds_expired_nonce
istio_agent_pilot_xds_push_time_bucket
istio_agent_pilot_xds_push_time_sum
istio_agent_pilot_xds_pushes
istio_agent_pilot_xds_send_time_bucket
istio_agent_pilot_xds_send_time_count
This collection of metrics not only monitors Istio specifics but also provides insights into the Go runtime environment. One key metric is the Istio requests total, which tracks the overall number of incoming requests. The adjacent graph visualizes these request frequencies over configurable time intervals for detailed analysis.
Metrics in Prometheus can be filtered by multiple dimensions. For instance, to retrieve metrics for the destination service "productpage", use the following query:
istiо_requests_total(app="details", connection_security_policy="mutual_tls", destination_app="details", destination_canonical_revision="v1", destination_canonical_service="details", destination_cluster="Kubernetes", destination_principal="spiffe://cluster.local/ns/default/sa/bookinfo-details", destination_service="details.default.svc.cluster.local", destination_service_name="details", destination_version="v1", destination_workload="details-v1", destination_workload_namespace="default", instance="172.17.0.10:15020", istio_io_rev="default", job="kubernetes-pods", kubernetes_namespace="default", kubernetes_pod_name="details-v1-79774dbb9-6478q")
To further refine the metrics for "review" service requests by adding another dimension, use this extended query:
istiо_requests_total{app="istio-ingressgateway", chart="gateways", connection_security_policy="unknown", destination_app="productpage", destination_canonical_revision="v1", destination_canonical_service="productpage", destination_cluster="Kubernetes", destination_principal="spiffe://cluster.local/ns/default/sa/bookinfo-productpage", destination_service="productpage.default.svc.cluster.local", destination_service_namespace="default", destination_version="v1", destination_workload="productpage-v1", destination_workload_namespace="default", heritage="Tiller", install_operator_istio_io_owning_resource="unknown", instance="172.17.0.152:15020", istio="ingressgateway", kubernetes_namespace="istio-system", kubernetes_pod_name="istio-ingressgateway-565bf4d4-k6qfl", operator_istio_io_component="IngressGateways", pod_template_hash="565bf4d4", release="istio", reporter="source", request_protocol="", response_code="200", response_flags="-", service_istio_canonical_name="istio-ingressgateway", service.istio_io_canonical_revision="latest", sidecar_istio_io_inject="false", source_app="productpage", source_canonical_service="istio-ingressgateway", source_cluster="Kubernetes", source_principal="spiffe://cluster.local/ns/istio-system/sa/istio-ingressgateway-service-account", source_version="unknown", source_workload_namespace="istio-system"} 28857
istiо_requests_total{app="istio-ingressgateway", chart="gateways", connection_security_policy="unknown", destination_app="unknown", destination_canonical_revision="latest", destination_canonical_service="unknown", destination_cluster="unknown", destination_principal="unknown", destination_service="productpage", destination_service_namespace="unknown", destination_version="unknown", destination_workload="unknown", heritage="Tiller", istio_io_rev="default", job="kubernetes-pods", kubernetes_namespace="istio-system", kubernetes_pod_name="istio-ingressgateway-565bf4d4-k6qfl", operator_istio_io_component="IngressGateways", pod_template_hash="565bf4d4", release="istio", request_protocol="", response_code="503", response_flags="-", service_istio_canonical_name="istio-ingressgateway", service_canonical_revision="latest", source_canonical_service="istio-ingressgateway", source_cluster="Kubernetes", source_principal="unknown", source_version="unknown", source_workload_namespace="istio-system"} 5
istiо_requests_total{app="istio-ingressgateway", chart="gateways", connection_security_policy="unknown", destination_app="productpage", destination_canonical_revision="v1", destination_canonical_service="productpage", destination_cluster="Kubernetes", destination_principal="spiffe://cluster.local/ns/default/sa/bookinfo-productpage", destination_service="productpage.default.svc.cluster.local", destination_service_namespace="default", destination_version="v1", destination_workload="productpage", heritage="Tiller", install_operator_istio_io_owning_resource="unknown", instance="172.17.0.152:15020", istio="ingressgateway", kubernetes_namespace="istio-system", kubernetes_pod_name="istio-ingressgateway-565bf4d4-k6qfl", operator_istio_io_component="IngressGateways", pod_template_hash="565bf4d4", release="istio", request_protocol="", response_code="200", response_flags="-", service_istio_canonical_name="istio-ingressgateway", service.istio_io_canonical_revision="latest", sidecar_istio_io_inject="false", source_app="productpage", source_canonical_service="istio-ingressgateway", source_cluster="Kubernetes", source_principal="spiffe://cluster.local/ns/istio-system/sa/istio-ingressgateway-service-account", source_version="unknown", source_workload_namespace="istio-system"} 1
These queries highlight how you can use Istio’s built-in metrics to filter and inspect v3 requests.
Tip
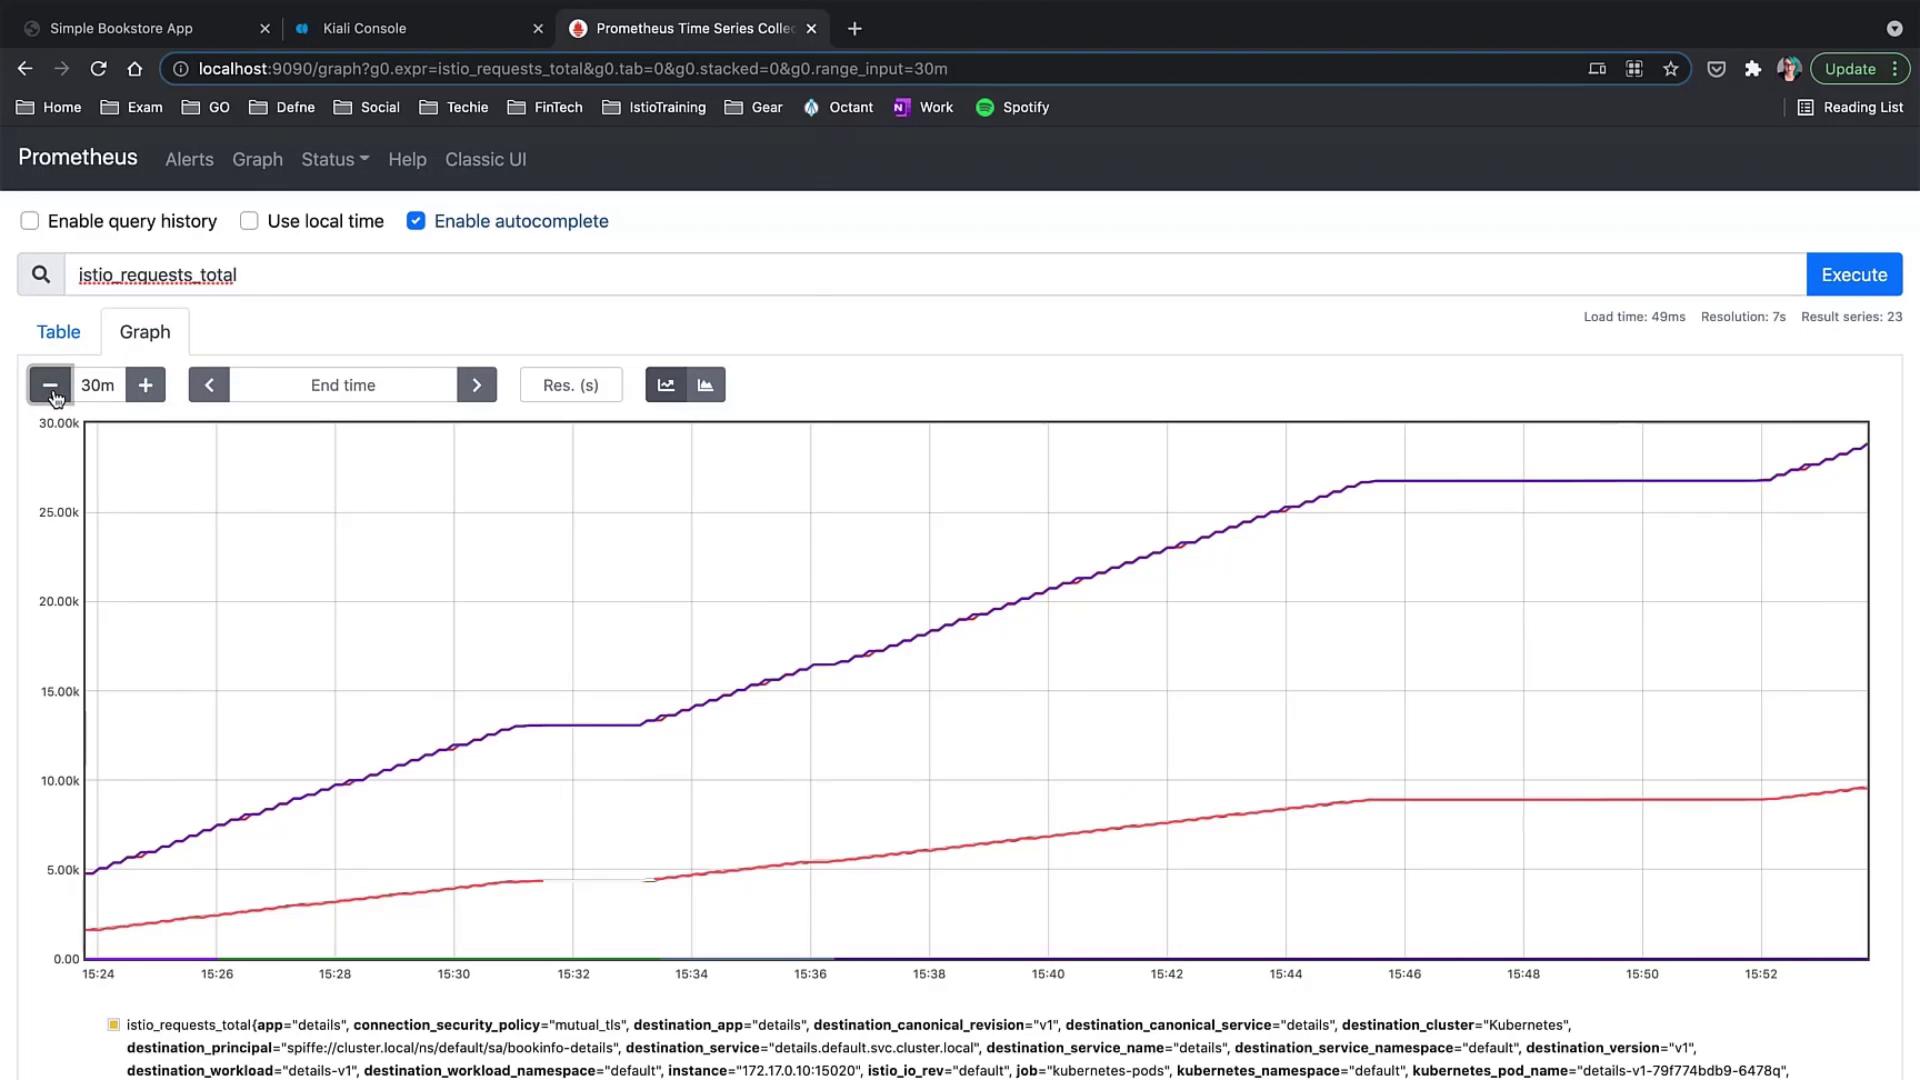
For more detailed guidance on Prometheus queries and their structure, refer to the Prometheus Documentation.
Verifying Prometheus and Grafana Add-ons
Before diving into Grafana dashboards, verify that your Prometheus and Grafana services are running as expected.
To check the Prometheus service, run:
istiotraining@local istio-1.10.3 $ kubectl get svc prometheus -n istio-system
NAME TYPE CLUSTER-IP EXTERNAL-IP PORT(S) AGE
prometheus ClusterIP 10.98.236.105 <none> 9090/TCP 85m
Next, check the Grafana service with:
istiotraining@local istio-1.10.3 $ kubectl get svc grafana -n istio-system
NAME TYPE CLUSTER-IP EXTERNAL-IP PORT(S) AGE
grafana ClusterIP 10.96.79.92 <none> 3000/TCP 85m
After confirming that both services are up, open the Grafana dashboard. You will find options on the left-hand side, including Search, Create, and Dashboard management. Grafana allows you to create new dashboards, export existing ones, and manage alert rules and notification integrations. Within the Search menu, you will also see the default Istio dashboard.
Exploring Grafana Dashboards
Grafana provides a suite of dashboards to monitor various aspects of your Istio service mesh.
Istio Control Plane Dashboard
This dashboard displays critical system metrics such as CPU, memory, disk usage, goroutine counts, control plane errors, and configuration synchronization issues. Clicking on any graph in view mode reveals more granular details.
Additional memory metrics are provided below for closer inspection.
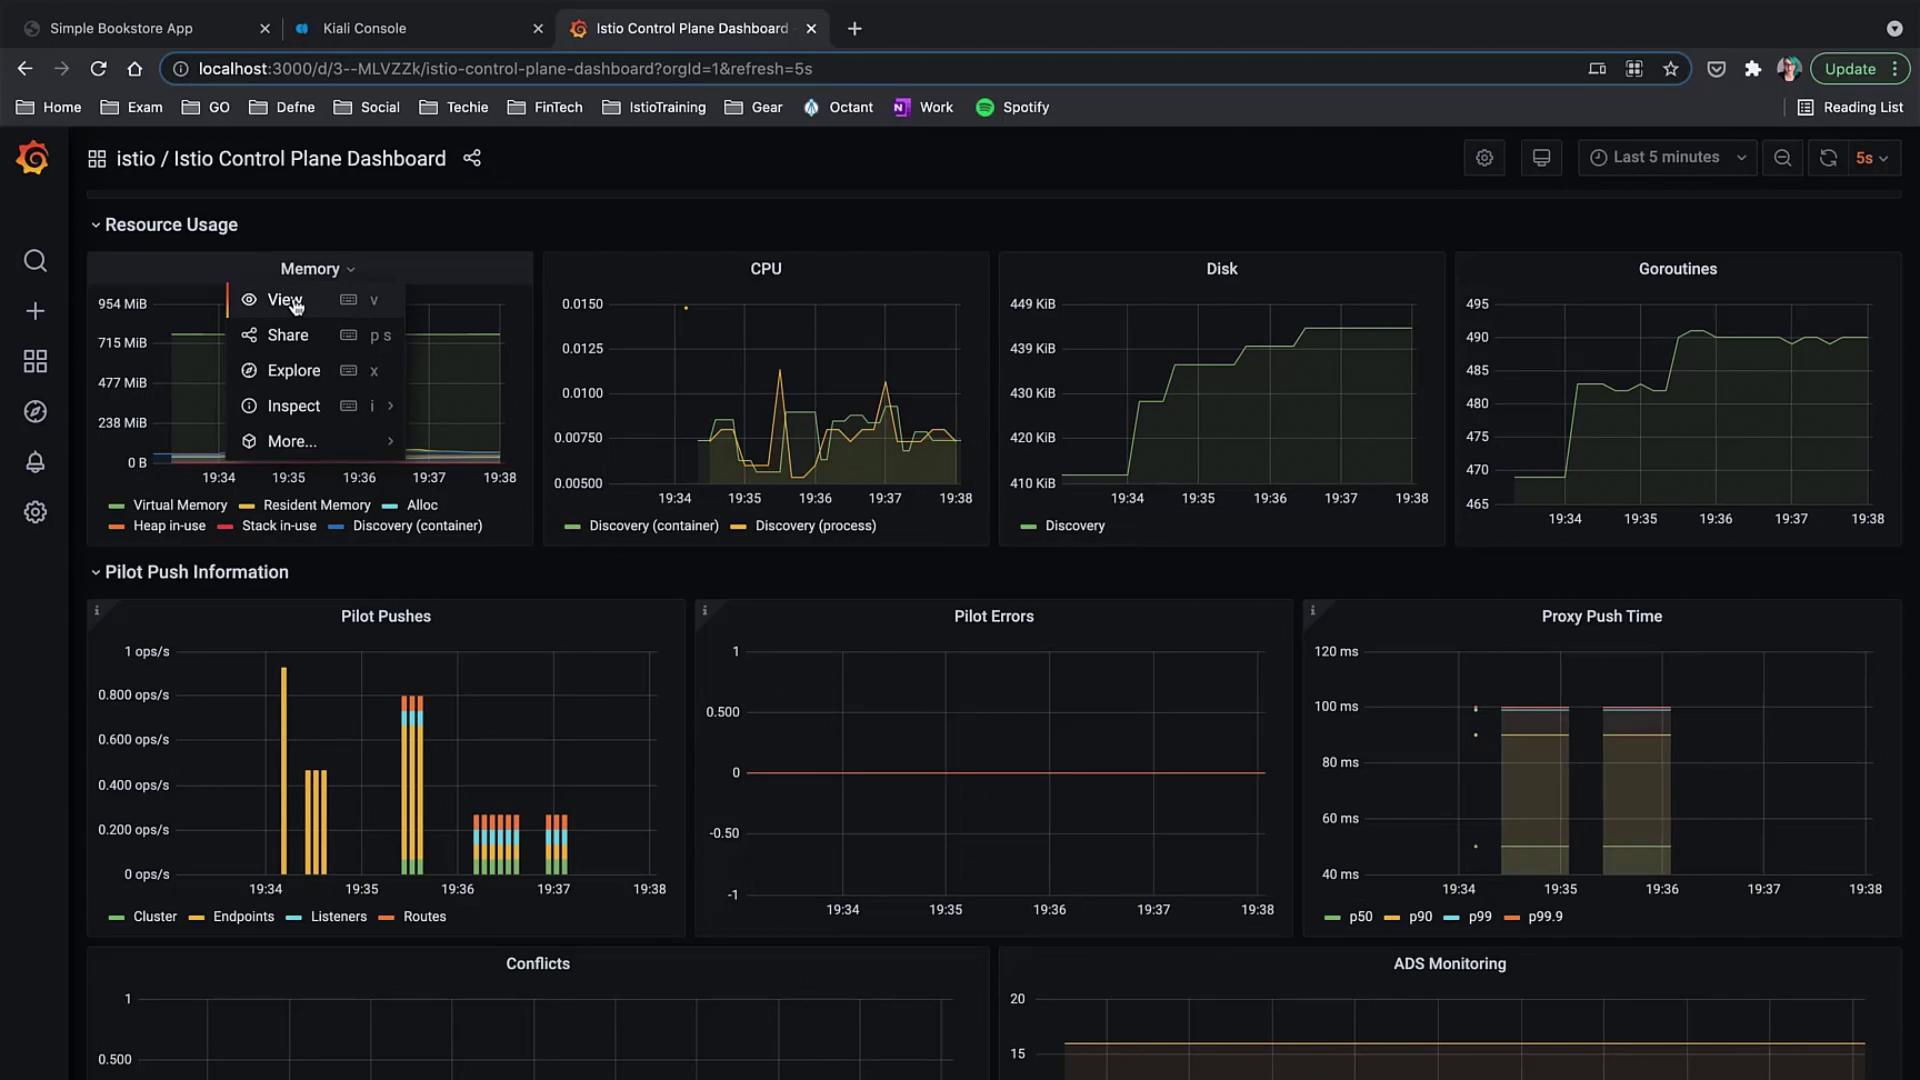
Istio Mesh Dashboard
The Istio Mesh dashboard offers an overarching view of your service mesh by illustrating workloads, services, success rates, errors, and overall configuration:
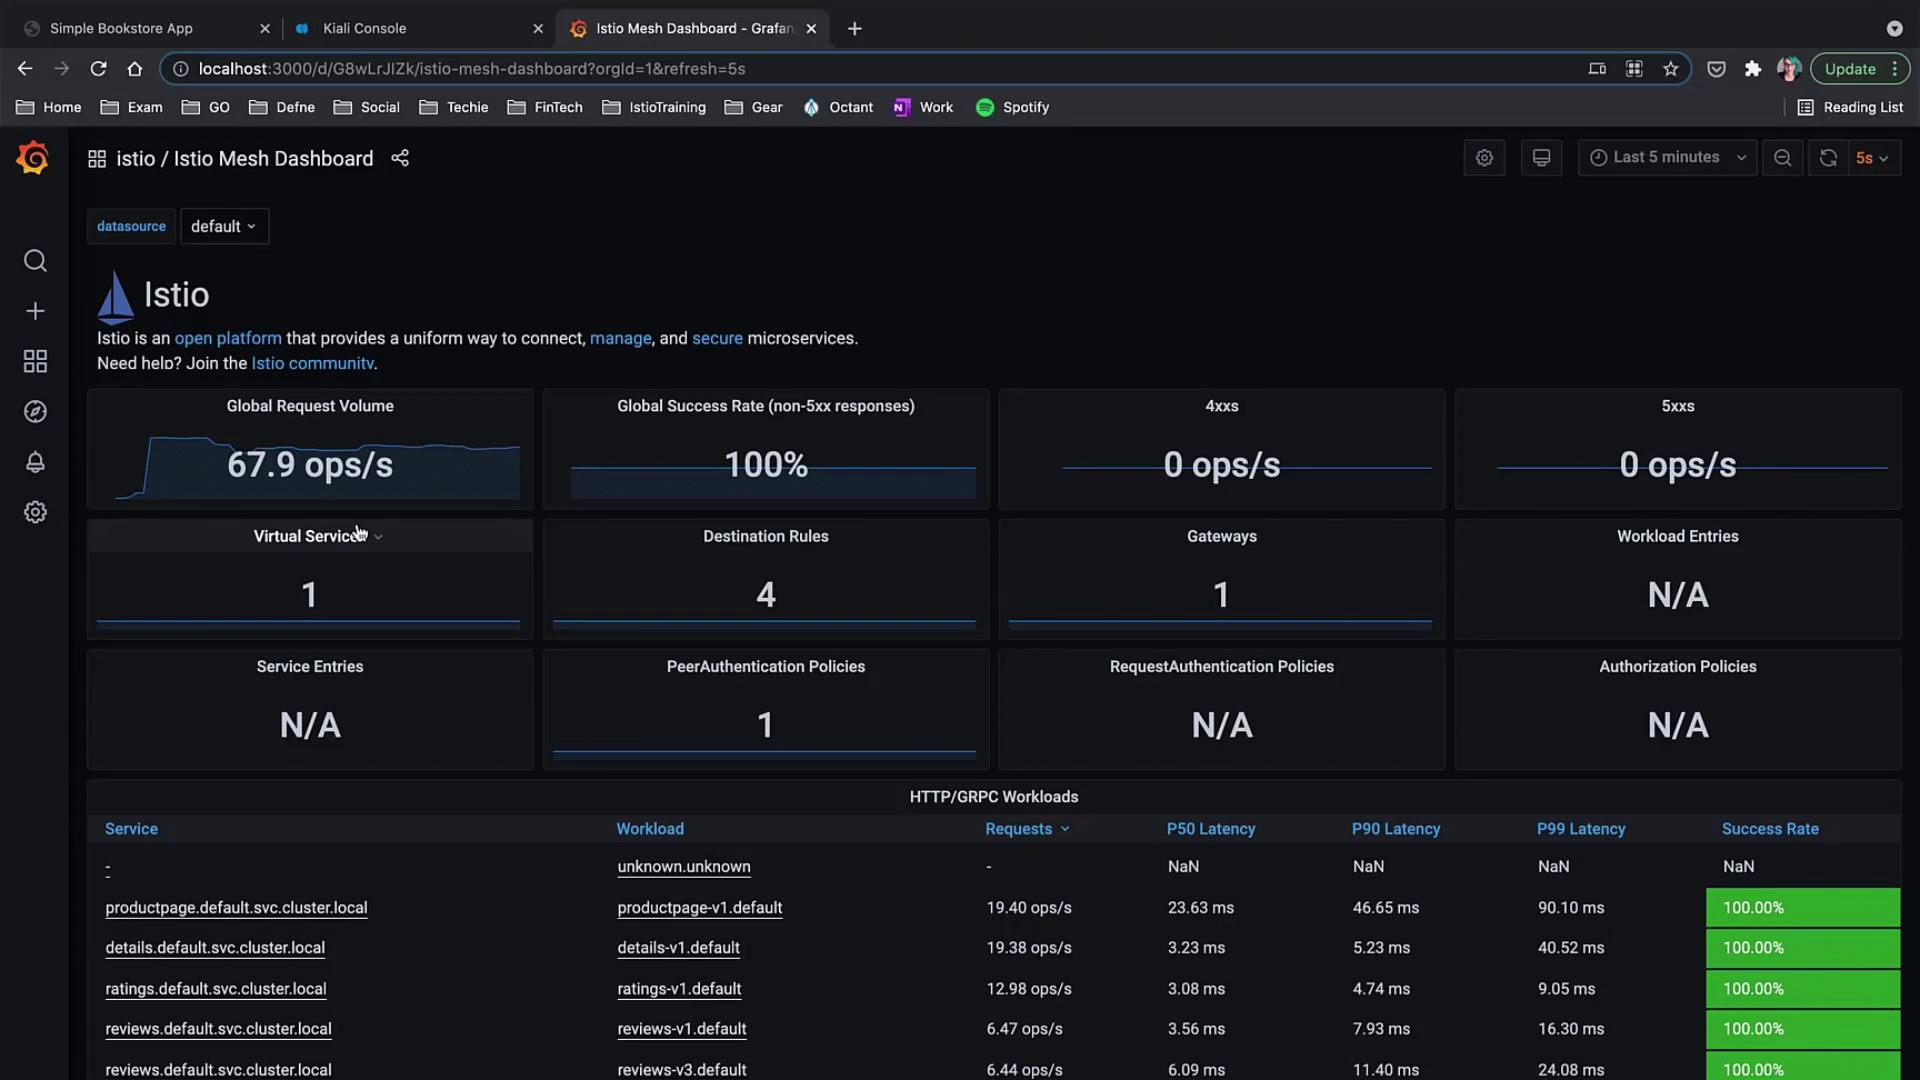
Istio Service Dashboard
For detailed monitoring, the service dashboard presents metrics from the Istio data plane. This dashboard is customizable to suit the unique requirements of your application.
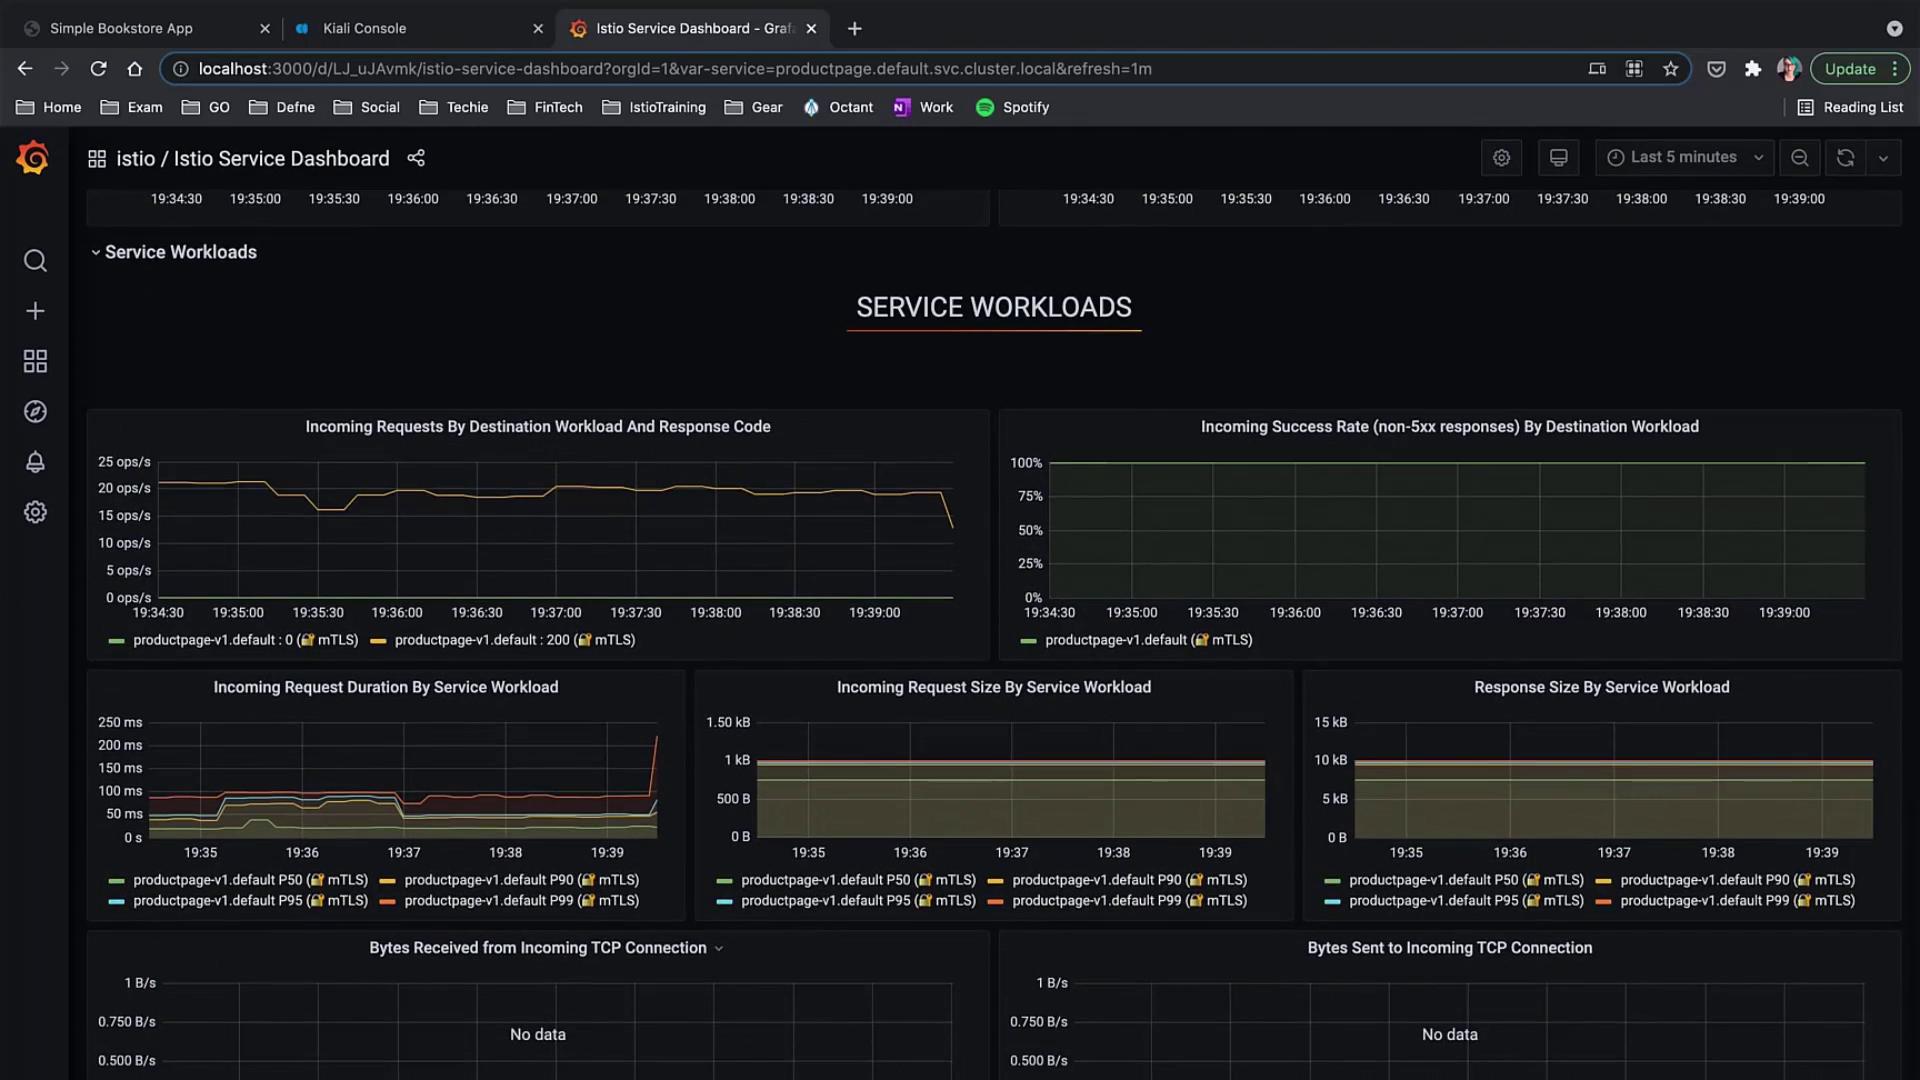
Istio Performance Dashboard
The Performance dashboard groups together metrics such as memory, vCPU, and disk usage over time for monitoring component performance within Istio.
Dashboard Navigation
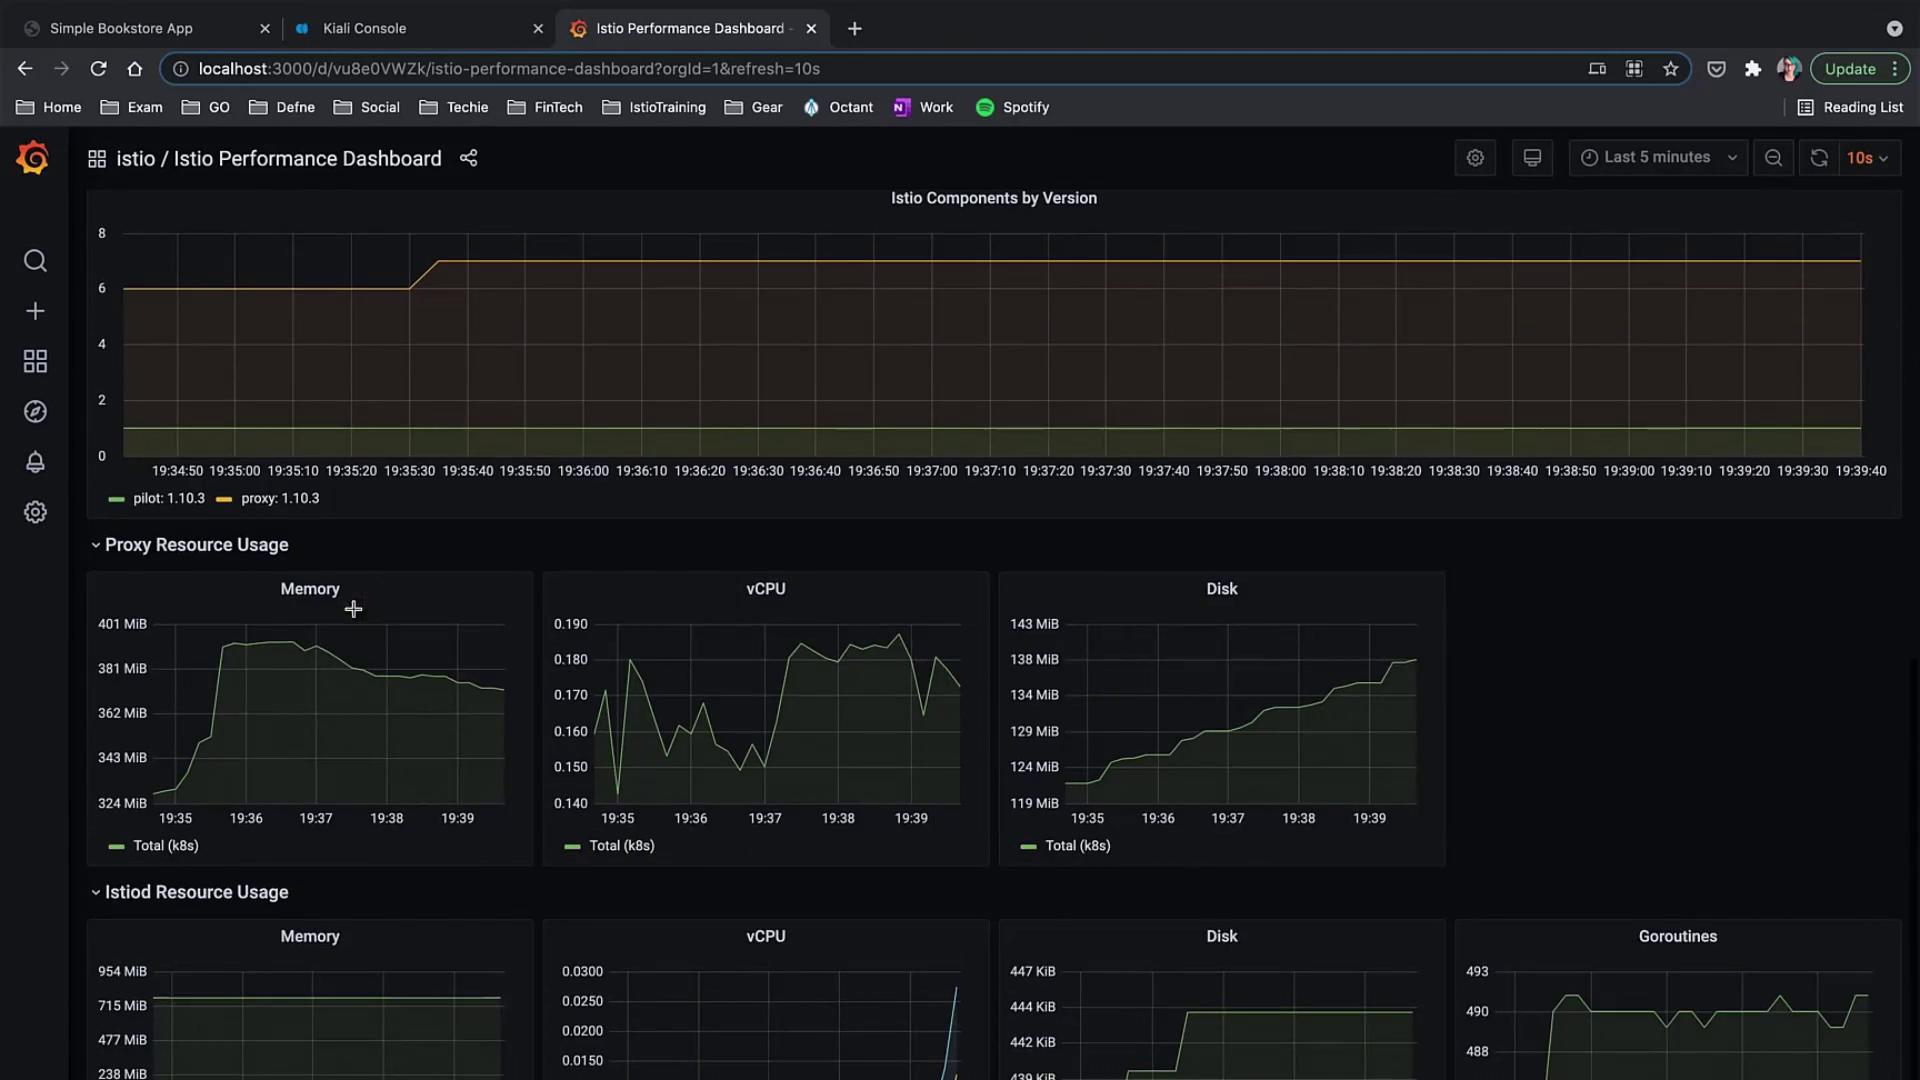
You can easily switch between dashboards using the primary menu. In addition to the dashboards covered here, explore the "Details" service view to filter and review all services in your mesh, access the Wasm Performance dashboard for WebAssembly metrics, and the Workload dashboard to focus on specific workloads.
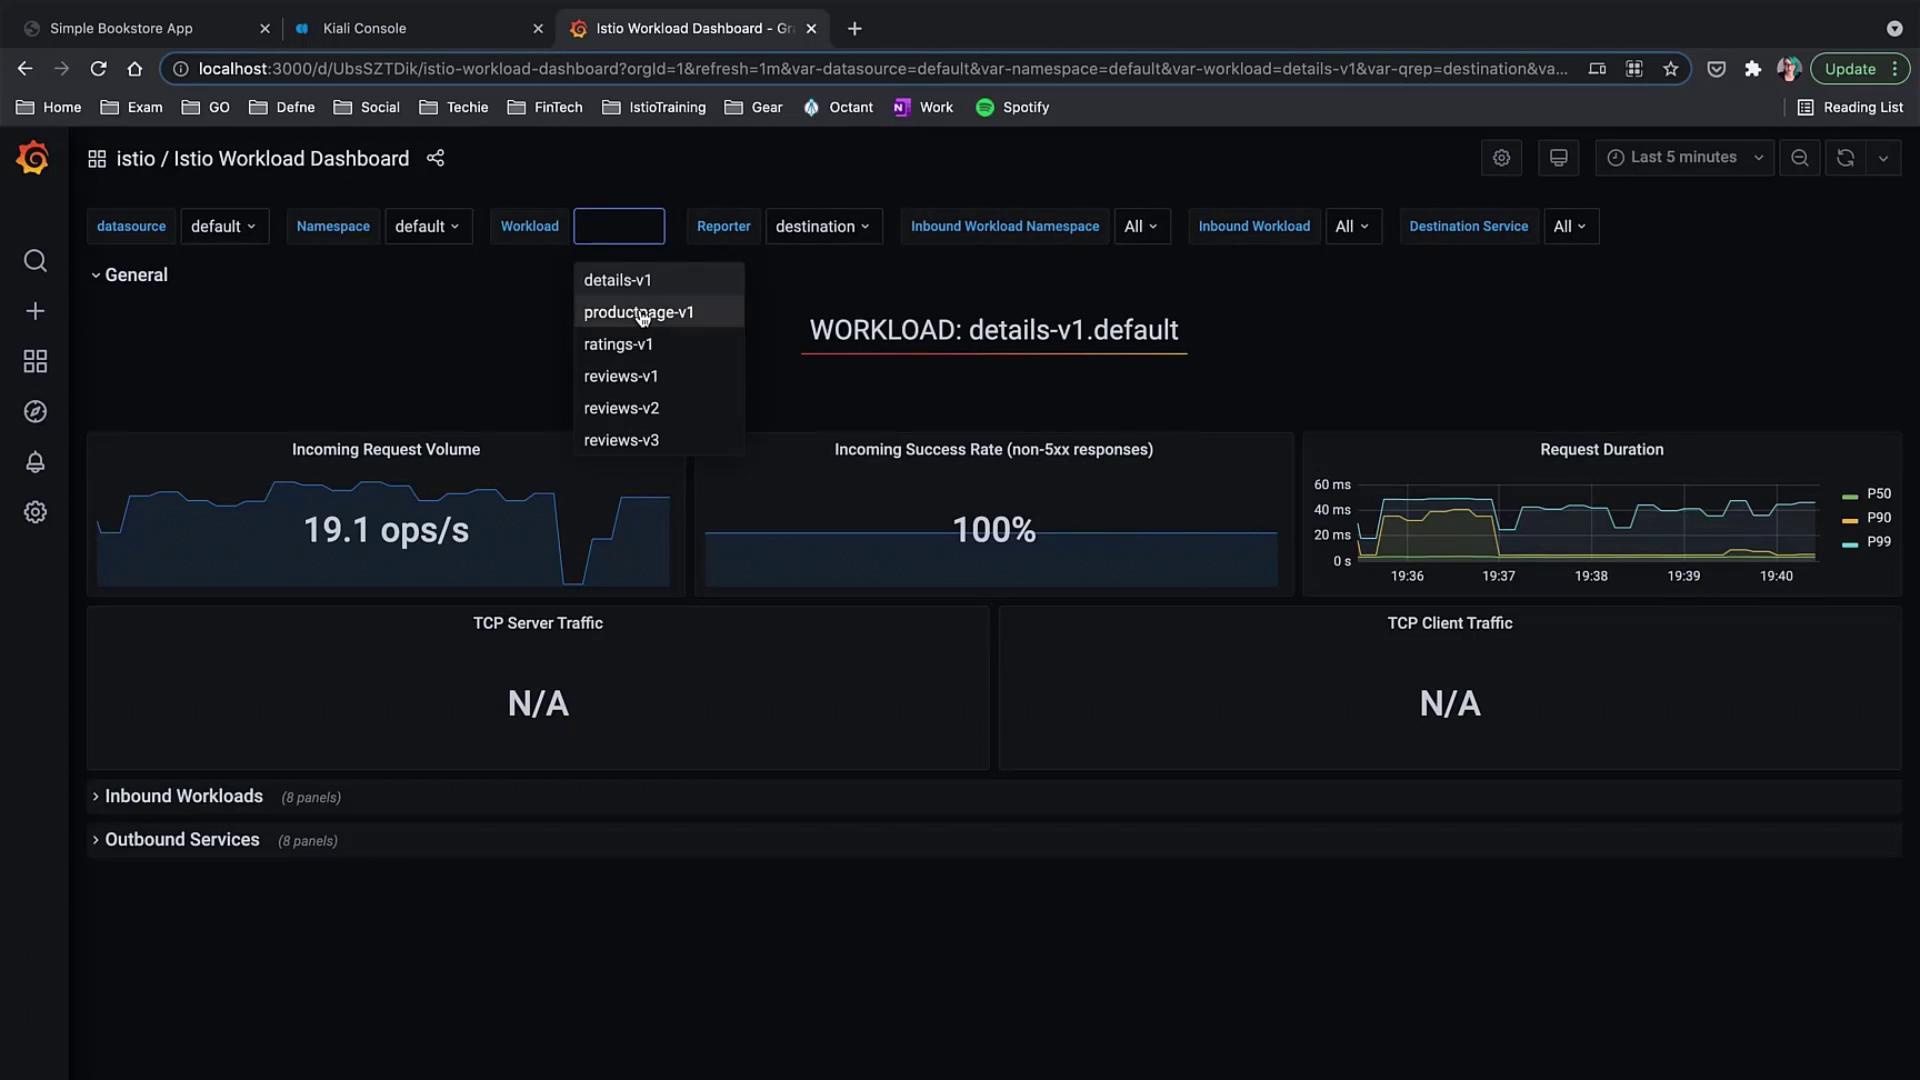
Istio Workload Dashboard
The Istio Workload dashboard shows metrics such as incoming request volume, success rate, and request duration for selected workloads. Use the dropdown menus to filter metrics based on the workload you wish to inspect.
Across these dashboards, you have access to numerous metrics that can be further drilled down for detailed insights into your application's performance and the overall behavior of the service mesh.
For additional details and advanced monitoring techniques, consider exploring the Istio Documentation and Grafana Guides.
Watch Video
Watch video content