Jenkins Pipelines

Code Quality and Testing

SonarQube Quality Gate Step and Refactoring

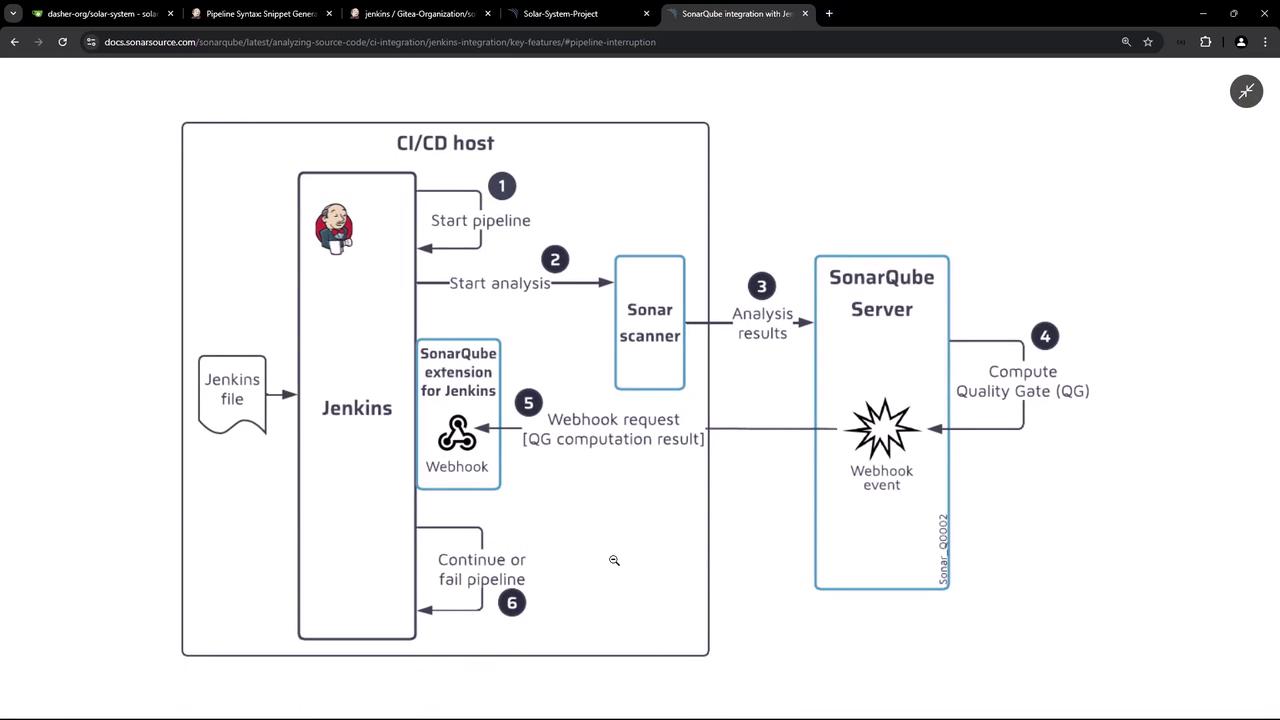
In this lesson, we explain how to configure a SonarQube quality gate to control whether your Jenkins pipeline continues or stops, and how to refactor your pipeline for enhanced security and clarity. The solution leverages the SonarQube plugin in Jenkins, which provides a webhook URL to receive quality status updates.

The integration process is illustrated in the following diagram:

The image is a flowchart illustrating the integration process between Jenkins and SonarQube for CI/CD, showing steps from starting a pipeline to computing quality gates and handling webhook events.

The complete process follows these steps:

  1. Jenkins triggers the pipeline.
  2. The pipeline runs the SonarScanner to analyze the application.
  3. SonarScanner uploads analysis results to the SonarQube server.
  4. SonarQube computes the quality gate for the project and determines if it passes or fails.
  5. The server sends the quality gate status back to Jenkins via the configured webhook.
  6. Depending on the quality gate status, the pipeline either continues (if passed) or aborts (if failed).

Note

Ensure that your Jenkins and SonarQube instances are properly integrated before proceeding with these configurations.


Configuring the SonarQube Webhook

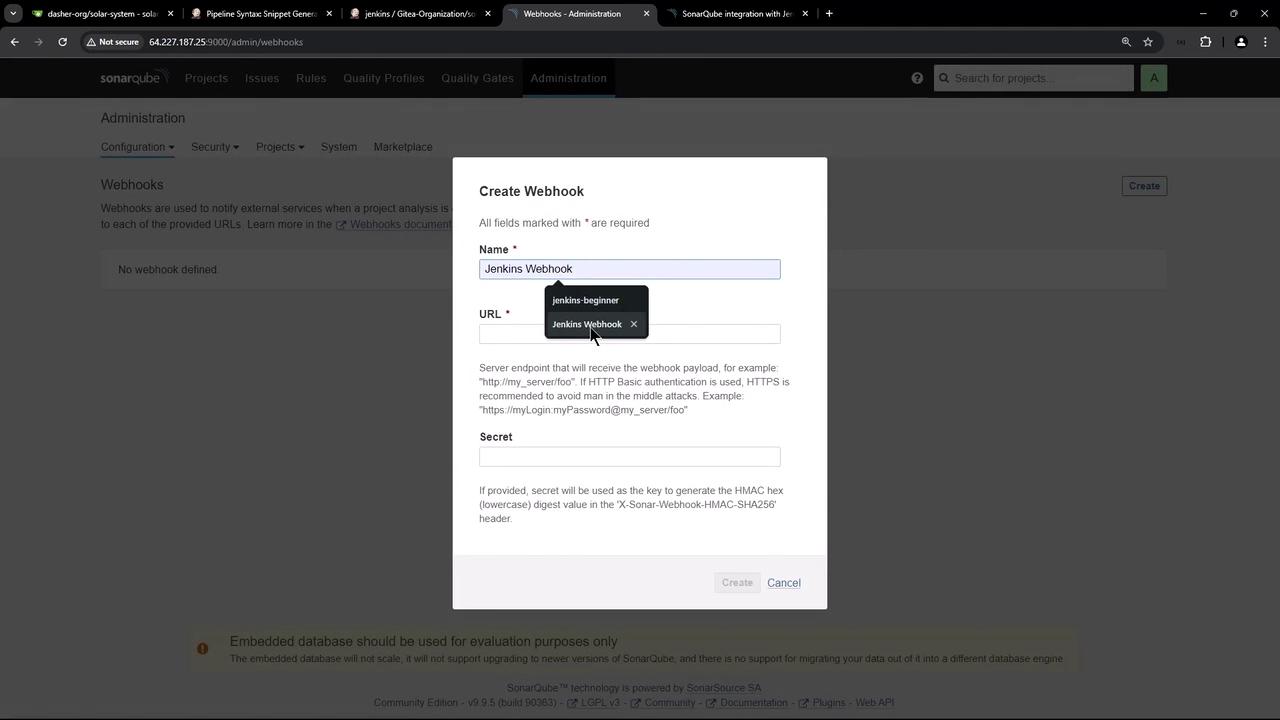
Before integrating quality gate status notifications, verify that Jenkins exposes a webhook URL. Open a new browser tab, navigate to Jenkins on port 8080, and access the SonarQube-webhook endpoint exposed by the SonarQube plugin.

Next, configure the webhook in SonarQube with these steps:

  1. Navigate to Administration > Configure Webhook.
  2. Note that no webhook is defined by default.
  3. Create a new webhook named "Jenkins webhook" and paste the Jenkins webhook URL copied in the previous step.

The image shows a "Create Webhook" form in a SonarQube administration interface, where a user is entering details for a Jenkins Webhook.

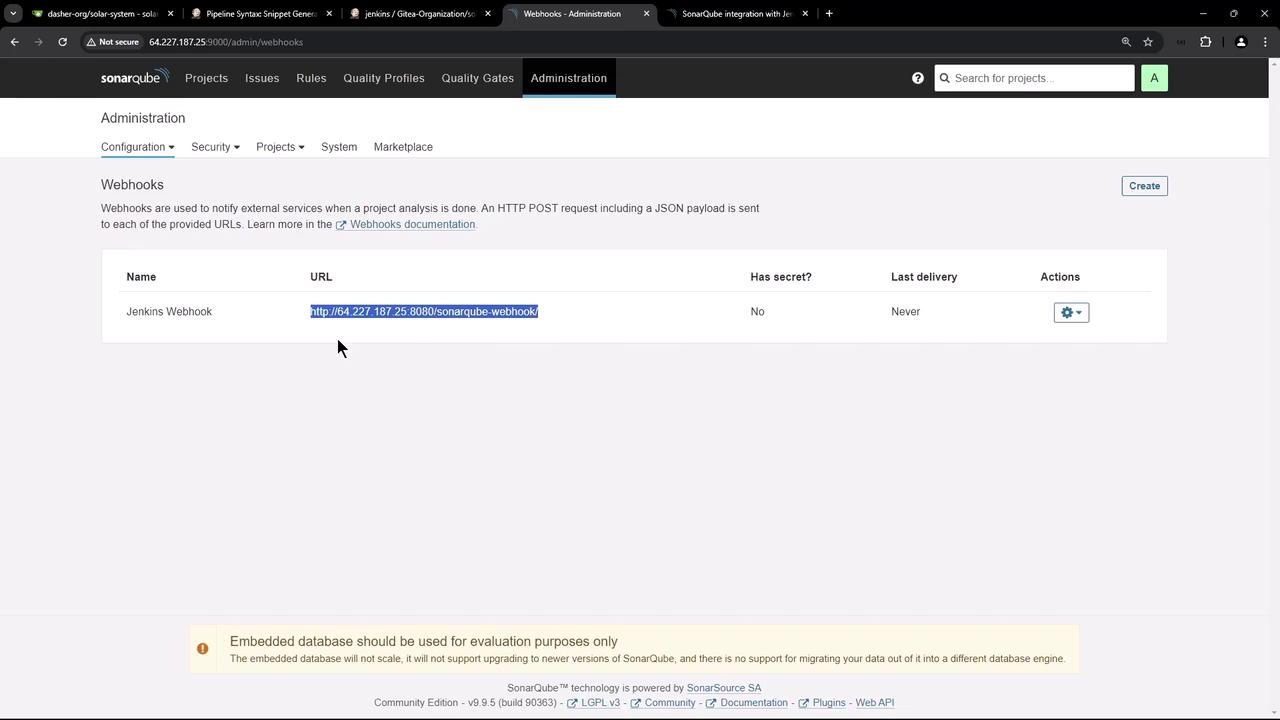
Once the webhook is created, SonarQube will send the quality gate status back to Jenkins. To confirm the settings, check the webhook management page in SonarQube:

The image shows a SonarQube administration page for managing webhooks, with a specific webhook named "Jenkins Webhook" listed, including its URL and settings.


Refactoring the Jenkins Pipeline

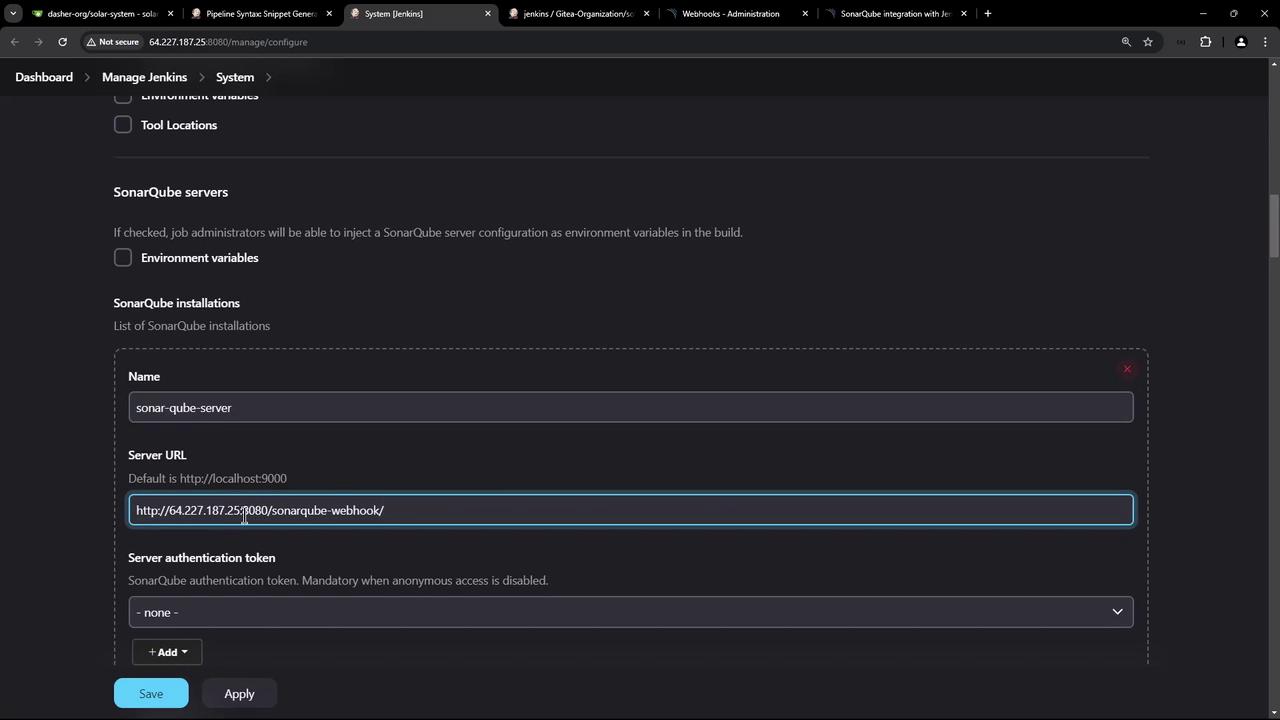
Initially, the Jenkinsfile exposed the authentication token directly in the script, which is not secure. To improve security, you should configure the SonarQube installation within Jenkins and update the Jenkinsfile accordingly.

Adding a SonarQube Server in Jenkins

  1. Navigate to Jenkins configuration.
  2. Add a new SonarQube server by providing:
    • A unique name (e.g., "sonar-qube-server")
    • The SonarQube endpoint (e.g., running on port 9000)
    • The authentication token
  3. Create a new credential of type "Secret Text" using the token. For example, assign a credential ID like "SonarQube server token."

The image shows a Jenkins configuration screen for setting up a SonarQube server, including fields for the server name, URL, and authentication token.

Updating the Jenkinsfile

Modify your Jenkinsfile so that SonarScanner commands are executed within the context of the SonarQube installation. For instance, replace the insecure stage that exposed the token:

stage('SAST - SonarQube') {
    steps {
        sh 'echo $SONAR_SCANNER_HOME'
        sh '''
        $SONAR_SCANNER_HOME/bin/sonar-scanner \
        -Dsonar.projectKey=Solar-System-Project \
        -Dsonar.sources=app.js \
        -Dsonar.host.url=http://64.227.187.25:9000 \
        -Dsonar.javascript.lcov.reportPaths=/coverage/lcov.info \
        -Dsonar.login=sqp_54484dbbbe3a5b3b3088c734cf5e4c3bbe3f6d6
        '''
    }
}

to a more secure version:

stage('SAST - SonarQube') {
    steps {
        withSonarQubeEnv('sonar-qube-server') {
            sh 'echo $SONAR_SCANNER_HOME'
            sh '''
                $SONAR_SCANNER_HOME/bin/sonar-scanner \
                -Dsonar.projectKey=Solar-System-Project \
                -Dsonar.sources=app.js \
                -Dsonar.javascript.lcov.reportPaths=./coverage/lcov.info \
                -Dsonar.login=sqp_544848dbbbe3a53b3088c734cfe34cbeba3fd6
            '''
        }
    }
}

This refactoring ensures that the host URL and token are managed by the SonarQube installation configuration within Jenkins.


Waiting for the Quality Gate Status

To prevent the pipeline from proceeding before the SonarQube analysis is complete, incorporate the "waitForQualityGate" step. This step waits for the quality gate status and can be wrapped in a timeout to avoid indefinite blocking.

Declarative Pipeline Example

pipeline {
    agent none
    stages {
        stage("build & SonarQube analysis") {
            agent any
            steps {
                withSonarQubeEnv('My SonarQube Server') {
                    sh 'mvn clean package sonar:sonar'
                }
            }
        }
        stage("Quality Gate") {
            steps {
                timeout(time: 1, unit: 'HOURS') {
                    waitForQualityGate abortPipeline: true
                }
            }
        }
    }
}

Scripted Pipeline Example

stage('SAST - SonarQube') {
    steps {
        timeout(time: 60, unit: 'SECONDS') {
            withSonarQubeEnv('sonar-qube-server') {
                sh 'echo $SONAR_SCANNER_HOME'
                sh '''
                    $SONAR_SCANNER_HOME/bin/sonar-scanner \
                    -Dsonar.projectKey=Solar-System-Project \
                    -Dsonar.sources=app.js \
                    -Dsonar.javascript.lcov.reportPaths=./coverage/lcov.info
                '''
            }
        }
        waitForQualityGate abortPipeline: true
    }
}

Using the timeout directive ensures that if SonarQube does not return a quality gate status within the specified time (e.g., 60 seconds), the build will be aborted to prevent hanging.


Disabling the OWASP Yarn Audit Analyzer

If your dependency check stage takes too long due to the initialization of the Yarn audit analyzer—and you are already using the Node.js or NPM audit analyzer—you can disable the Yarn audit analyzer to avoid unnecessary delays or errors. Simply add an argument in your dependency scanning configuration to disable Yarn audit.

Below is an example Jenkinsfile with several stages, including Dependency Scanning, Unit Testing, Code Coverage, and a refactored SAST stage:

stage('Dependency Scanning') { 
  // dependency scanning steps
}

stage('Unit Testing') { 
  // unit testing steps
}

stage('Code Coverage') { 
  // code coverage steps
}

stage('SAST - SonarQube') {
    steps {
        timeout(time: 60, unit: 'SECONDS') {
            withSonarQubeEnv('sonar-qube-server') {
                sh 'echo $SONAR_SCANNER_HOME'
                sh '''
                $SONAR_SCANNER_HOME/bin/sonar-scanner \
                  -Dsonar.projectKey=Solar-System-Project \
                  -Dsonar.sources=app.js \
                  -Dsonar.javascript.lcov.reportPaths=./coverage/lcov.info
                '''
            }
        }
        waitForQualityGate abortPipeline: true
    }
}

Include the necessary argument to disable the Yarn audit analyzer in your dependency scanning configuration to prevent related errors.

After committing and pushing these changes, observe the pipeline execution:

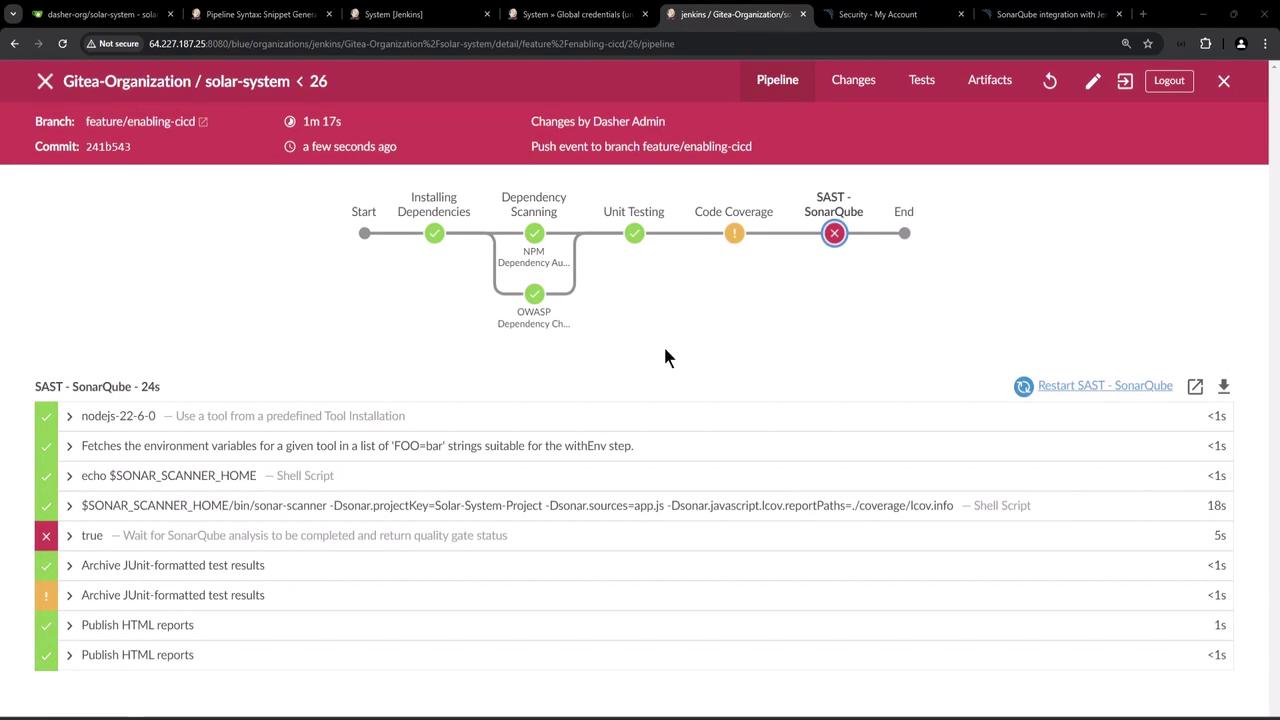
  • The SonarQube stage executes.
  • The quality gate step waits and aborts the pipeline if the quality gate fails.
  • The SonarQube webhook reports the quality gate status back to Jenkins.

For example, if the SonarQube analysis fails due to code coverage issues, you may find logs like this:

19:04:34.691 INFO  The project is analyzed
...
SonarQube task "AtgKZXBMuU4i1nHuM" - Quality gate is "ERROR"
Pipeline aborted due to quality gate failure: ERROR

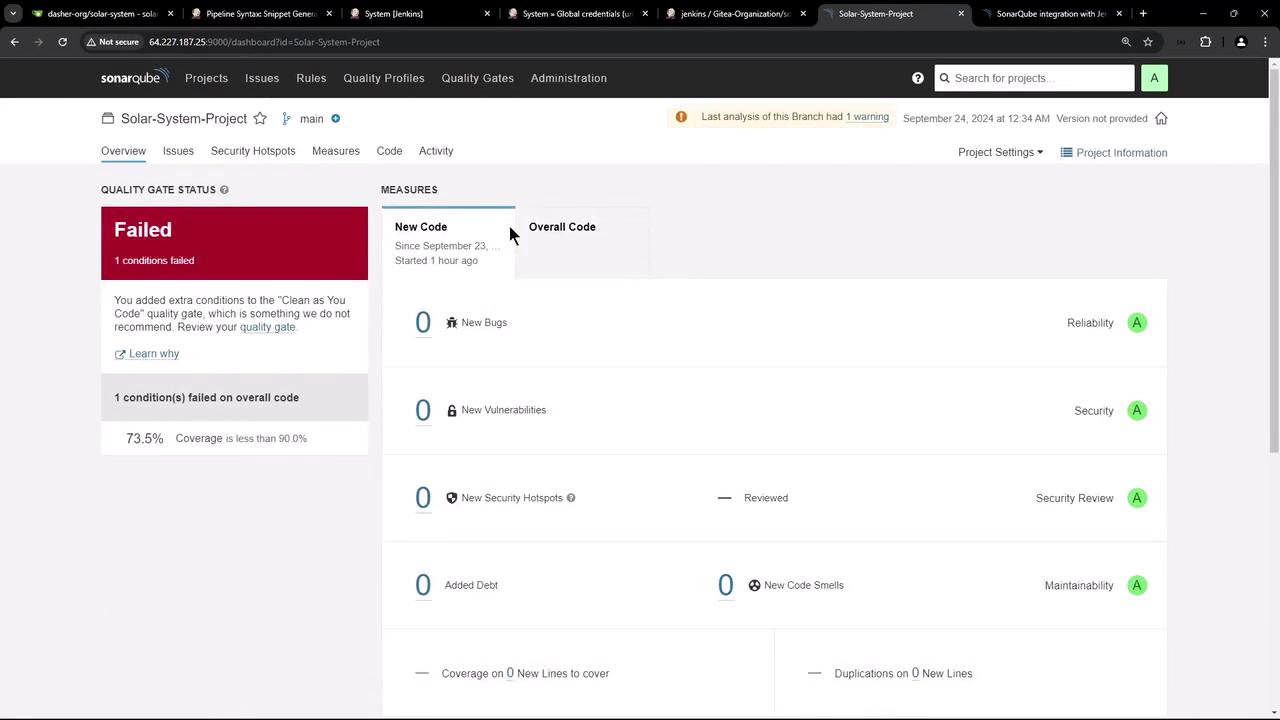
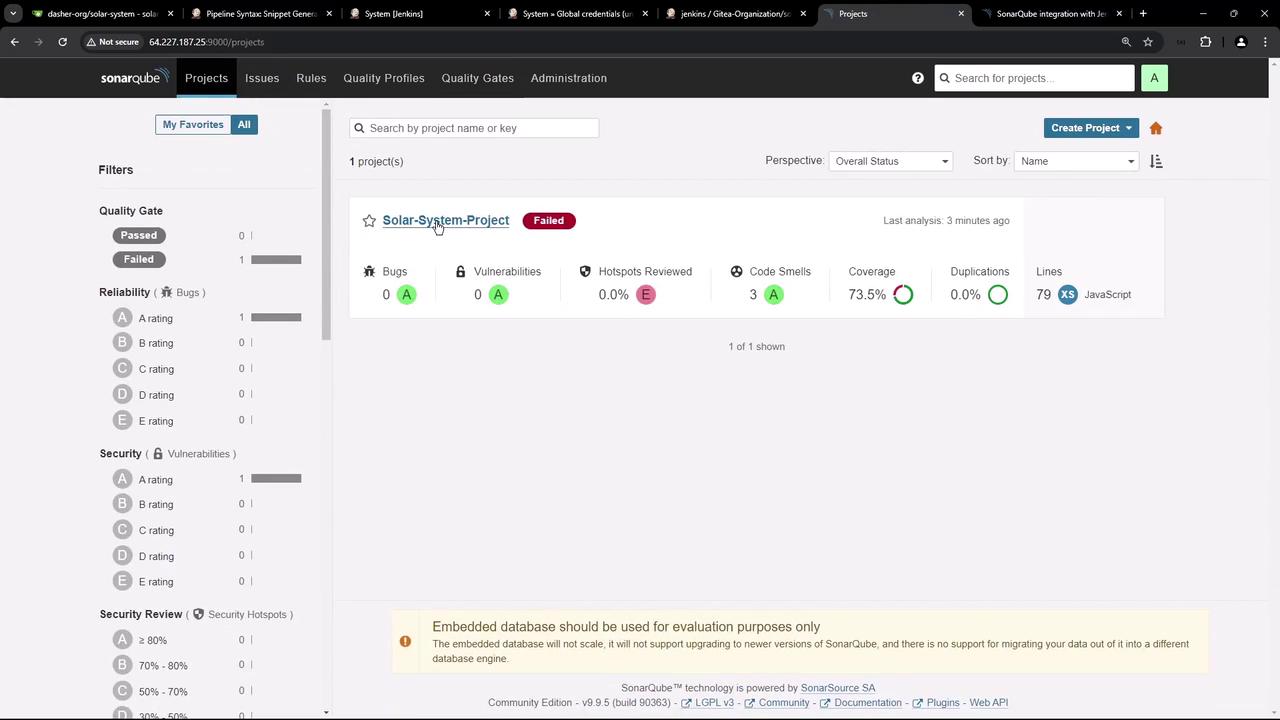
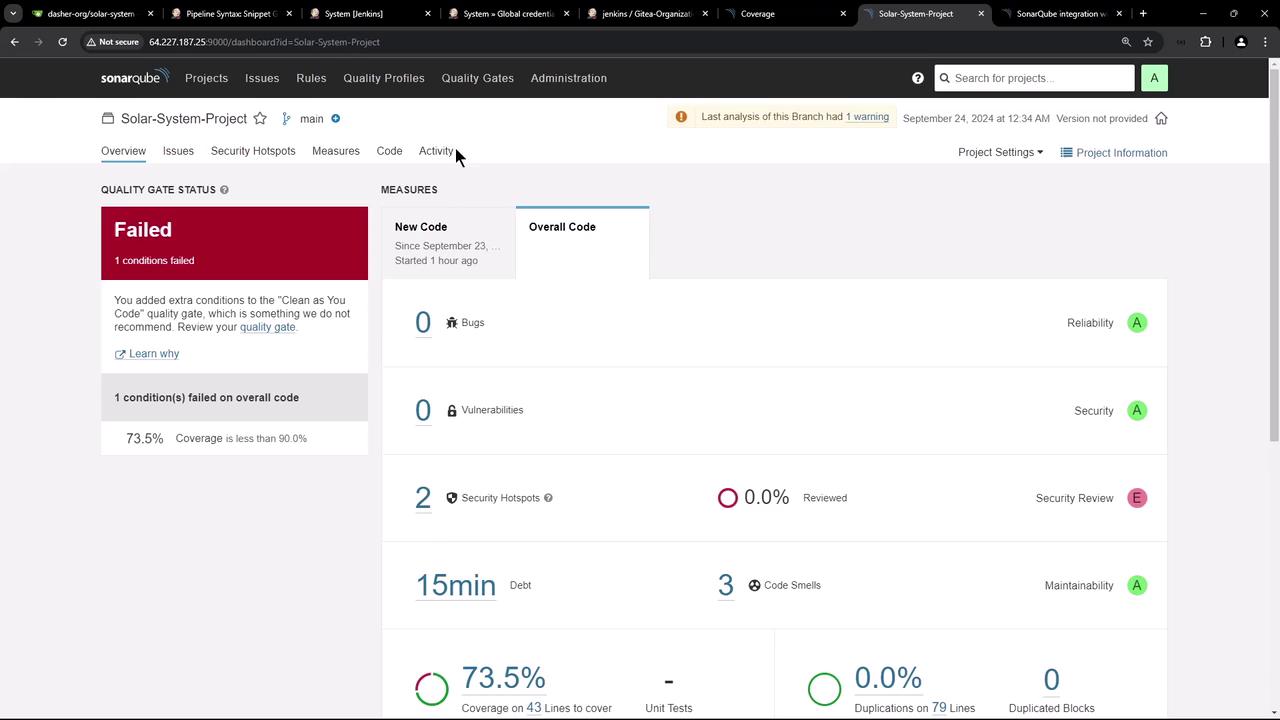
You can also verify the failed status on the SonarQube dashboard:

The image shows a Jenkins pipeline interface for a project named "solar-system" with various stages like installing dependencies, unit testing, and SAST using SonarQube. The SAST stage has failed, indicated by a red cross.

Review the SonarQube project details:

The image shows a SonarQube dashboard for a project named "Solar-System-Project," indicating a failed quality gate due to insufficient code coverage. It displays metrics like new bugs, vulnerabilities, and code smells, all of which are currently at zero.

The webhook delivers a JSON payload similar to the following:

{
  "serverUrl": "http://localhost:9000",
  "taskId": "Ai7jRybMUtl41hUM",
  "status": "SUCCESS",
  "analysedAt": "2024-09-23T19:04:20+00:00",
  "revision": "241b54d305c462f8c326f32d4cbfc330f8",
  "changedAt": "2024-09-23T19:04:20+00:00",
  "project": {
    "key": "Solar-System-Project",
    "name": "Solar-System-Project",
    "url": "http://localhost:9000/dashboard?id=Solar-System-Project"
  },
  "branch": {
    "name": "main",
    "type": "BRANCH",
    "isMain": true,
    "url": "http://localhost:9000/dashboard?id=Solar-System-Project"
  },
  "qualityGate": {
    "name": "Dasher-Quality-Gate",
    "status": "ERROR"
  }
}

In this scenario, the pipeline aborts when the quality gate fails (for example, due to insufficient code coverage).


Managing and Updating Quality Gate Settings

For subsequent demos or builds, update the quality gate configuration in SonarQube (for example, lower the coverage threshold) to pass the analysis. You can retrigger the pipeline or restart only the SonarQube stage. Once the quality gate status is successful, the build continues and completes successfully.

When reviewing the detailed quality gate conditions in SonarQube, you might see output like this:

[
    {
        "metric": "new_coverage",
        "operator": "LESS_THAN",
        "status": "NO_VALUE",
        "errorThreshold": "80"
    },
    {
        "metric": "coverage",
        "operator": "LESS_THAN",
        "value": "73.5",
        "status": "OK",
        "errorThreshold": "70"
    },
    {
        "metric": "new_duplicated_lines_density",
        "operator": "GREATER_THAN",
        "status": "NO_VALUE",
        "errorThreshold": "3"
    },
    {
        "metric": "new_security_hotspots_reviewed",
        "operator": "LESS_THAN",
        "status": "NO_VALUE",
        "errorThreshold": "100"
    }
]

Check the SonarQube dashboard for final confirmation:

The image shows a SonarQube dashboard displaying the analysis results for a project named "Solar-System-Project," which has failed the quality gate due to issues like code smells and hotspots. The project has 73.5% coverage, 0% duplications, and is written in JavaScript.

Further inspection of build details:

The image shows a SonarQube dashboard for a project named "Solar-System-Project," indicating a failed quality gate due to insufficient code coverage. It displays metrics such as bugs, vulnerabilities, security hotspots, and code smells.

Through this integration, SonarQube helps identify quality issues and enforces quality gates to control the build process. Addressing the quality issues—such as increasing code coverage—ensures that the pipeline will eventually succeed.


Thank you for following this lesson on integrating SonarQube with Jenkins and refactoring your pipeline configuration.

Watch Video

Watch video content

Practice Lab

Practice lab

Previous
SAST Analysis