> ## Documentation Index
> Fetch the complete documentation index at: https://notes.kodekloud.com/llms.txt
> Use this file to discover all available pages before exploring further.
# Installing Katib
> Guide to installing and verifying Katib on Kubernetes, deploying manifests to run hyperparameter tuning, accessing the Katib UI, and troubleshooting common installation issues.
Katib is Kubeflow’s Kubernetes-native hyperparameter tuning and experiment management system. To install Katib as a standalone deployment, apply the official Kubernetes manifests from the Katib repository. These manifests create controllers, database components, services, and the Katib UI necessary to run experiments inside your cluster.
## Quick install
Run the following command to deploy Katib (uses the v0.17.0 manifests in this example):
```bash theme={null}
kubectl apply -k "github.com/kubeflow/katib.git/manifests/v1beta1/installs/katib-standalone?ref=v0.17.0"
```
This deploys a complete experimentation platform that manages Experiments, Suggestions, and Trials for hyperparameter optimization.
## Verify the installation
Katib components are deployed into the `kubeflow` namespace. Kubernetes items can initialize asynchronously, so allow a few moments for pods to reach the Running state. Check pod status with:
```bash theme={null}
kubectl get pods -n kubeflow
```
Example output while components are initializing:
```bash theme={null}
NAME READY STATUS RESTARTS AGE
katib-controller-775586869f-nwx94 0/1 ContainerCreating 0 8s
katib-db-manager-7957f4f88-xnxht 0/1 ContainerCreating 0 8s
katib-mysql-695d8c4fc6-tntqf 0/1 ContainerCreating 0 8s
katib-ui-7fdc68fcd4-jtvpl 0/1 ContainerCreating 0 8s
```
Want to watch status updates in real time? Use `kubectl get pods -n kubeflow -w` to stream pod status changes until they become `Ready`.
A successful Katib installation typically includes these primary components:
| Component | Role |
| -: | - |
| `katib-controller` | Reconciles `Experiment`, `Suggestion`, and `Trial` CRs and manages optimization workflows. |
| `katib-db-manager` | Handles experiment metadata and coordinates database interactions. |
| `katib-mysql` | Persistent storage for experiments, trials, and results. |
| `katib-ui` | Web dashboard to monitor and manage experiments visually. |
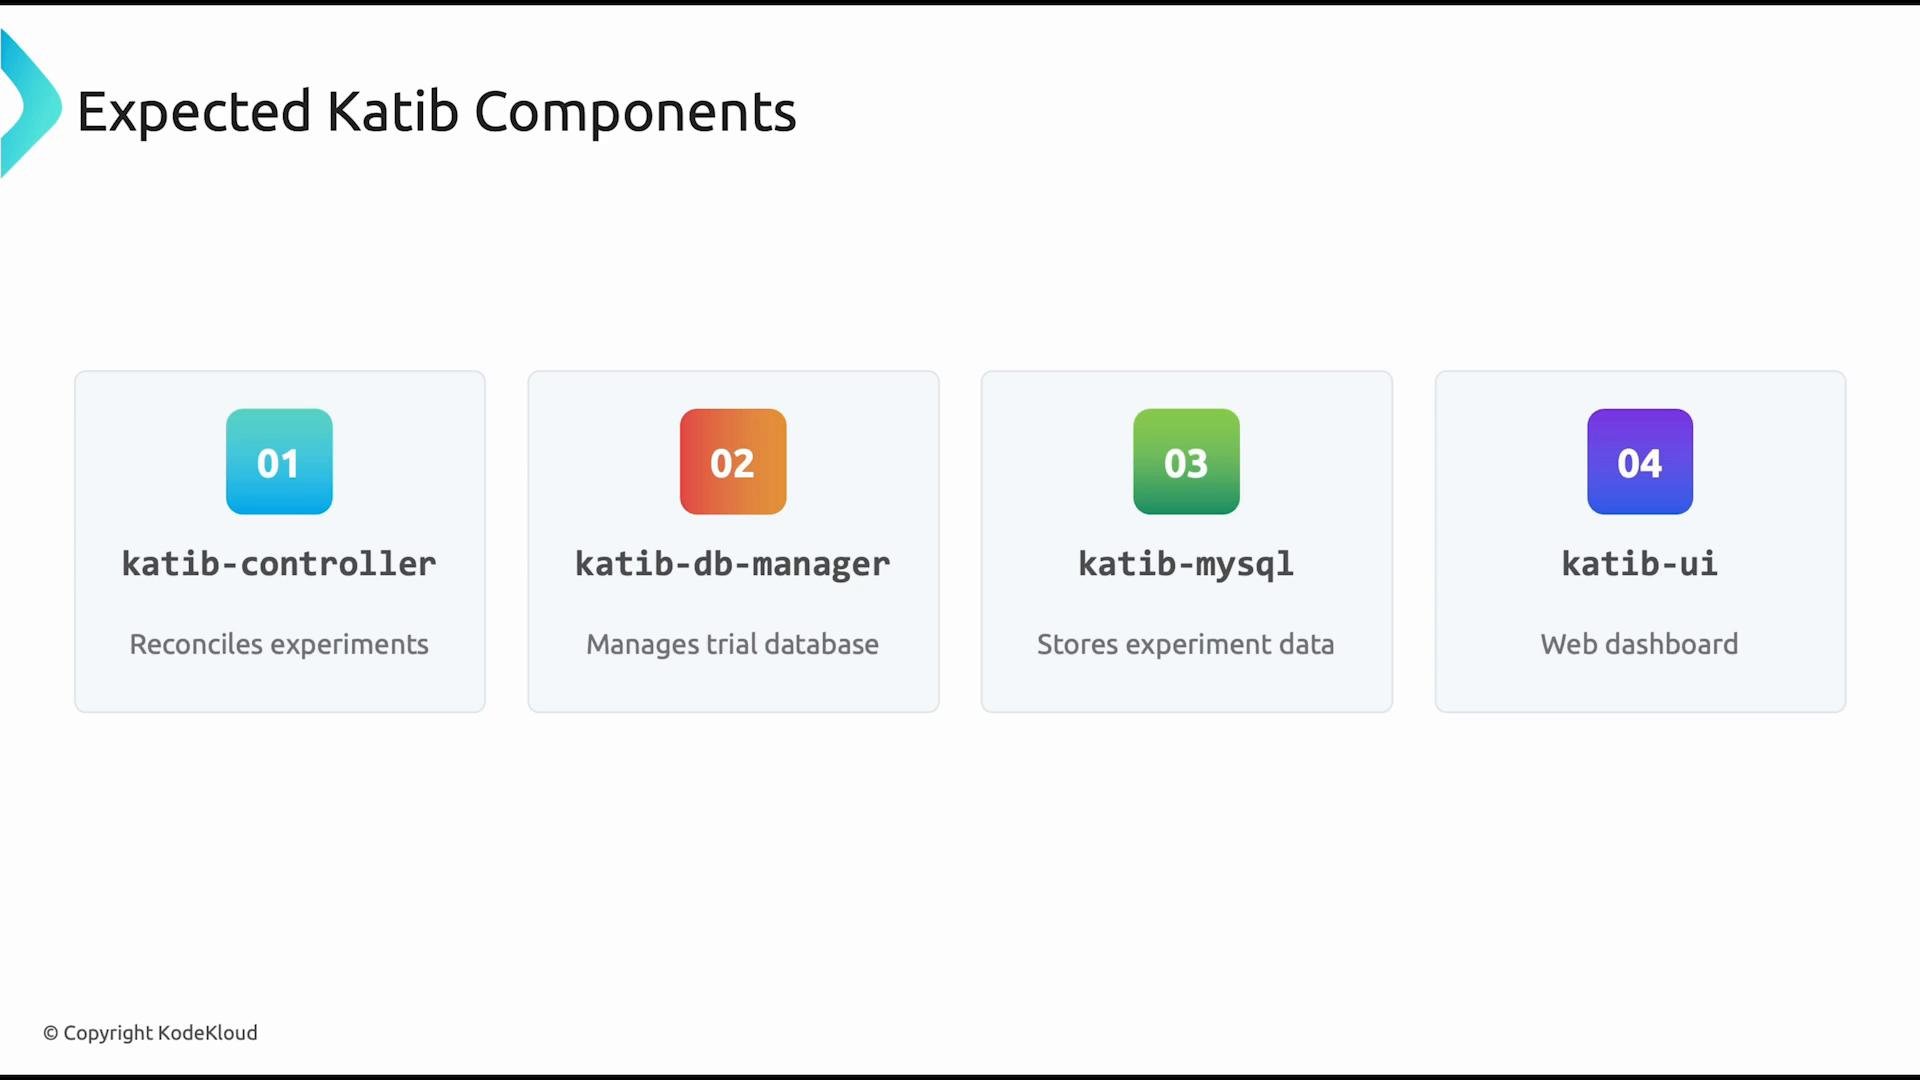 Together, these components form the Katib experimentation platform. The Katib UI provides a visual way to monitor experiments, inspect trial runs, compare results, and manage optimization workflows.
## Accessing the Katib UI
To view the Katib dashboard locally, port-forward the UI service and open the forwarded port in your browser. First, confirm the service name and port:
```bash theme={null}
kubectl get svc -n kubeflow
```
Then create a port-forward to the Katib UI service (example):
```bash theme={null}
kubectl port-forward -n kubeflow svc/katib-ui 8080:80
```
Open `http://localhost:8080` (or the local port you forwarded) to access the dashboard. If the service uses a different port, adjust the `8080:80` mapping accordingly.
## Common issues & troubleshooting
If pods remain in `ContainerCreating` or `CrashLoopBackOff`, check container image pulls, node resource availability, and persistent volume claims. Use `kubectl describe pod -n kubeflow` and `kubectl logs -n kubeflow` to gather troubleshooting details.
Useful commands for debugging:
* View events and pod details:
```bash theme={null}
kubectl describe pod -n kubeflow
kubectl get events -n kubeflow --sort-by='.metadata.creationTimestamp'
```
* Inspect logs of a failing pod:
```bash theme={null}
kubectl logs -n kubeflow
```
* Confirm CRDs and RBAC (Katib requires its CRDs to be present):
```bash theme={null}
kubectl get crds | grep katib
```
## Links and references
* Official Katib repository: [https://github.com/kubeflow/katib](https://github.com/kubeflow/katib)
* Kubeflow documentation: [https://www.kubeflow.org/docs/](https://www.kubeflow.org/docs/)
* Example manifests used above: `https://github.com/kubeflow/katib.git/manifests/v1beta1/installs/katib-standalone?ref=v0.17.0`
By following these steps you will have Katib installed and available for running hyperparameter tuning experiments on your Kubernetes cluster.
This documentation is built and hosted on [Mintlify](https://mintlify.com), a developer documentation platform.
Together, these components form the Katib experimentation platform. The Katib UI provides a visual way to monitor experiments, inspect trial runs, compare results, and manage optimization workflows.
## Accessing the Katib UI
To view the Katib dashboard locally, port-forward the UI service and open the forwarded port in your browser. First, confirm the service name and port:
```bash theme={null}
kubectl get svc -n kubeflow
```
Then create a port-forward to the Katib UI service (example):
```bash theme={null}
kubectl port-forward -n kubeflow svc/katib-ui 8080:80
```
Open `http://localhost:8080` (or the local port you forwarded) to access the dashboard. If the service uses a different port, adjust the `8080:80` mapping accordingly.
## Common issues & troubleshooting
If pods remain in `ContainerCreating` or `CrashLoopBackOff`, check container image pulls, node resource availability, and persistent volume claims. Use `kubectl describe pod -n kubeflow` and `kubectl logs -n kubeflow` to gather troubleshooting details.
Useful commands for debugging:
* View events and pod details:
```bash theme={null}
kubectl describe pod -n kubeflow
kubectl get events -n kubeflow --sort-by='.metadata.creationTimestamp'
```
* Inspect logs of a failing pod:
```bash theme={null}
kubectl logs -n kubeflow
```
* Confirm CRDs and RBAC (Katib requires its CRDs to be present):
```bash theme={null}
kubectl get crds | grep katib
```
## Links and references
* Official Katib repository: [https://github.com/kubeflow/katib](https://github.com/kubeflow/katib)
* Kubeflow documentation: [https://www.kubeflow.org/docs/](https://www.kubeflow.org/docs/)
* Example manifests used above: `https://github.com/kubeflow/katib.git/manifests/v1beta1/installs/katib-standalone?ref=v0.17.0`
By following these steps you will have Katib installed and available for running hyperparameter tuning experiments on your Kubernetes cluster.
This documentation is built and hosted on [Mintlify](https://mintlify.com), a developer documentation platform.