> ## Documentation Index
> Fetch the complete documentation index at: https://notes.kodekloud.com/llms.txt
> Use this file to discover all available pages before exploring further.
# The Iris Dataset
> Overview of the Iris dataset, its four numeric features and three species classification task, with a scikit-learn example for loading, splitting, preprocessing, training, and evaluation.
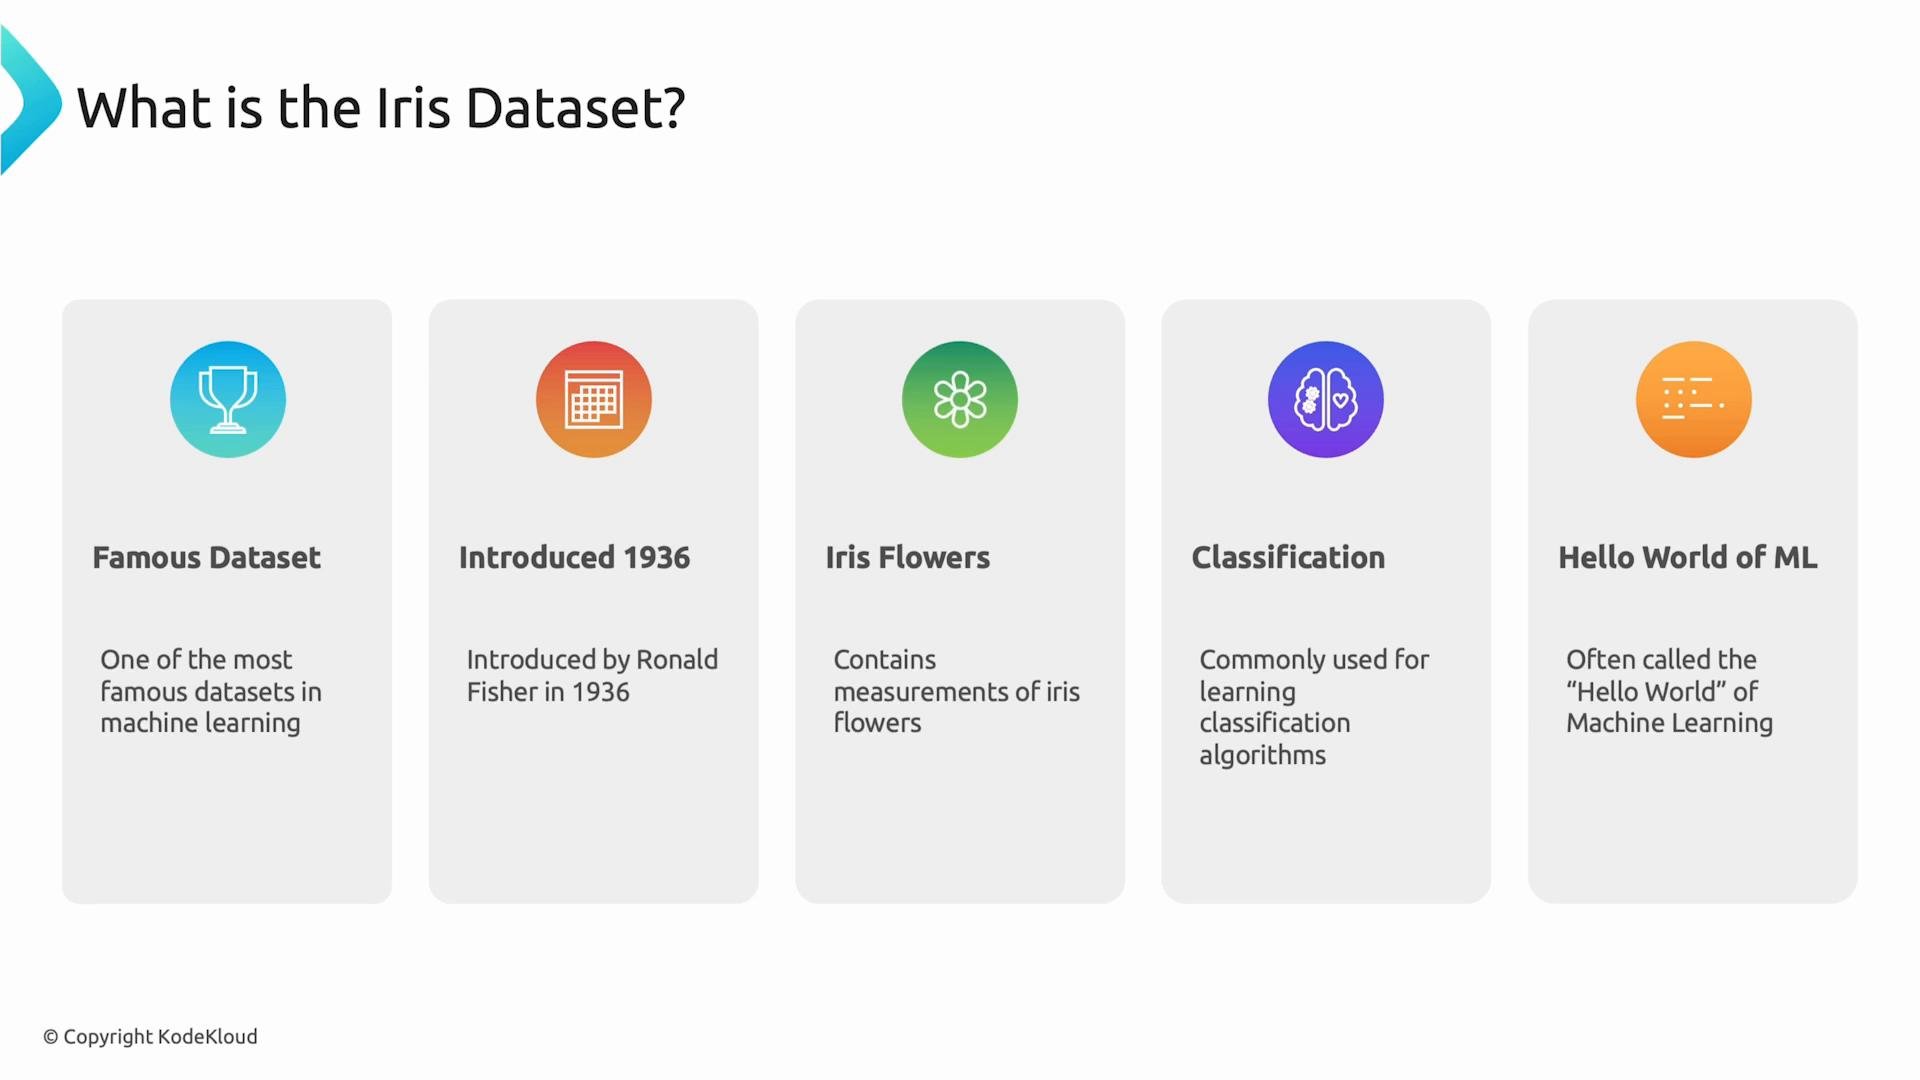
The Iris dataset is one of the most iconic datasets in machine learning. Introduced by statistician Ronald Fisher in 1936, it remains a standard teaching and benchmarking dataset for classification tasks. Because it is small, clean, and easy to understand, the Iris dataset is often called the "hello world" of machine learning.
Throughout this article we use the Iris dataset to demonstrate core supervised-learning concepts: data inspection, feature understanding, train/test splitting, preprocessing, training, and evaluation.
 ## Problem type: classification
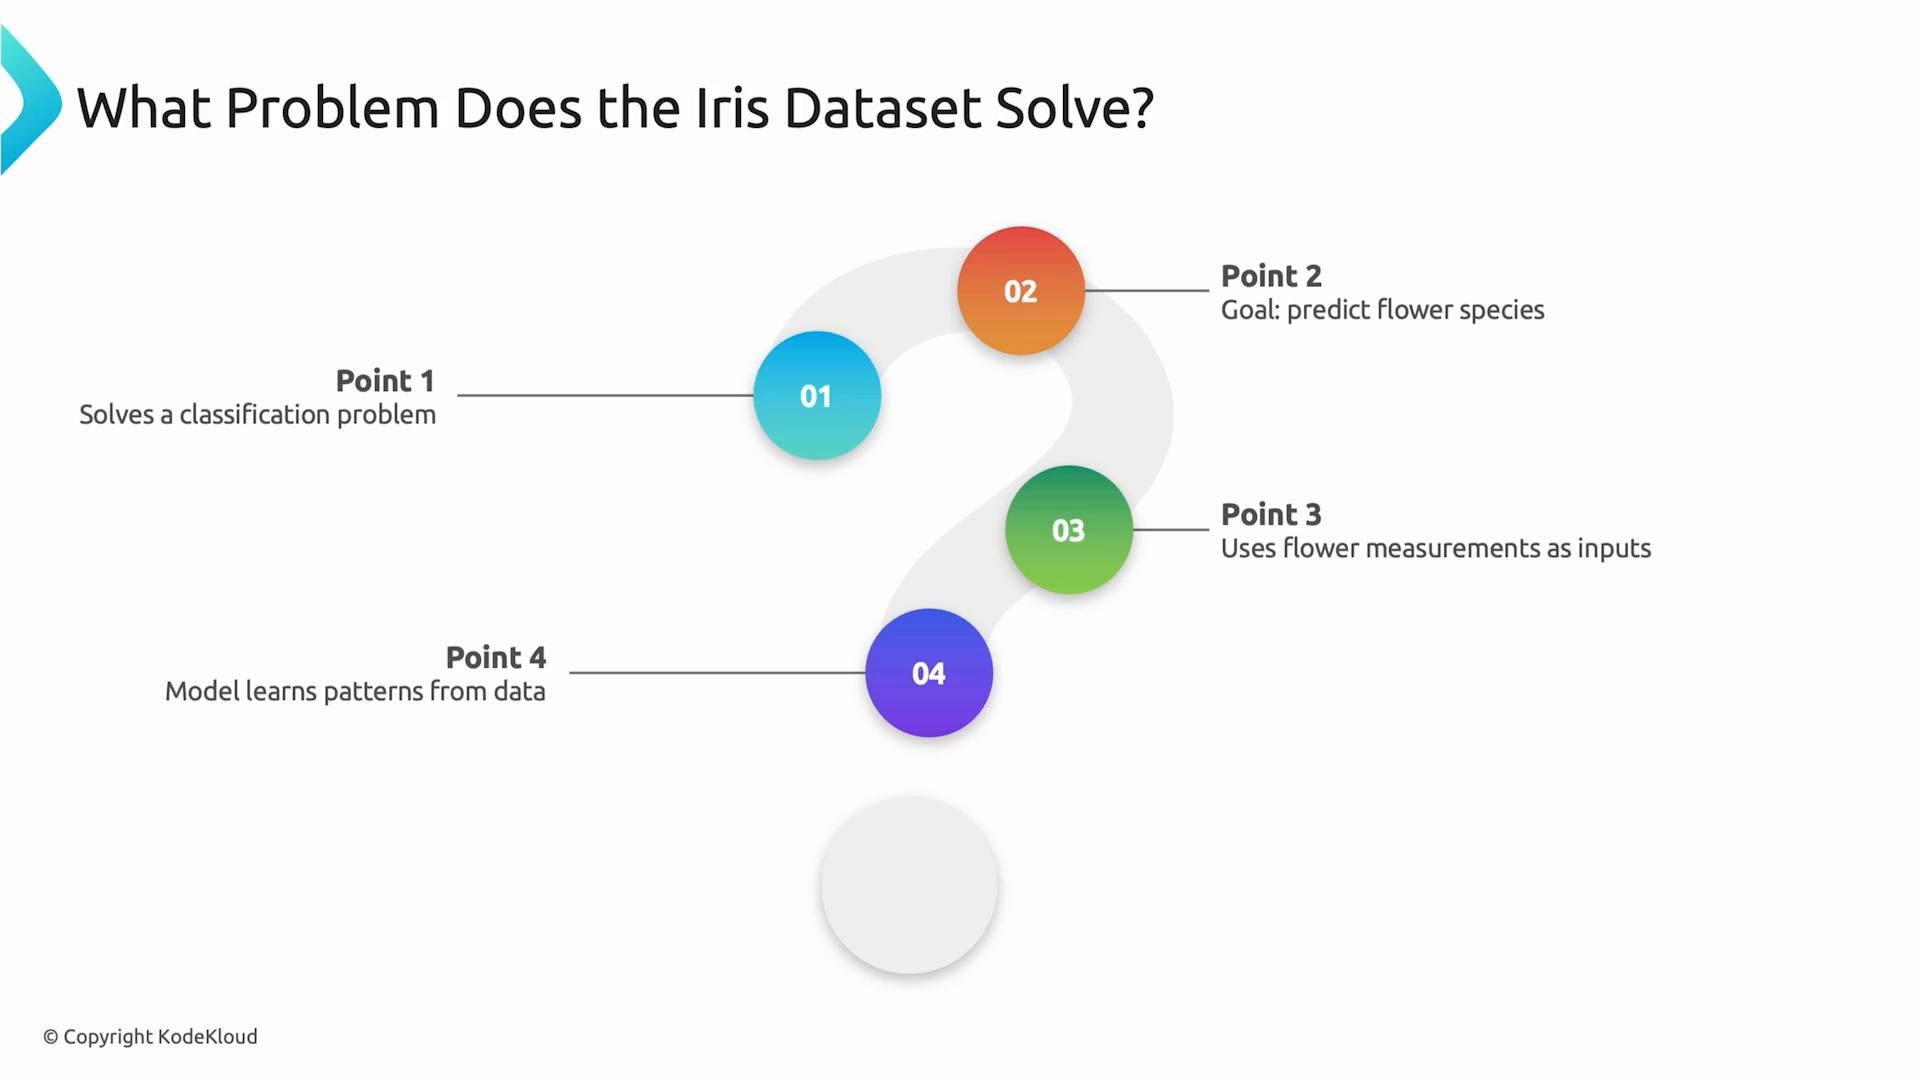
The Iris dataset is a multiclass classification problem: given numerical measurements of a flower, predict its species. A model learns patterns from the numeric input features and outputs one of the target species. This is a canonical example for teaching supervised classification pipelines.
## Problem type: classification
The Iris dataset is a multiclass classification problem: given numerical measurements of a flower, predict its species. A model learns patterns from the numeric input features and outputs one of the target species. This is a canonical example for teaching supervised classification pipelines.
 ## Target classes: three species
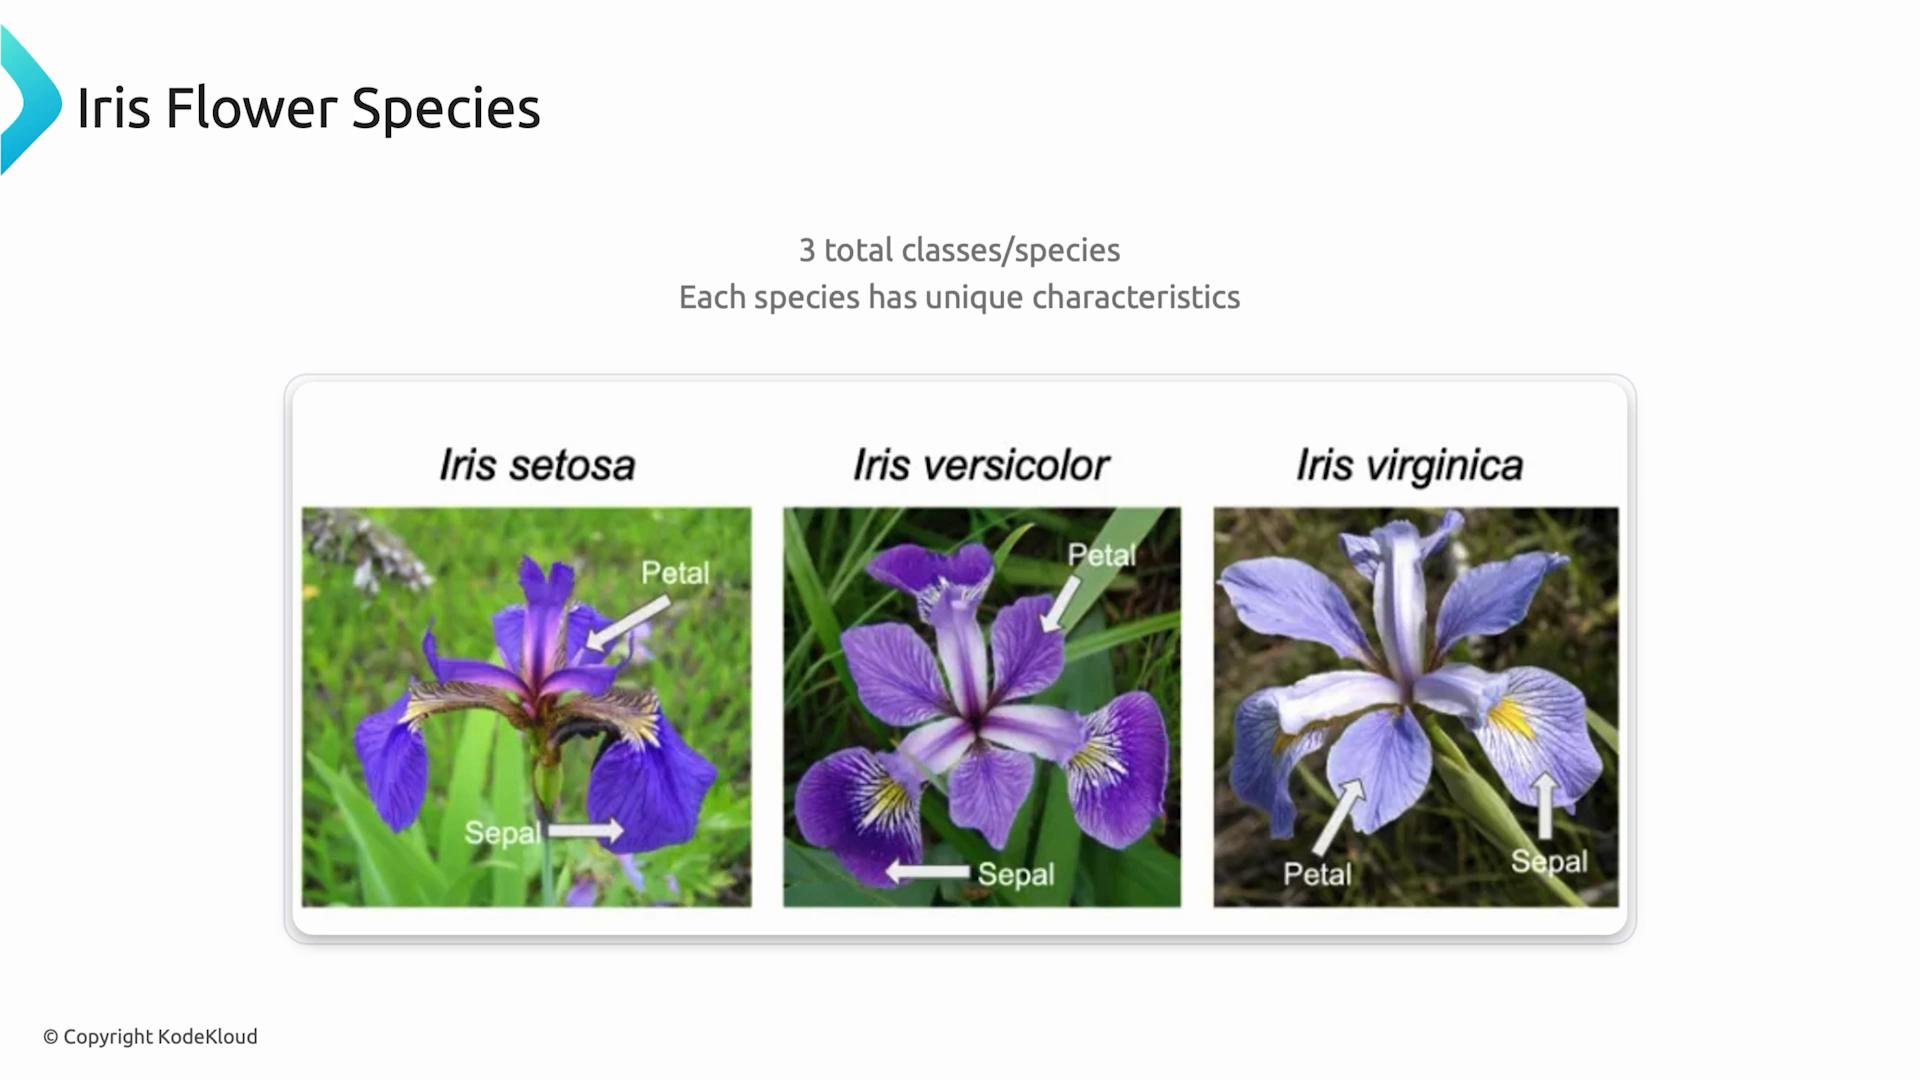
There are three labeled species in the dataset:
* Iris setosa
* Iris versicolor
* Iris virginica
These species serve as the target labels the model must predict. Their measurements differ enough for many algorithms to separate them effectively, but some class pairs are more challenging than others.
## Target classes: three species
There are three labeled species in the dataset:
* Iris setosa
* Iris versicolor
* Iris virginica
These species serve as the target labels the model must predict. Their measurements differ enough for many algorithms to separate them effectively, but some class pairs are more challenging than others.
 ## Features: four numeric measurements
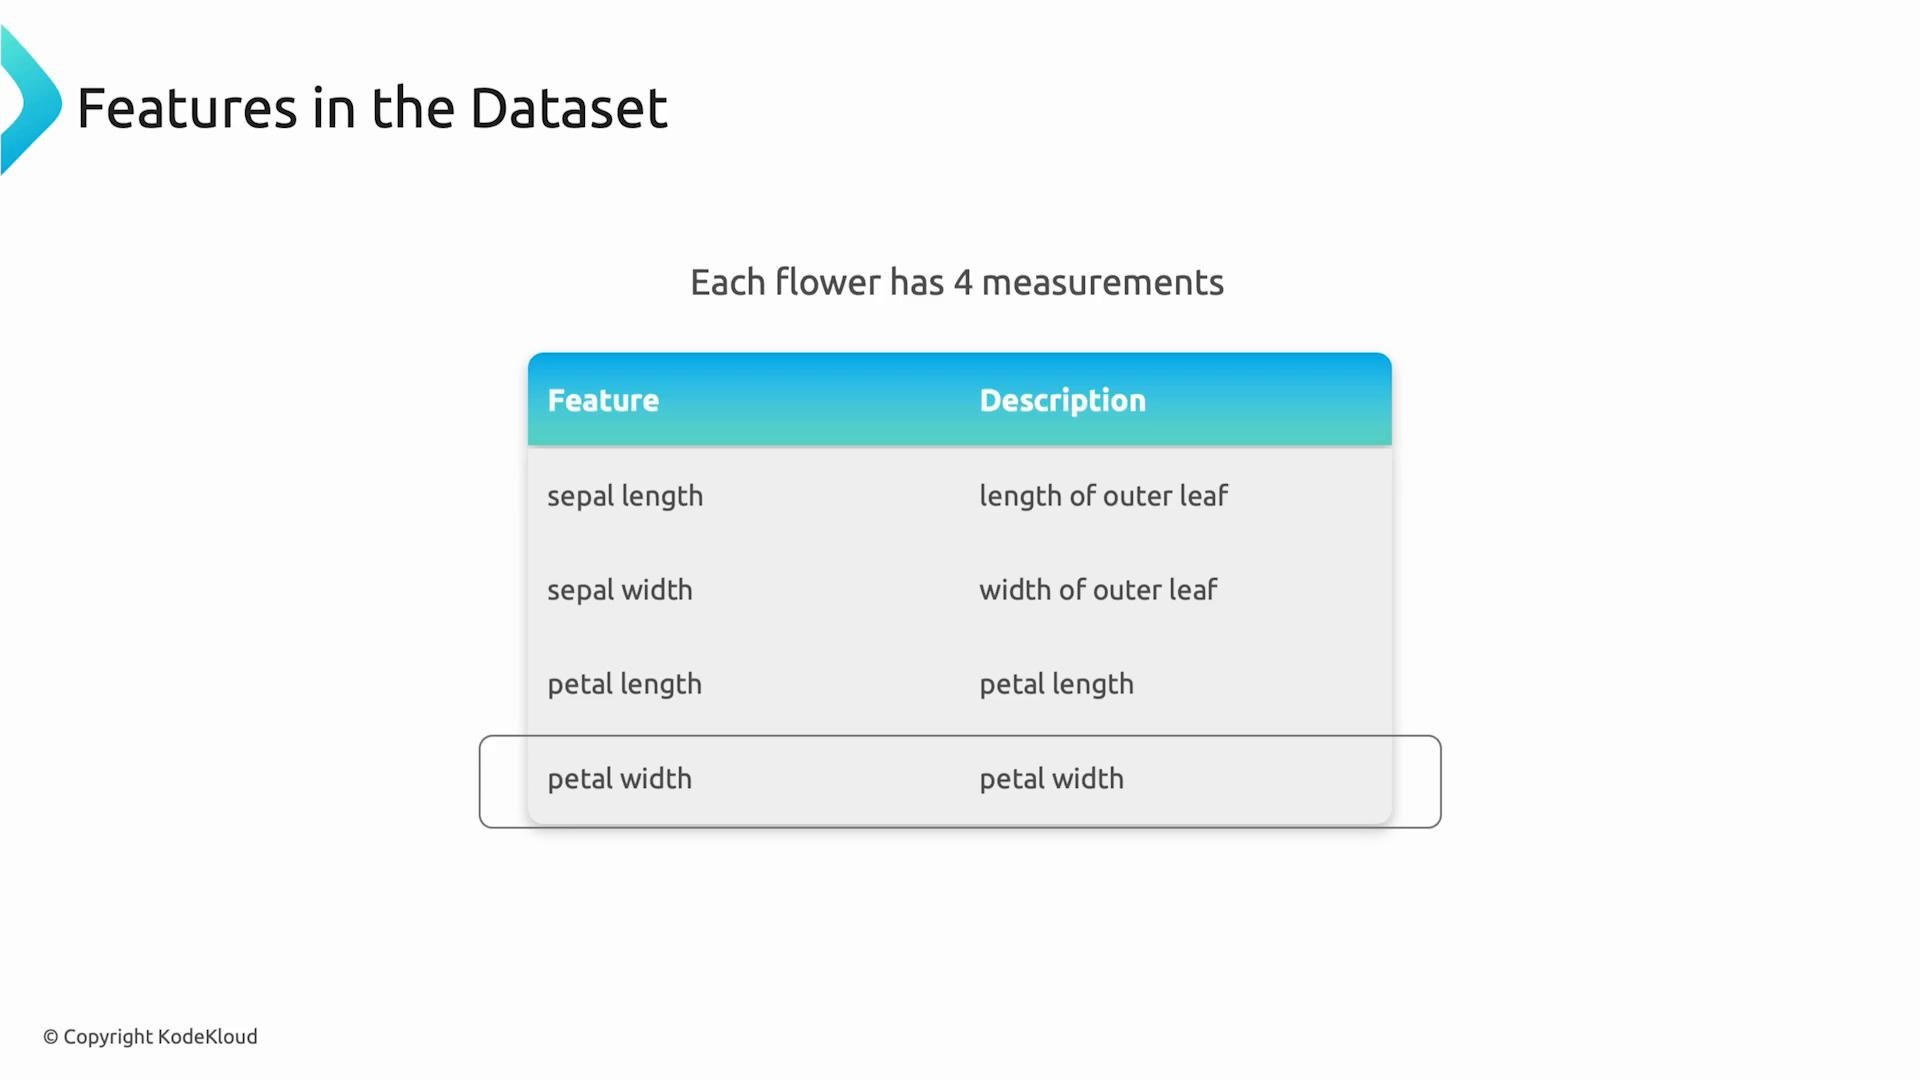
Each observation contains four numeric features:
* sepal length (cm)
* sepal width (cm)
* petal length (cm)
* petal width (cm)
Features are the inputs the model uses to learn the mapping to species labels. Understanding which features are present and their scales helps decide preprocessing steps like scaling or feature selection.
## Features: four numeric measurements
Each observation contains four numeric features:
* sepal length (cm)
* sepal width (cm)
* petal length (cm)
* petal width (cm)
Features are the inputs the model uses to learn the mapping to species labels. Understanding which features are present and their scales helps decide preprocessing steps like scaling or feature selection.
 ## Why the Iris dataset is so popular
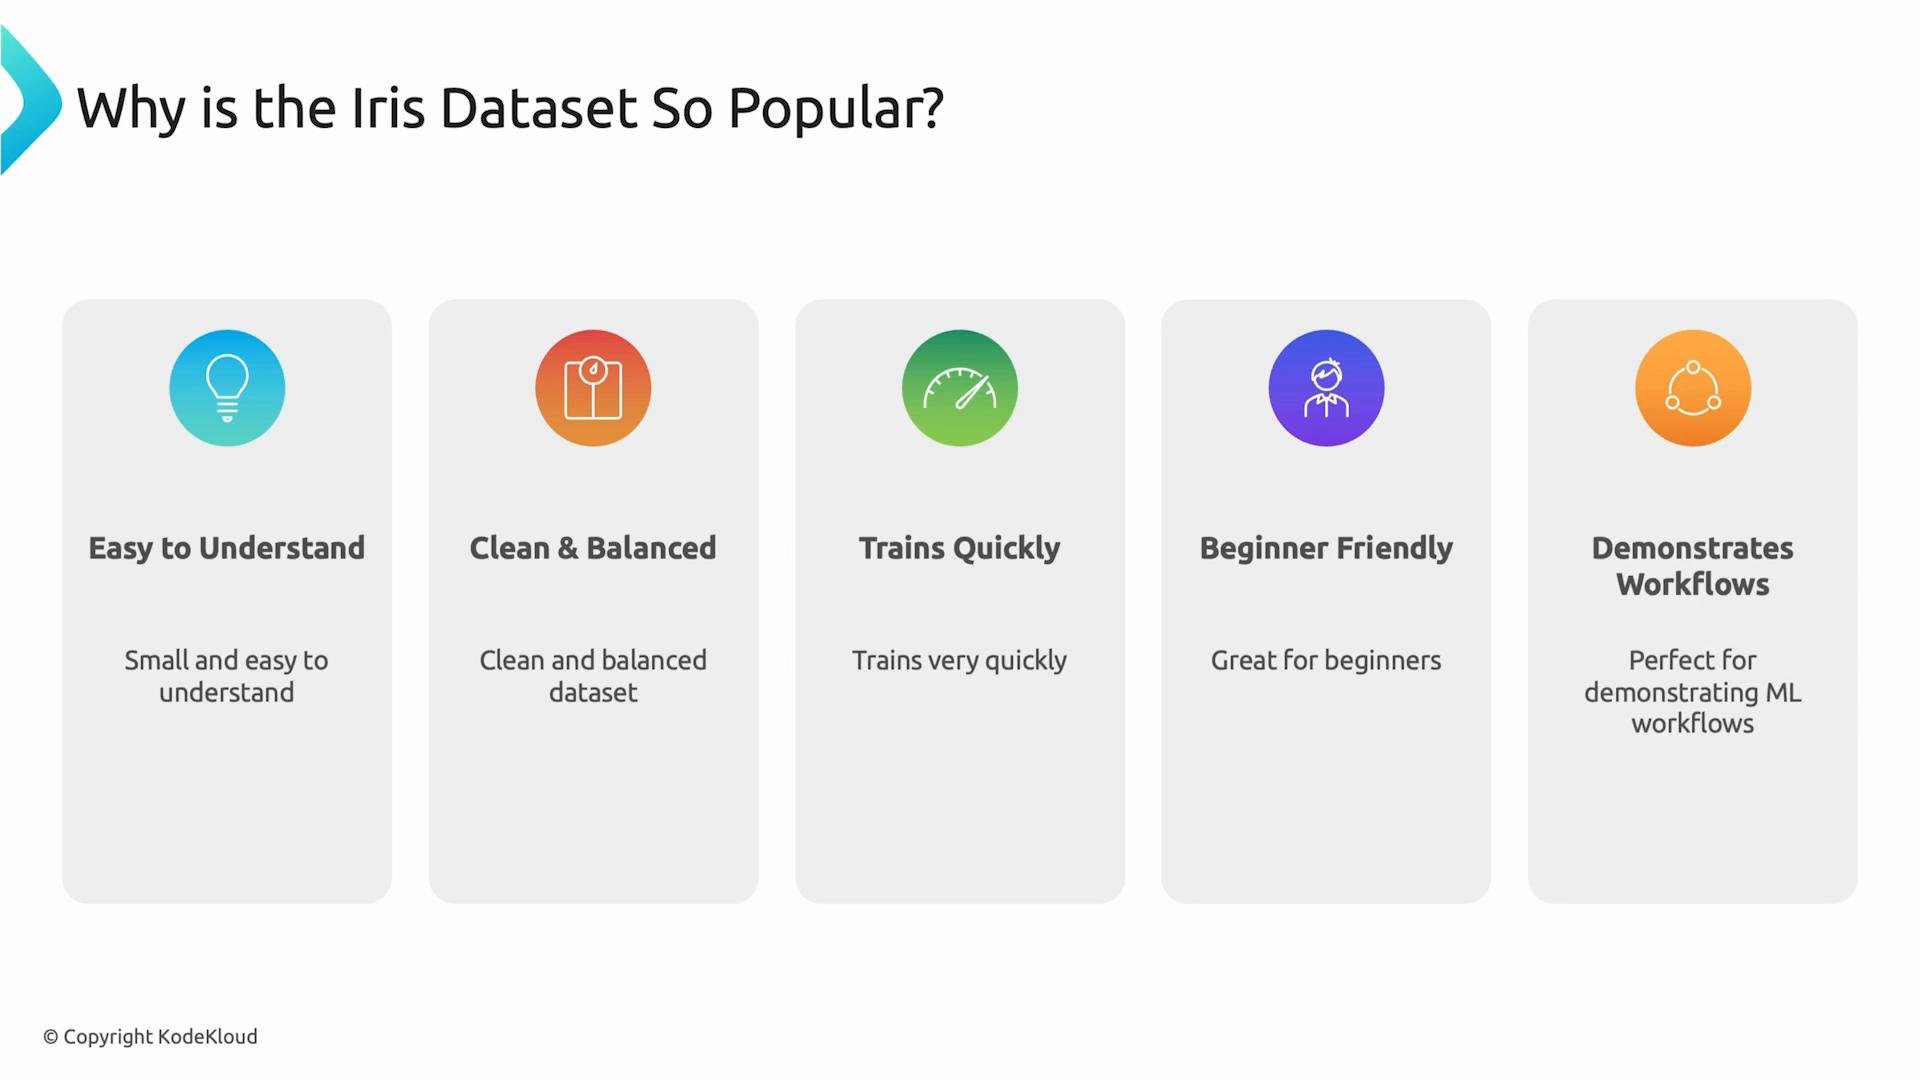
The Iris dataset is widely used because it strikes a balance between simplicity and pedagogical value:
* Easy to understand and visualize
* Clean and balanced classes
* Small enough to train quickly
* Great for demonstrating full ML workflows (inspect → split → preprocess → train → evaluate)
These properties make it ideal for tutorials, demos, and exploratory model experiments.
## Why the Iris dataset is so popular
The Iris dataset is widely used because it strikes a balance between simplicity and pedagogical value:
* Easy to understand and visualize
* Clean and balanced classes
* Small enough to train quickly
* Great for demonstrating full ML workflows (inspect → split → preprocess → train → evaluate)
These properties make it ideal for tutorials, demos, and exploratory model experiments.
 ## Where to get the dataset
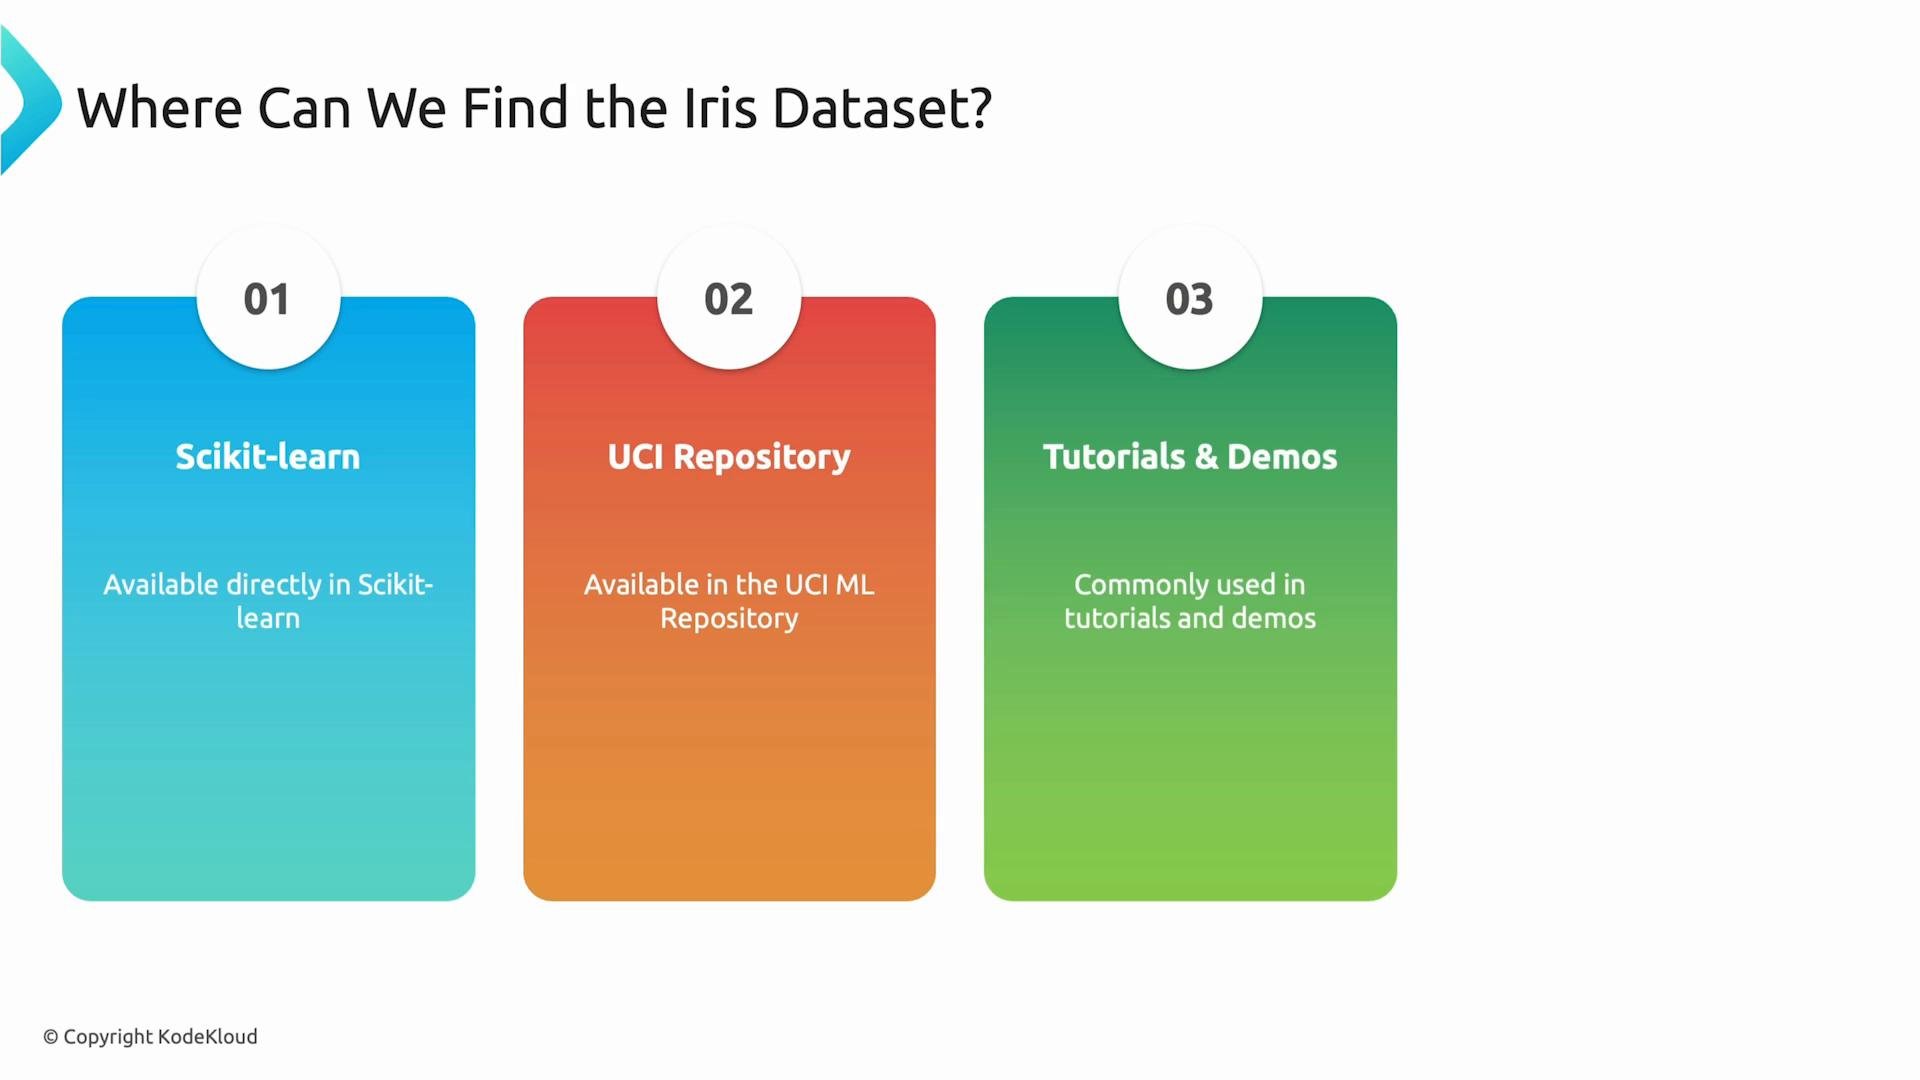
The Iris dataset is bundled with several ML libraries and is also available from classic repositories:
* scikit-learn: load with a single function call
* UCI Machine Learning Repository: canonical dataset source
* Many tutorials and teaching resources include ready-to-use copies
## Where to get the dataset
The Iris dataset is bundled with several ML libraries and is also available from classic repositories:
* scikit-learn: load with a single function call
* UCI Machine Learning Repository: canonical dataset source
* Many tutorials and teaching resources include ready-to-use copies
 ## Quick dataset facts
| Property | Value |
| - | - |
| Observations | 150 |
| Features | 4 (numeric) |
| Classes | 3 (Setosa, Versicolor, Virginica) |
| Typical use | Supervised multiclass classification |
| Common sources | [scikit-learn](https://scikit-learn.org/stable/modules/generated/sklearn.datasets.load_iris.html), [UCI Repository](https://archive.ics.uci.edu/ml/datasets/iris) |
A typical workflow is: load the dataset, inspect features and labels, split into training and test sets (use `stratify` to preserve class balance), apply preprocessing (e.g., scaling), train a model, and evaluate on held-out data.
## Example: load, inspect, split, and train
Below is a compact scikit-learn example that demonstrates the essential steps. Comments explain each step. Run this in a Python environment with scikit-learn and pandas installed.
```python theme={null}
# Load the dataset and inspect it
from sklearn.datasets import load_iris
iris = load_iris(as_frame=True) # returns a Bunch with a pandas DataFrame
X = iris.data
y = iris.target
print("Feature names:", iris.feature_names)
print("Target names:", list(iris.target_names))
print("Data shape:", X.shape)
```
Expected console output (example):
```text theme={null}
Feature names: ['sepal length (cm)', 'sepal width (cm)', 'petal length (cm)', 'petal width (cm)']
Target names: ['setosa', 'versicolor', 'virginica']
Data shape: (150, 4)
```
Next, split the data into training and test sets. Use `stratify=y` to keep class proportions similar between splits.
```python theme={null}
from sklearn.model_selection import train_test_split
X_train, X_test, y_train, y_test = train_test_split(
X, y, test_size=0.2, random_state=42, stratify=y
)
```
Train a simple pipeline with standard scaling and Logistic Regression:
```python theme={null}
from sklearn.pipeline import make_pipeline
from sklearn.preprocessing import StandardScaler
from sklearn.linear_model import LogisticRegression
clf = make_pipeline(
StandardScaler(),
LogisticRegression(max_iter=200, random_state=42)
)
clf.fit(X_train, y_train)
test_accuracy = clf.score(X_test, y_test)
print("Test accuracy:", round(test_accuracy, 3))
```
On the Iris dataset, a basic pipeline like this often yields high accuracy (commonly > 0.90) because the classes are well-separated by these features.
## Summary
This article covered:
* What the Iris dataset is and why it's important for ML education
* The classification problem and the three species involved
* The four numeric features used by models
* Where to find the dataset and a quick scikit-learn example showing loading, splitting, preprocessing, and training
These steps form the foundation of most supervised-learning workflows and are a great starting point for experimenting with classification algorithms.
## Links and references
* scikit-learn: load\_iris — [https://scikit-learn.org/stable/modules/generated/sklearn.datasets.load\_iris.html](https://scikit-learn.org/stable/modules/generated/sklearn.datasets.load_iris.html)
* UCI Machine Learning Repository: Iris Data Set — [https://archive.ics.uci.edu/ml/datasets/iris](https://archive.ics.uci.edu/ml/datasets/iris)
This documentation is built and hosted on [Mintlify](https://mintlify.com), a developer documentation platform.
## Quick dataset facts
| Property | Value |
| - | - |
| Observations | 150 |
| Features | 4 (numeric) |
| Classes | 3 (Setosa, Versicolor, Virginica) |
| Typical use | Supervised multiclass classification |
| Common sources | [scikit-learn](https://scikit-learn.org/stable/modules/generated/sklearn.datasets.load_iris.html), [UCI Repository](https://archive.ics.uci.edu/ml/datasets/iris) |
A typical workflow is: load the dataset, inspect features and labels, split into training and test sets (use `stratify` to preserve class balance), apply preprocessing (e.g., scaling), train a model, and evaluate on held-out data.
## Example: load, inspect, split, and train
Below is a compact scikit-learn example that demonstrates the essential steps. Comments explain each step. Run this in a Python environment with scikit-learn and pandas installed.
```python theme={null}
# Load the dataset and inspect it
from sklearn.datasets import load_iris
iris = load_iris(as_frame=True) # returns a Bunch with a pandas DataFrame
X = iris.data
y = iris.target
print("Feature names:", iris.feature_names)
print("Target names:", list(iris.target_names))
print("Data shape:", X.shape)
```
Expected console output (example):
```text theme={null}
Feature names: ['sepal length (cm)', 'sepal width (cm)', 'petal length (cm)', 'petal width (cm)']
Target names: ['setosa', 'versicolor', 'virginica']
Data shape: (150, 4)
```
Next, split the data into training and test sets. Use `stratify=y` to keep class proportions similar between splits.
```python theme={null}
from sklearn.model_selection import train_test_split
X_train, X_test, y_train, y_test = train_test_split(
X, y, test_size=0.2, random_state=42, stratify=y
)
```
Train a simple pipeline with standard scaling and Logistic Regression:
```python theme={null}
from sklearn.pipeline import make_pipeline
from sklearn.preprocessing import StandardScaler
from sklearn.linear_model import LogisticRegression
clf = make_pipeline(
StandardScaler(),
LogisticRegression(max_iter=200, random_state=42)
)
clf.fit(X_train, y_train)
test_accuracy = clf.score(X_test, y_test)
print("Test accuracy:", round(test_accuracy, 3))
```
On the Iris dataset, a basic pipeline like this often yields high accuracy (commonly > 0.90) because the classes are well-separated by these features.
## Summary
This article covered:
* What the Iris dataset is and why it's important for ML education
* The classification problem and the three species involved
* The four numeric features used by models
* Where to find the dataset and a quick scikit-learn example showing loading, splitting, preprocessing, and training
These steps form the foundation of most supervised-learning workflows and are a great starting point for experimenting with classification algorithms.
## Links and references
* scikit-learn: load\_iris — [https://scikit-learn.org/stable/modules/generated/sklearn.datasets.load\_iris.html](https://scikit-learn.org/stable/modules/generated/sklearn.datasets.load_iris.html)
* UCI Machine Learning Repository: Iris Data Set — [https://archive.ics.uci.edu/ml/datasets/iris](https://archive.ics.uci.edu/ml/datasets/iris)
This documentation is built and hosted on [Mintlify](https://mintlify.com), a developer documentation platform.