> ## Documentation Index
> Fetch the complete documentation index at: https://notes.kodekloud.com/llms.txt
> Use this file to discover all available pages before exploring further.
# Monitoring
> Installing Kubetail and kube-prometheus-stack via Glasskube to enable real-time log streaming, Prometheus metrics, Grafana dashboards, and Alertmanager alerting for Kubernetes clusters
This article demonstrates how to use Glasskube to install two observability packages for Kubernetes: Kubetail (real-time log streaming) and the kube-prometheus-stack (Prometheus + Alertmanager + Grafana). We install Kubetail first to get immediate access to pod logs, then deploy the kube-prometheus-stack for metrics, dashboards, and alerting.
## What you'll get
* Real-time, web-based log streaming across pods and containers with Kubetail
* A full metrics & alerting stack with Prometheus, Alertmanager, Grafana, and exporters via kube-prometheus-stack
* Pre-configured dashboards and alerting rules that work out of the box
Learn more:
* [Kubernetes Basics](https://kubernetes.io/docs/concepts/overview/what-is-kubernetes/)
* [kube-prometheus (Prometheus Operator)](https://github.com/prometheus-operator/kube-prometheus)
* [Grafana documentation](https://grafana.com/docs/)
***
## Kubetail: real-time log viewer
Kubetail (as packaged by Glasskube) provides a web UI for streaming and filtering logs across your cluster in real time. It’s particularly helpful for troubleshooting multi-pod, multi-container applications.
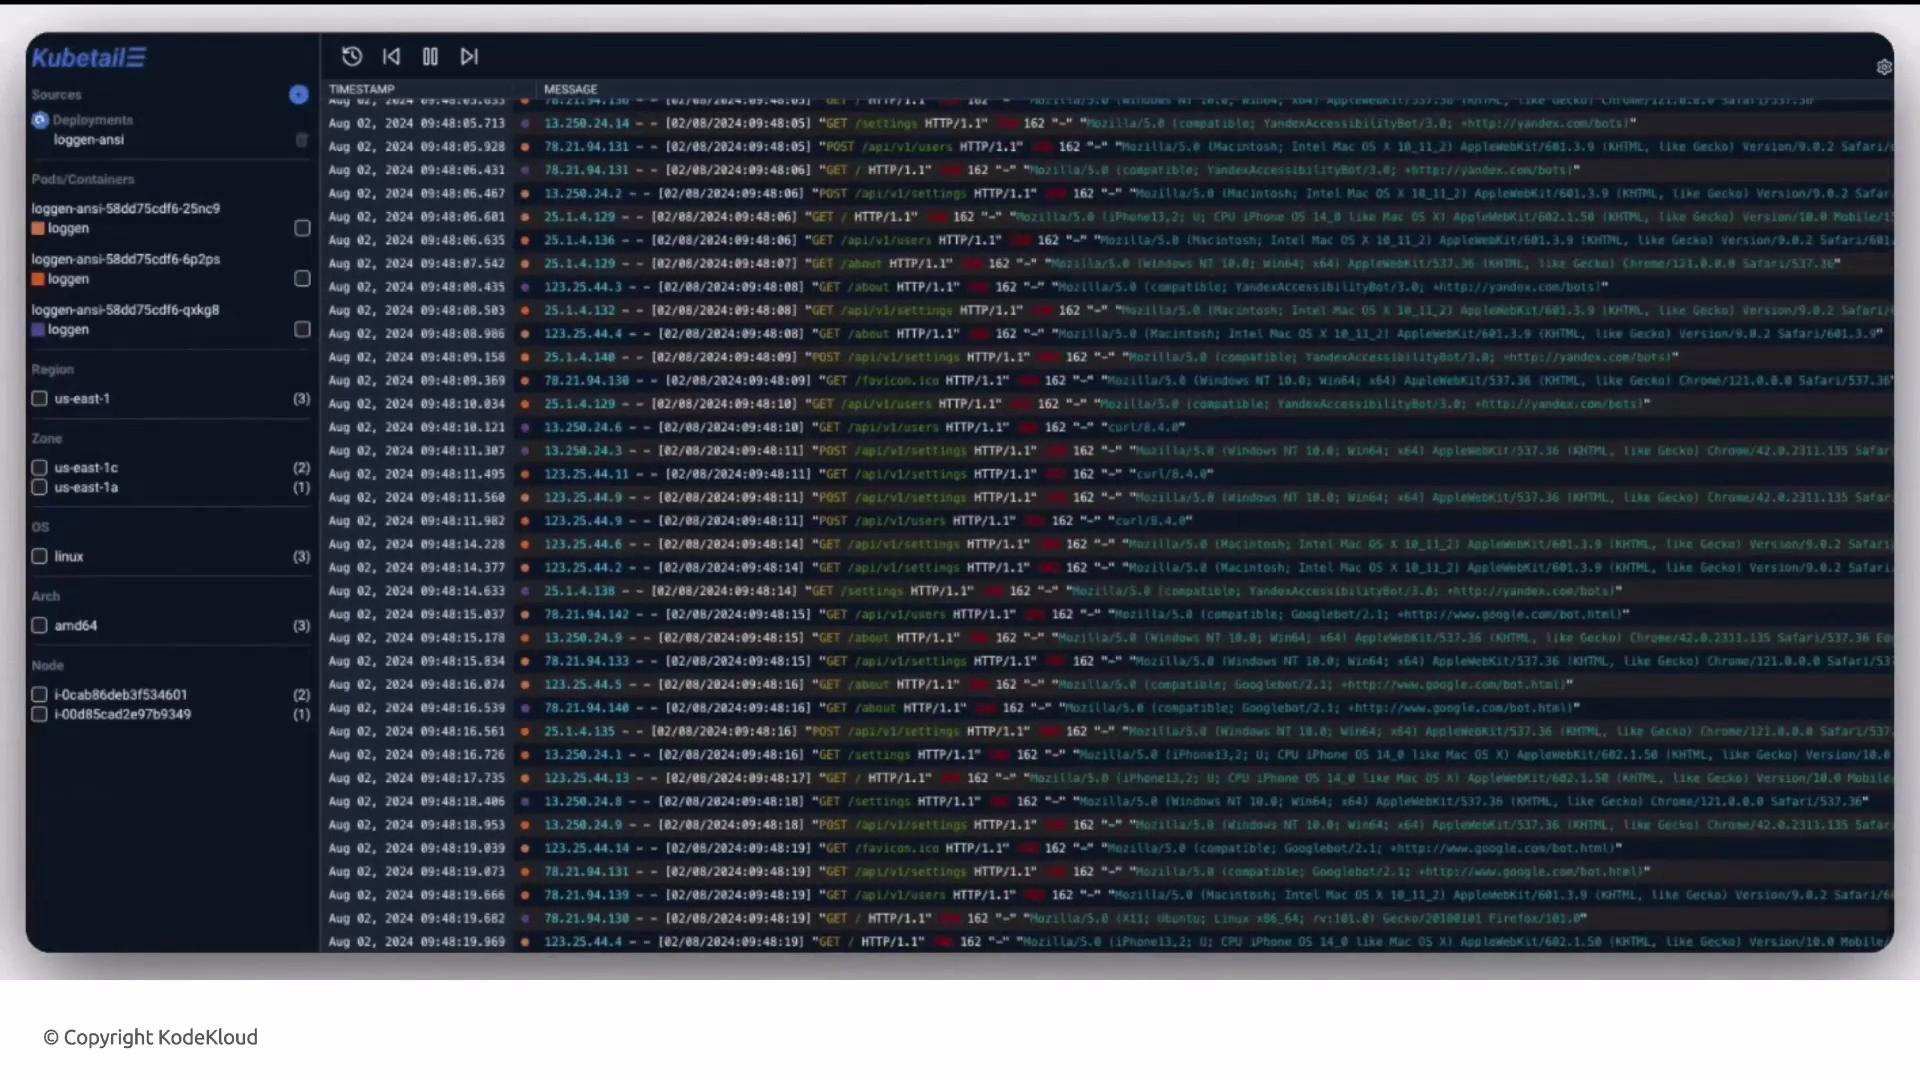 Package characteristics (Kubetail)
| Field | Value |
| ------------ | ----------------- |
| Scope | cluster-scoped |
| Values | none |
| Entrypoint | yes (frontend UI) |
| Dependencies | none |
Kubetail in the Glasskube UI:
Package characteristics (Kubetail)
| Field | Value |
| ------------ | ----------------- |
| Scope | cluster-scoped |
| Values | none |
| Entrypoint | yes (frontend UI) |
| Dependencies | none |
Kubetail in the Glasskube UI:
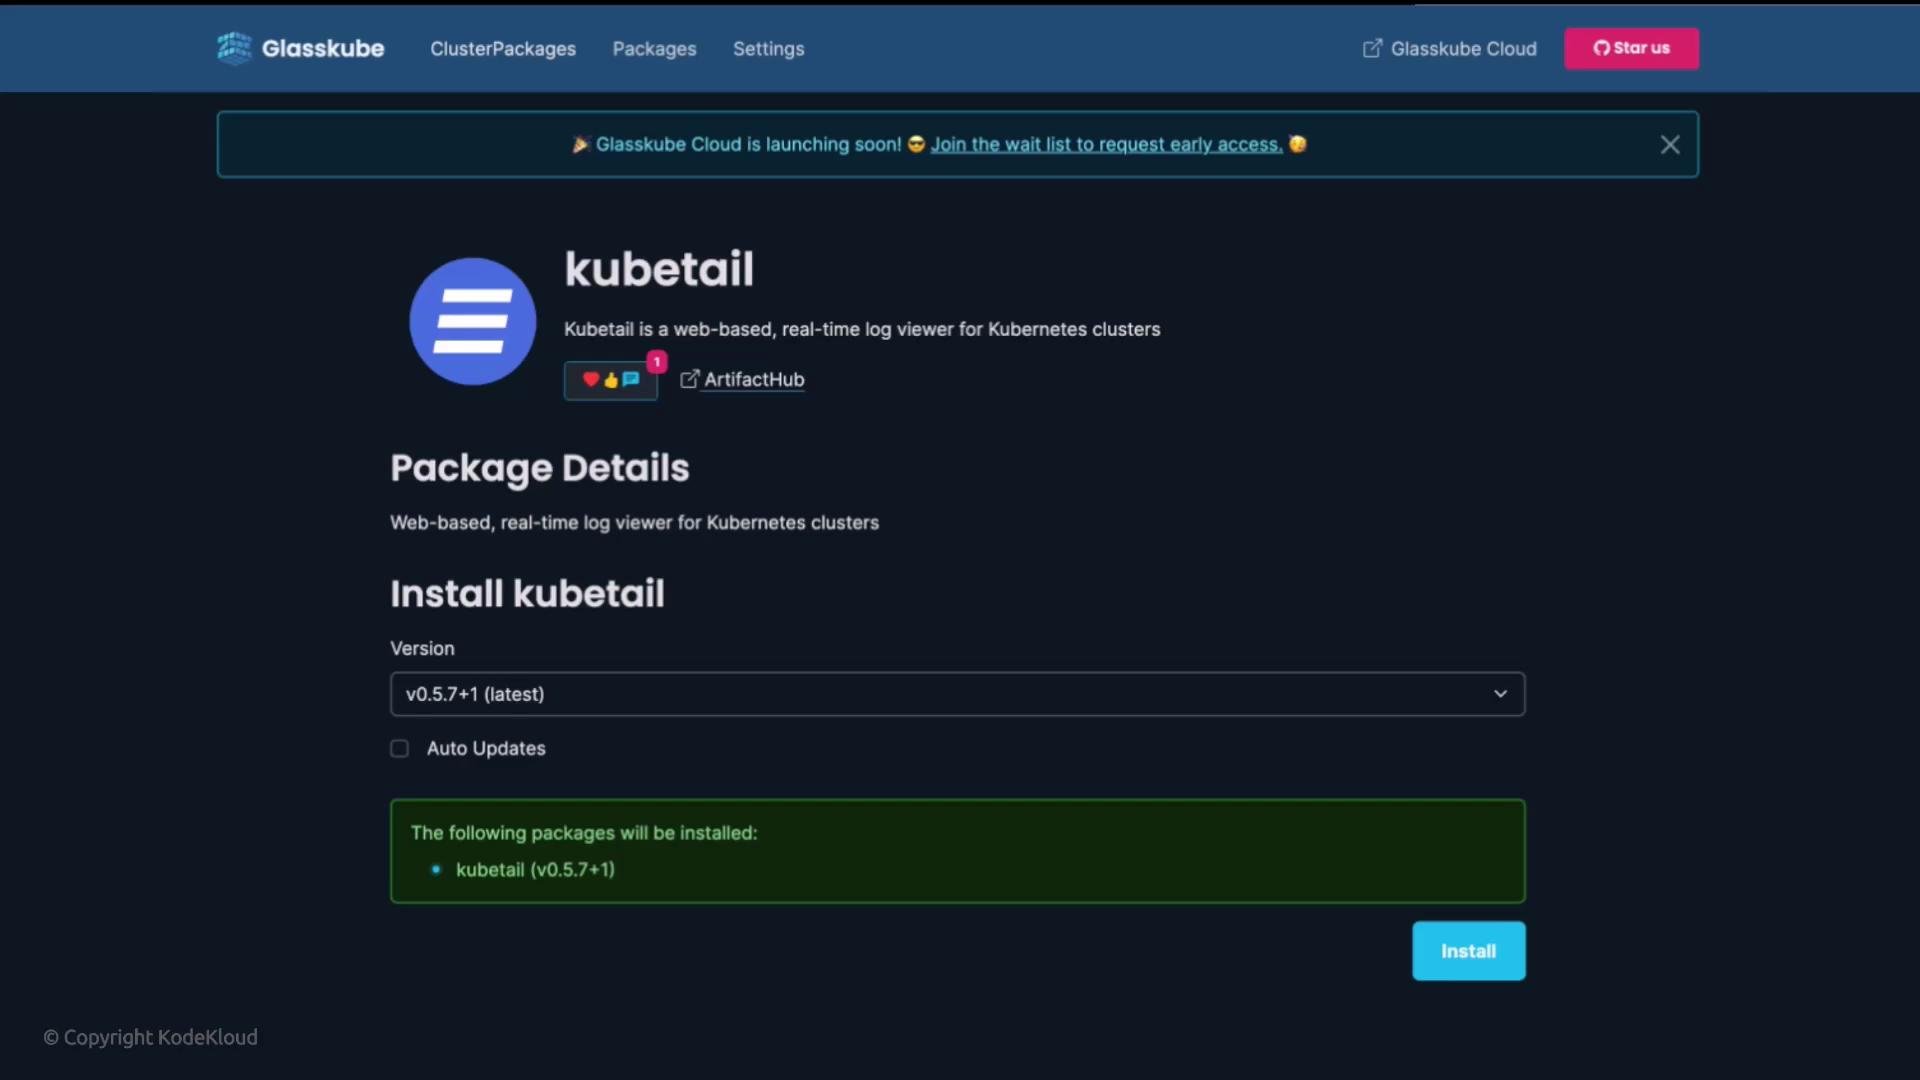 Quickly list available packages and installation state with the Glasskube CLI:
```plaintext theme={null}
→ ~ glasskube list
PACKAGENAME NAMESPACE NAME VERSION AUTO-UPDATE REPOSITORY STATUS
---------------------------------------------------------------------------------------------
quickwit glasskube - - - - Not installed
...
kubetail glasskube - - Not installed
kube-prometheus-stack glasskube - - Not installed
...
```
Install Kubetail via the Glasskube CLI:
```bash theme={null}
glasskube install kubetail
```
Example interactive prompts you may see:
```plaintext theme={null}
# Version not specified. The latest version of kubetail will be installed.
# Would you like to enable automatic updates? (y/N)
# Summary:
# * The following packages will be installed in your cluster (minikube):
# 1. kubetail (version vX.Y.Z)
# * Automatic updates will be enabled
# Continue? (Y/n)
```
Open the Kubetail UI from Glasskube:
```bash theme={null}
glasskube open kubetail
```
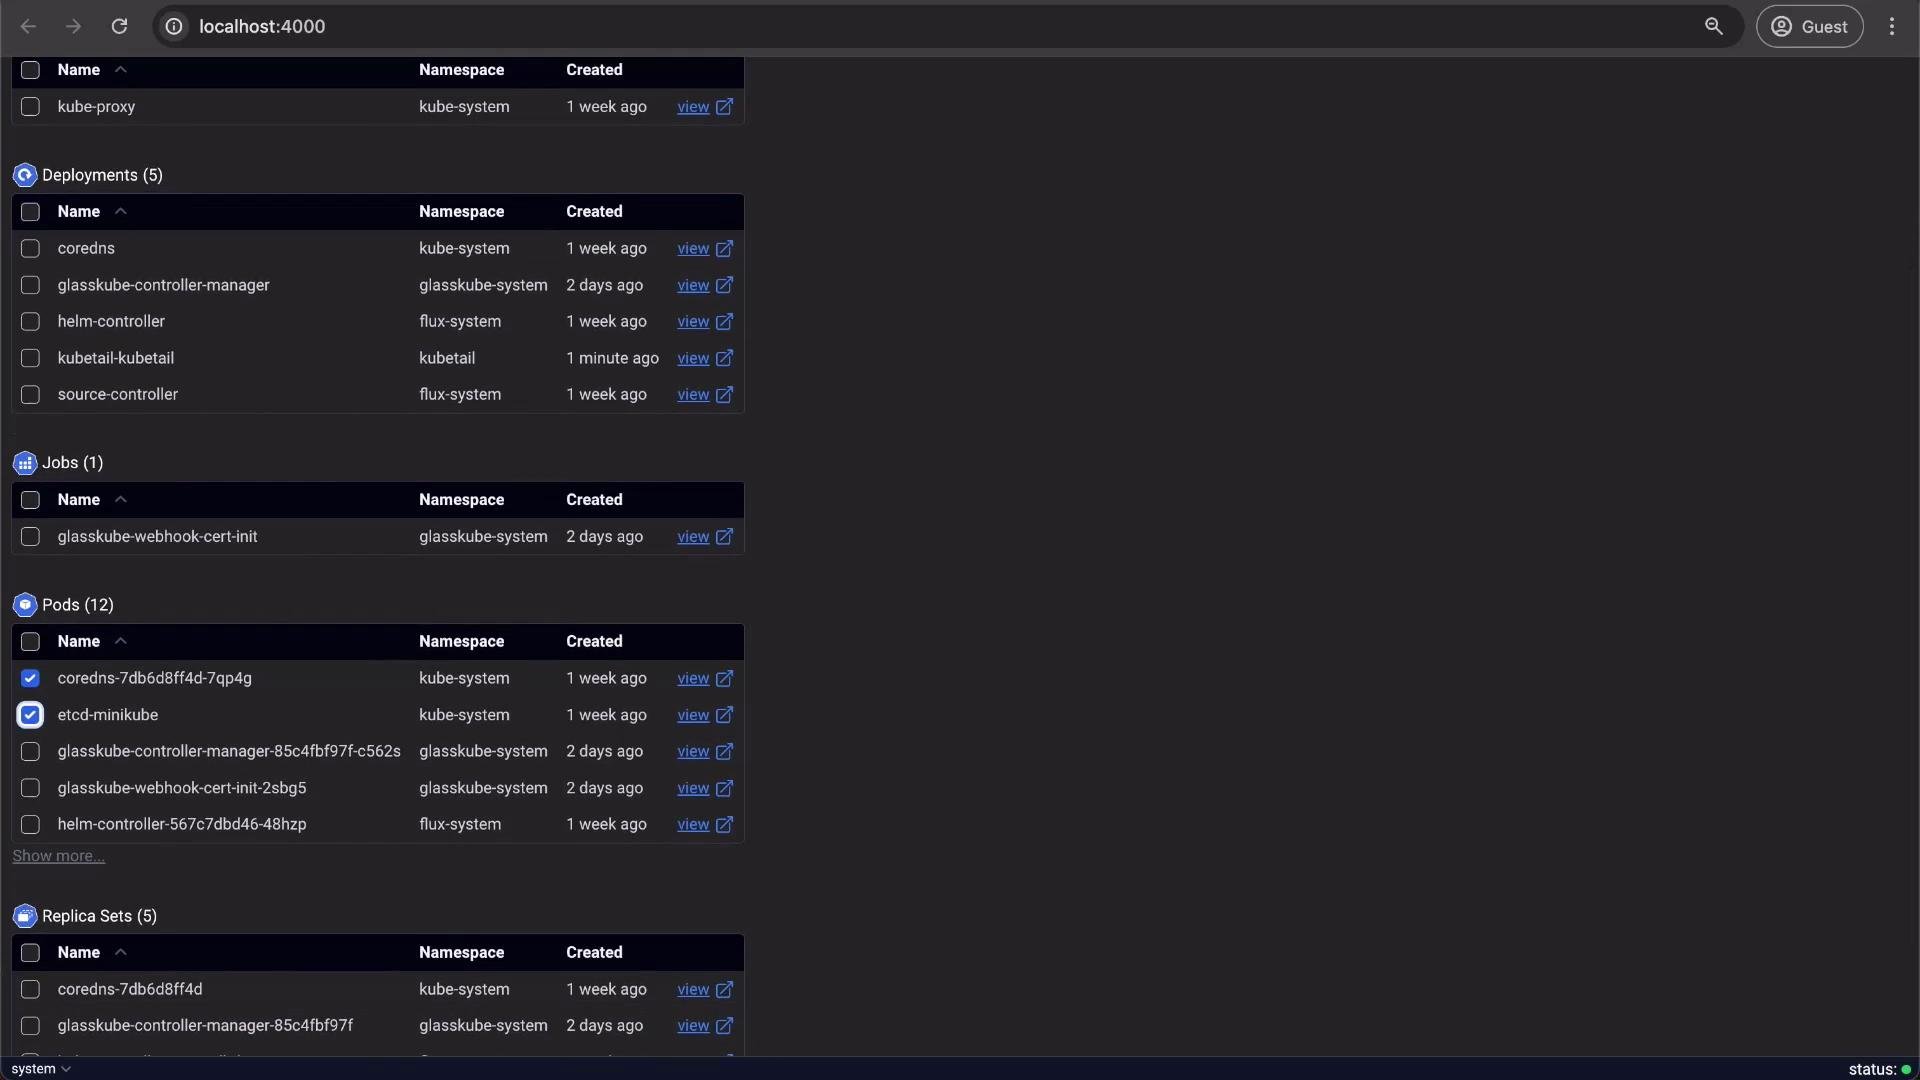
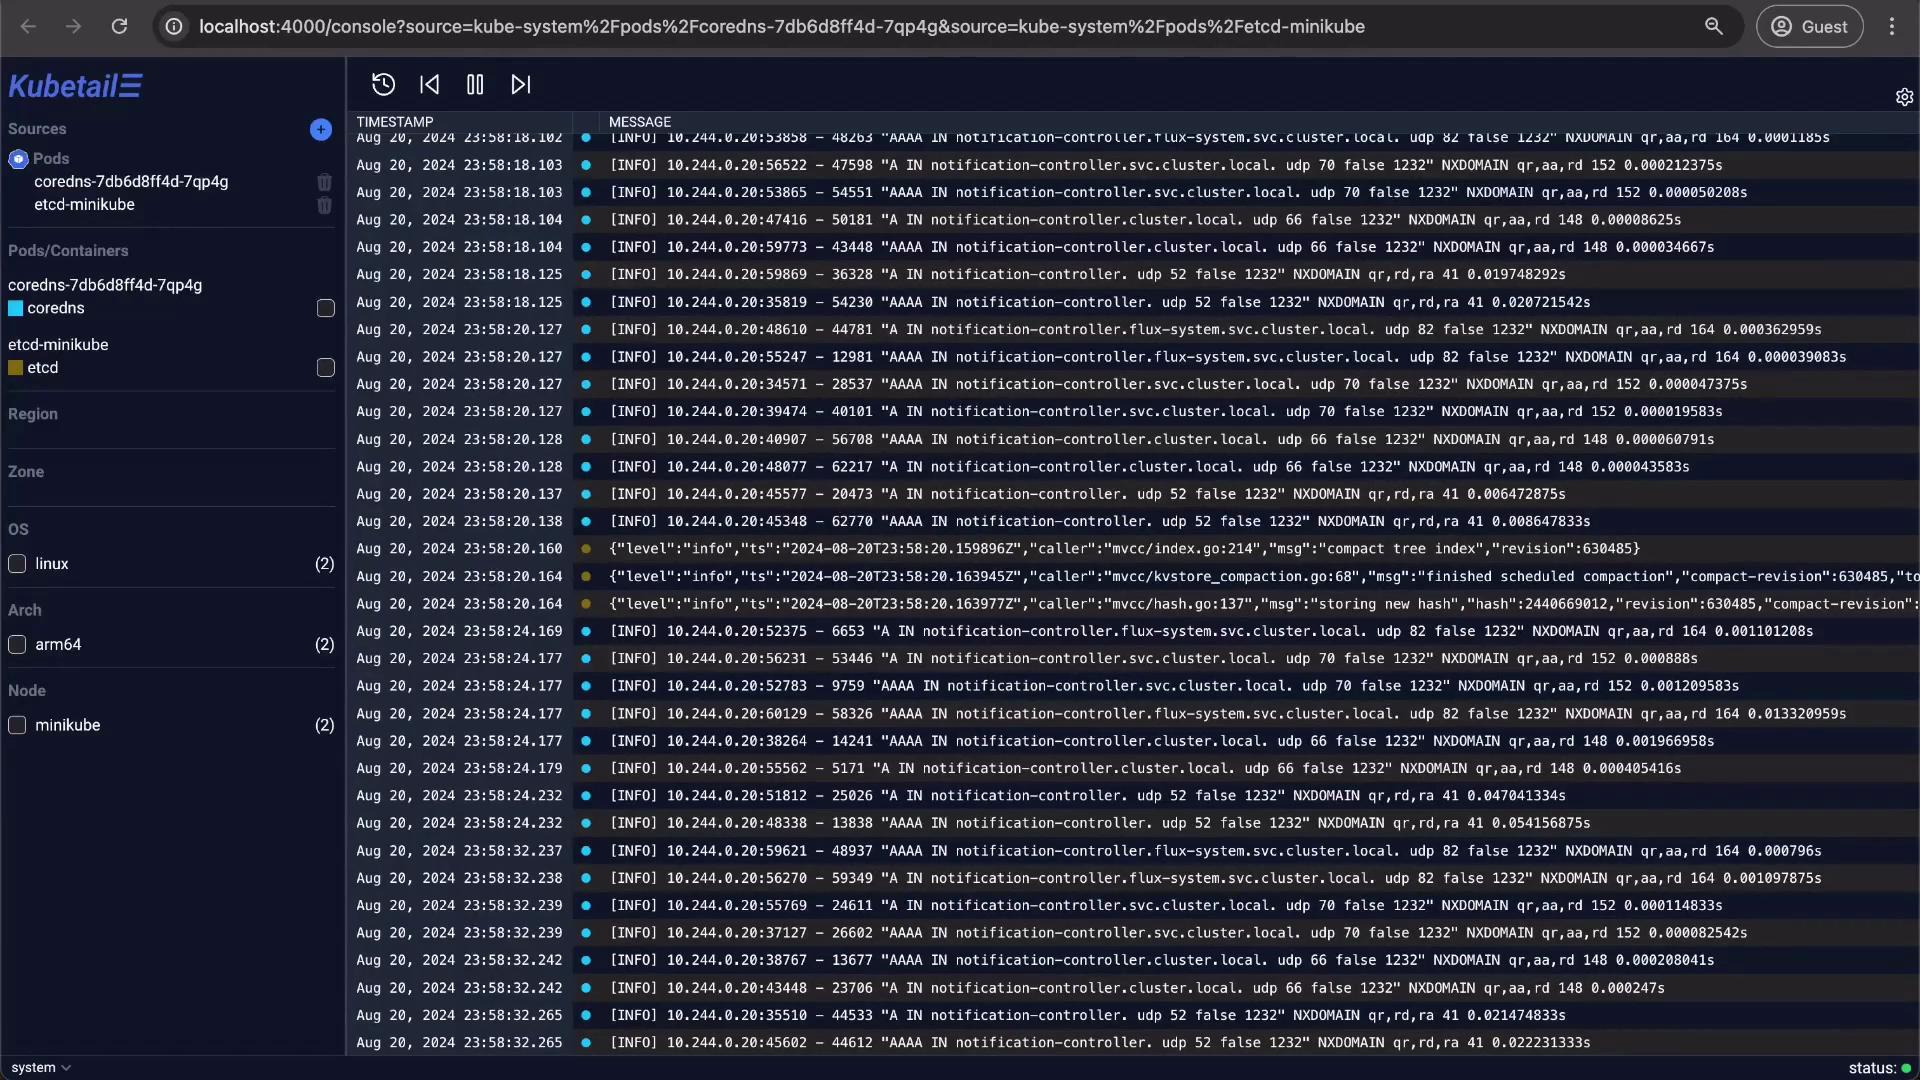
Once opened, Kubetail exposes Kubernetes objects (Deployments, DaemonSets, CronJobs, Pods, etc.) and allows you to stream and filter logs across containers and nodes in real time.
Quickly list available packages and installation state with the Glasskube CLI:
```plaintext theme={null}
→ ~ glasskube list
PACKAGENAME NAMESPACE NAME VERSION AUTO-UPDATE REPOSITORY STATUS
---------------------------------------------------------------------------------------------
quickwit glasskube - - - - Not installed
...
kubetail glasskube - - Not installed
kube-prometheus-stack glasskube - - Not installed
...
```
Install Kubetail via the Glasskube CLI:
```bash theme={null}
glasskube install kubetail
```
Example interactive prompts you may see:
```plaintext theme={null}
# Version not specified. The latest version of kubetail will be installed.
# Would you like to enable automatic updates? (y/N)
# Summary:
# * The following packages will be installed in your cluster (minikube):
# 1. kubetail (version vX.Y.Z)
# * Automatic updates will be enabled
# Continue? (Y/n)
```
Open the Kubetail UI from Glasskube:
```bash theme={null}
glasskube open kubetail
```
Once opened, Kubetail exposes Kubernetes objects (Deployments, DaemonSets, CronJobs, Pods, etc.) and allows you to stream and filter logs across containers and nodes in real time.
 ***
## kube-prometheus-stack: metrics, dashboards, and alerting
The kube-prometheus-stack bundles Prometheus, Alertmanager, Grafana, and several exporters into a pre-configured monitoring solution. It provides:
* Prometheus for metric collection and alerting rules
* Alertmanager for routing/notification
* Grafana with pre-built dashboards
* Exporters such as node-exporter to collect node metrics
This stack is especially useful for Kubernetes cluster-level monitoring and quick setup of observability capabilities.
Package characteristics (kube-prometheus-stack)
| Field | Value |
| ------------ | ------------------------------------------------------------------------------------------- |
| Scope | cluster-scoped |
| Values | multiple (customize Prometheus, Alertmanager, Grafana, exporters, storage, retention, etc.) |
| Entrypoint | yes (Grafana) |
| Dependencies | none |
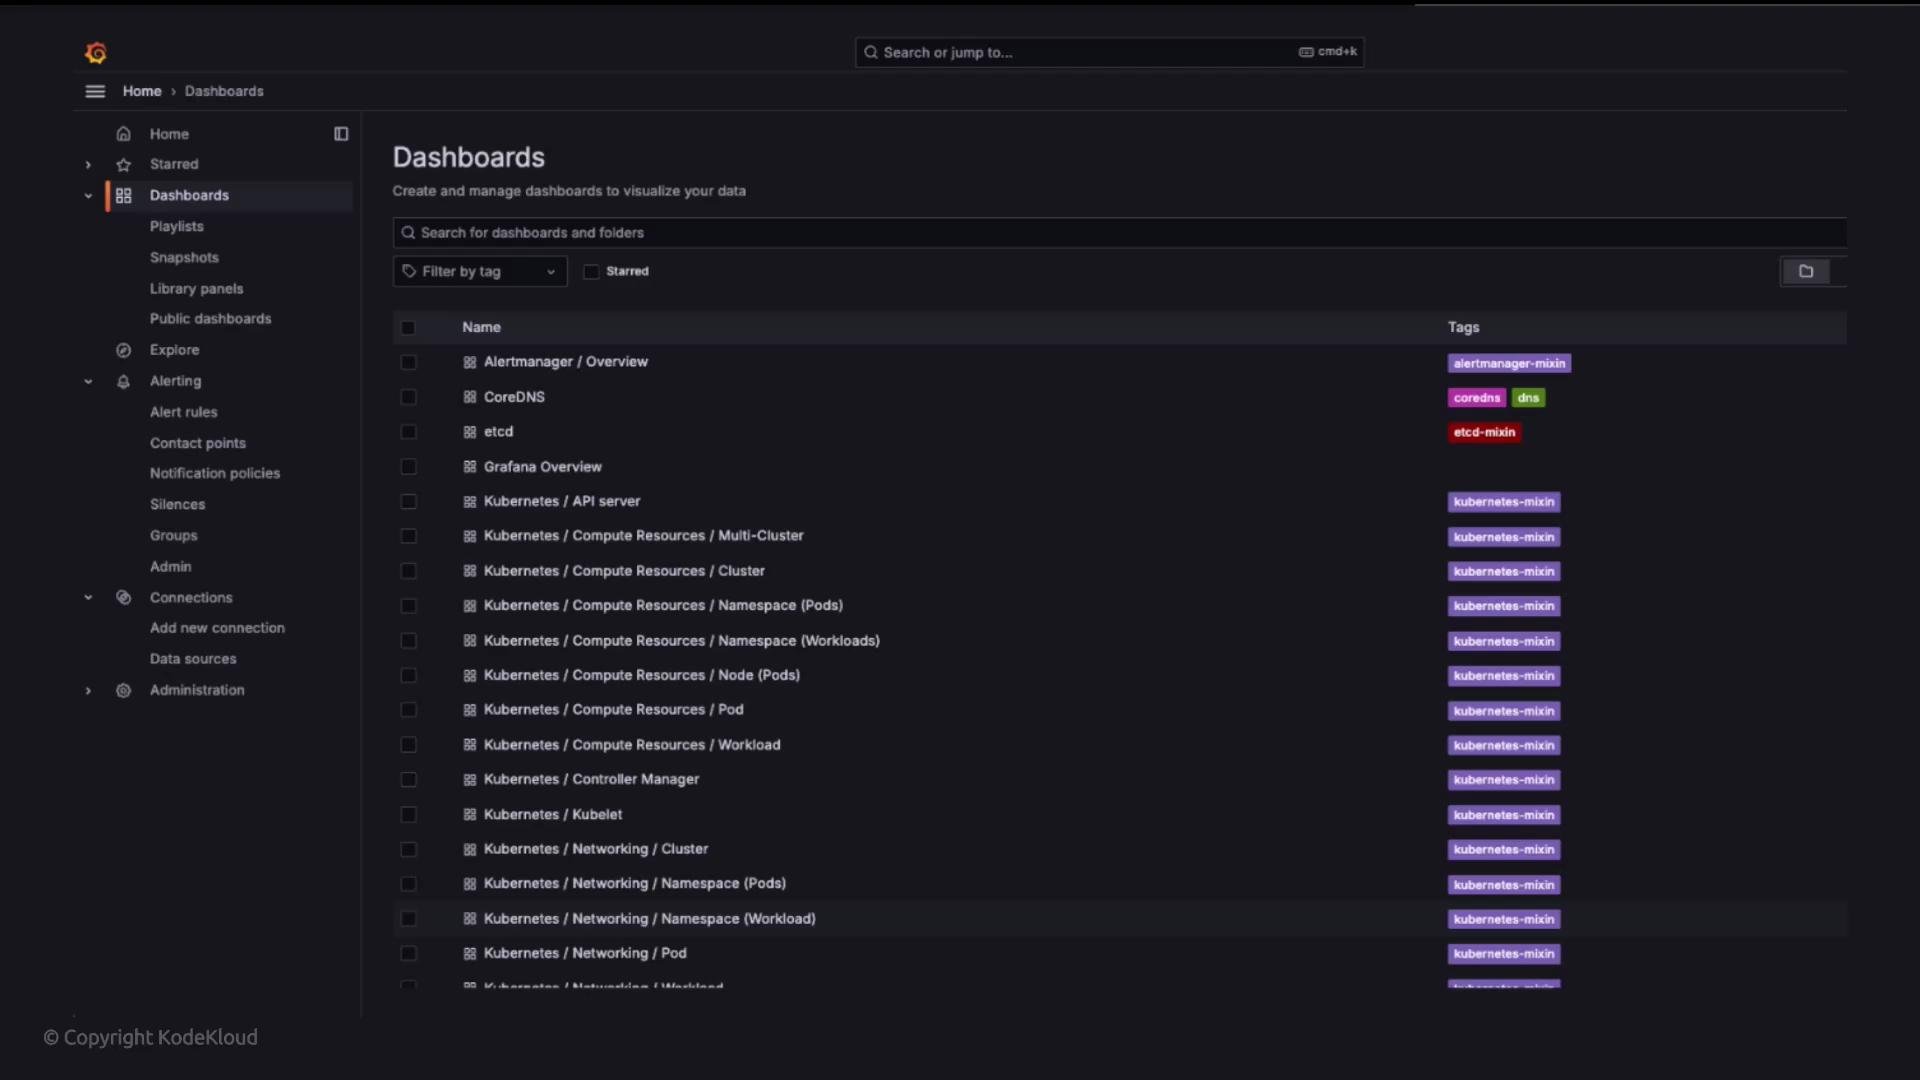
You’ll get many dashboards out of the box:
***
## kube-prometheus-stack: metrics, dashboards, and alerting
The kube-prometheus-stack bundles Prometheus, Alertmanager, Grafana, and several exporters into a pre-configured monitoring solution. It provides:
* Prometheus for metric collection and alerting rules
* Alertmanager for routing/notification
* Grafana with pre-built dashboards
* Exporters such as node-exporter to collect node metrics
This stack is especially useful for Kubernetes cluster-level monitoring and quick setup of observability capabilities.
Package characteristics (kube-prometheus-stack)
| Field | Value |
| ------------ | ------------------------------------------------------------------------------------------- |
| Scope | cluster-scoped |
| Values | multiple (customize Prometheus, Alertmanager, Grafana, exporters, storage, retention, etc.) |
| Entrypoint | yes (Grafana) |
| Dependencies | none |
You’ll get many dashboards out of the box:
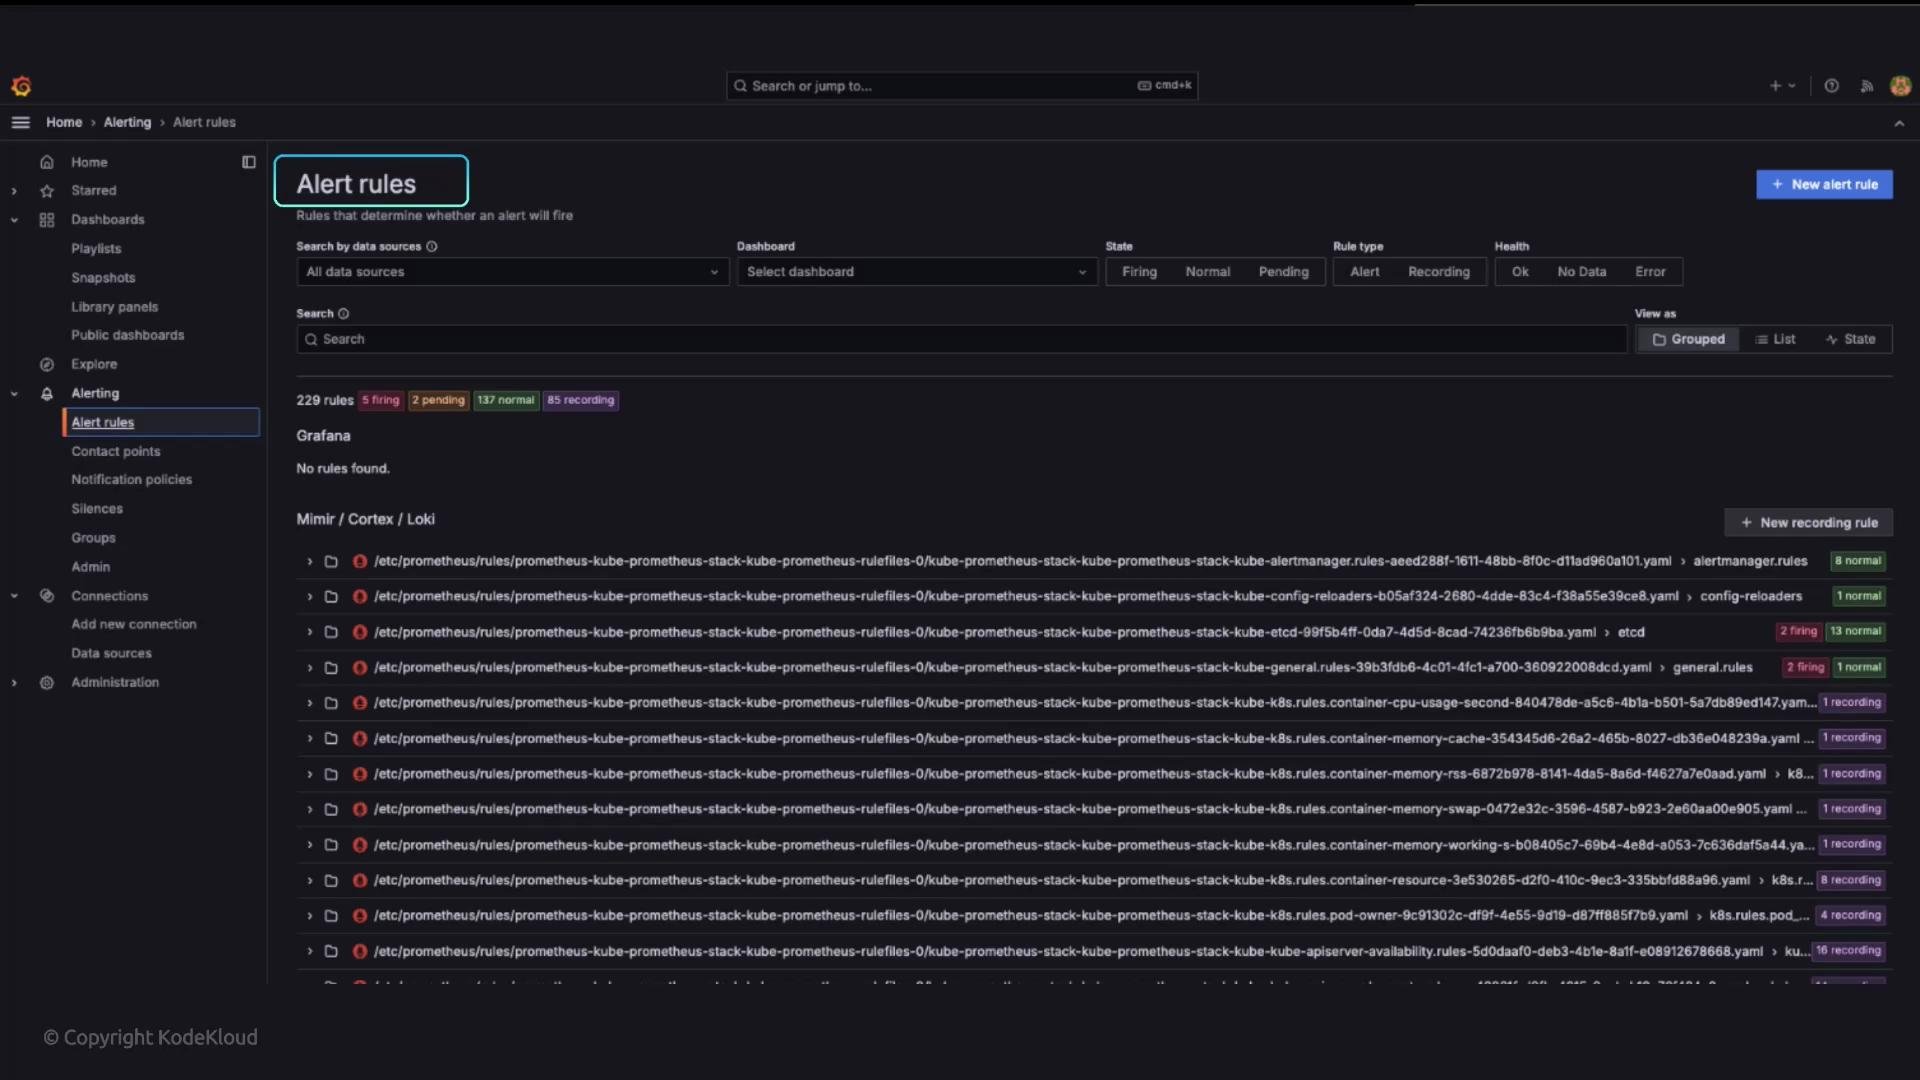
 Alerting rules are pre-configured and can be managed from the Rules UI:
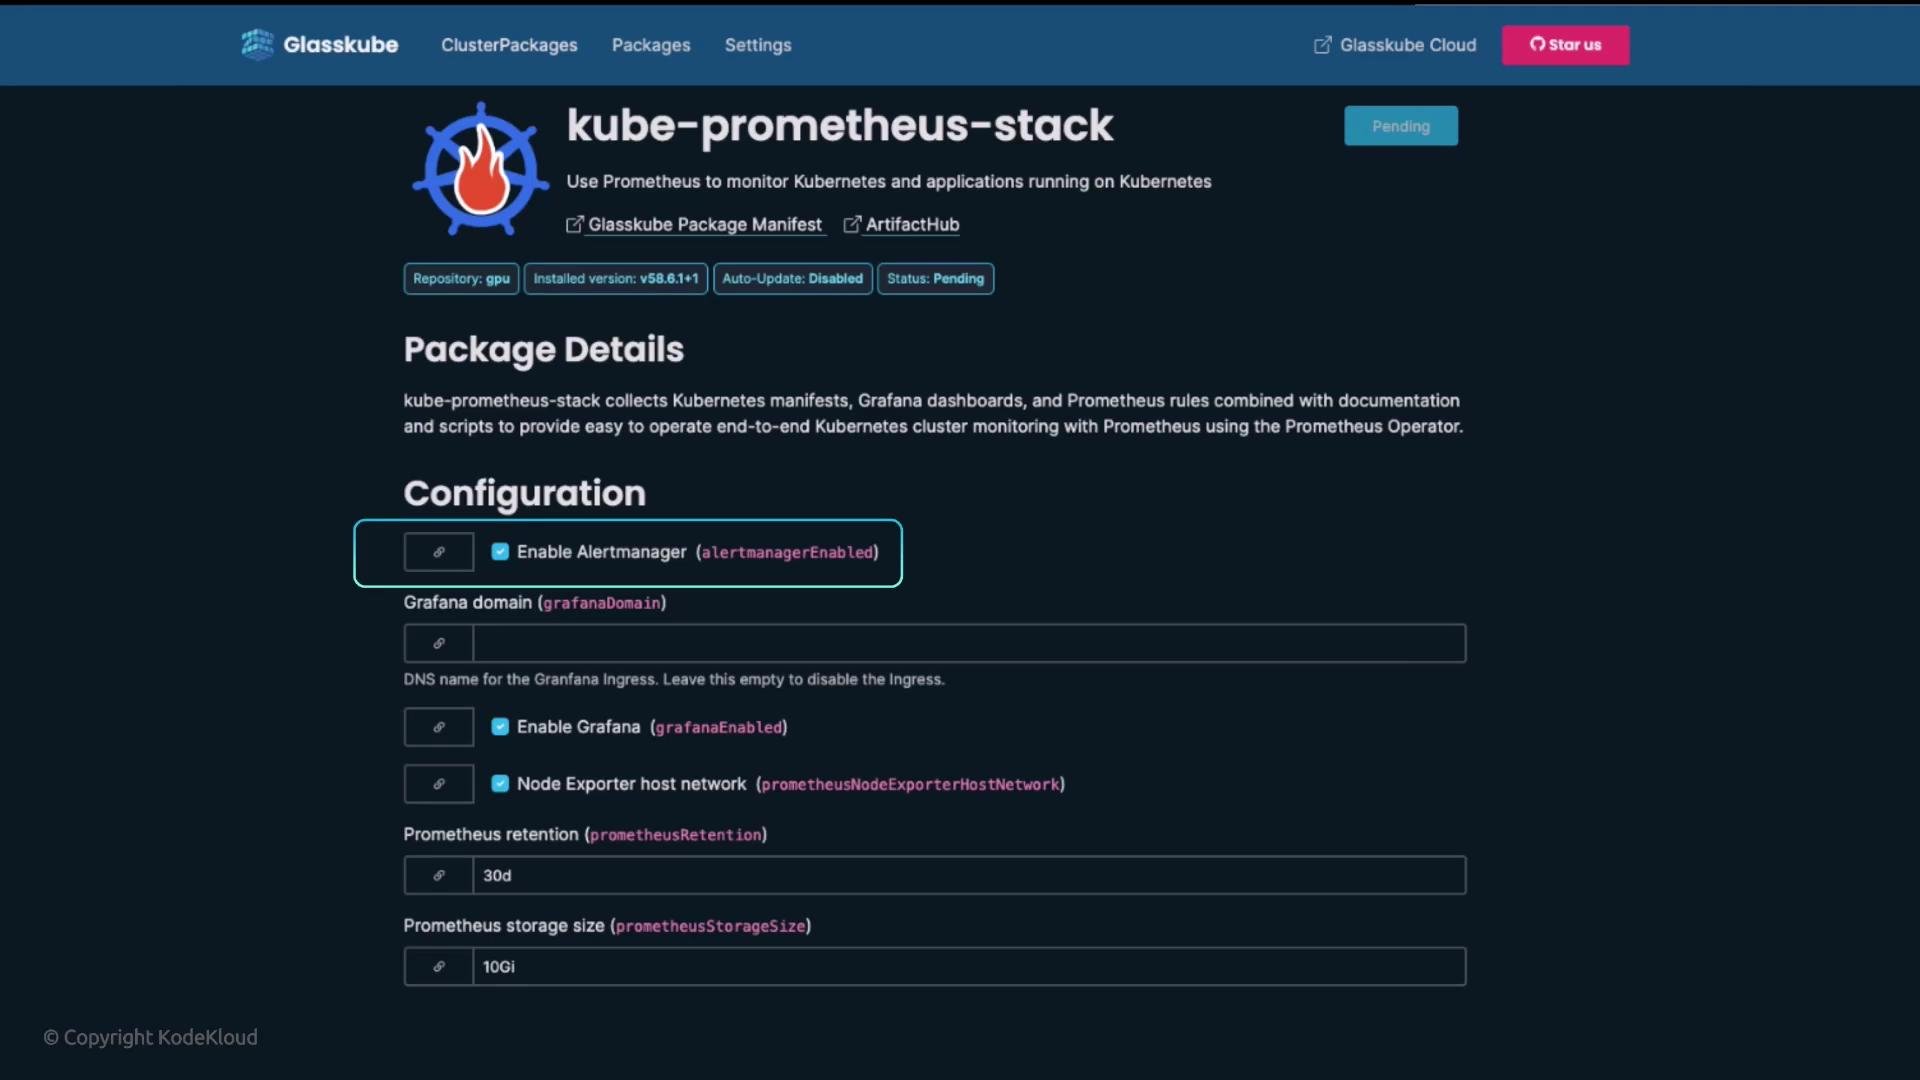
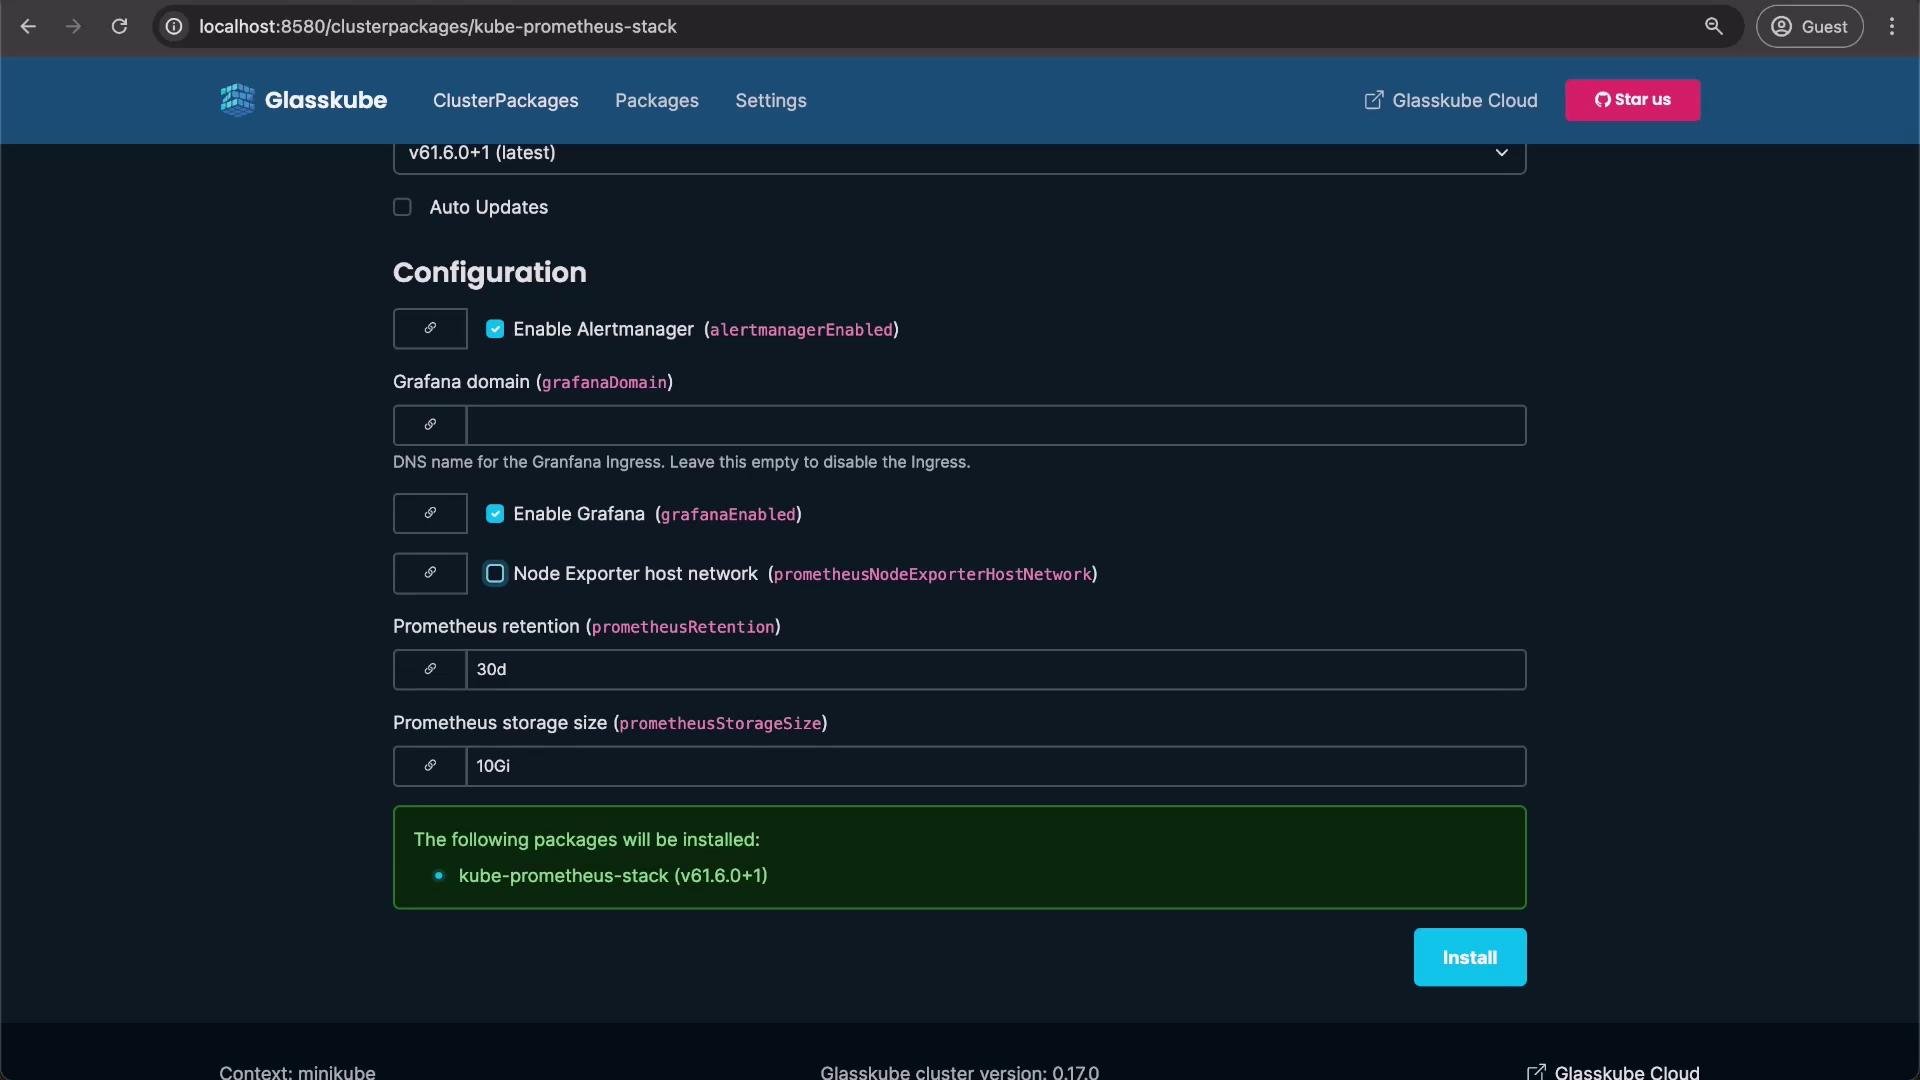
 When installing kube-prometheus-stack from Glasskube you can toggle components and fine-tune values. Common toggles include:
* Enable/disable Alertmanager
* Enable/disable Grafana
* Enable node-exporter host network for richer node metrics
* Configure Prometheus retention and storage size
Glasskube exposes these options in the package configuration UI:
When installing kube-prometheus-stack from Glasskube you can toggle components and fine-tune values. Common toggles include:
* Enable/disable Alertmanager
* Enable/disable Grafana
* Enable node-exporter host network for richer node metrics
* Configure Prometheus retention and storage size
Glasskube exposes these options in the package configuration UI:
 After installation Glasskube will create the `kube-prometheus-stack` namespace and the stack’s pods will begin to initialize. Verify namespace and pod status:
```bash theme={null}
kubectl get namespace
```
Check pods in the monitoring namespace while resources start up:
```bash theme={null}
kubectl get pods -n kube-prometheus-stack
# Example output while pods initialize:
# NAME READY STATUS RESTARTS AGE
# alertmanager-kube-prometheus-stack-kube-alertmanager-0 0/2 Init:0/1 0 13s
# kube-prometheus-stack-kube-operator- 1/1 Running 0 20s
# kube-prometheus-stack-grafana- 0/3 Init:0/1 0 20s
# prometheus-kube-prometheus-stack-kube-prometheus-0 0/2 Init:0/1 0 12s
```
Give pods a minute or two to reach Running. A fully started example:
```bash theme={null}
kubectl get pods -n kube-prometheus-stack
# NAME READY STATUS RESTARTS AGE
# alertmanager-kube-prometheus-stack-kube-alertmanager-0 2/2 Running 0 89s
# kube-prometheus-stack-kube-operator- 1/1 Running 0 96s
# kube-prometheus-stack-grafana- 2/3 Running 0 96s
# prometheus-kube-prometheus-stack-n 1/1 Running 0 96s
# kube-prometheus-stack-kube-prometheus-0 2/2 Running 0 88s
```
Glasskube will display the Grafana entrypoint once the service or ingress is ready. When you open Grafana you will be prompted for credentials. The kube-prometheus-stack Helm chart typically stores the Grafana admin username and password in a Kubernetes secret inside the `kube-prometheus-stack` namespace.
To find and decode the Grafana admin credentials:
```bash theme={null}
# list secrets in the namespace and find the Grafana secret name
kubectl get secrets -n kube-prometheus-stack
# once you identify the Grafana secret name (eg. kube-prometheus-stack-grafana or -grafana),
# decode the admin username and password (key names may vary by chart/version):
kubectl get secret -n kube-prometheus-stack -o jsonpath="{.data.admin-user}" | base64 --decode; echo
kubectl get secret -n kube-prometheus-stack -o jsonpath="{.data.admin-password}" | base64 --decode; echo
```
Default Grafana credentials for many kube-prometheus-stack installs are:
* Username: `admin`
* Password: `prom-operator`
Always confirm by decoding the actual Kubernetes secret in your cluster (see command above) — some releases or charts may override defaults.
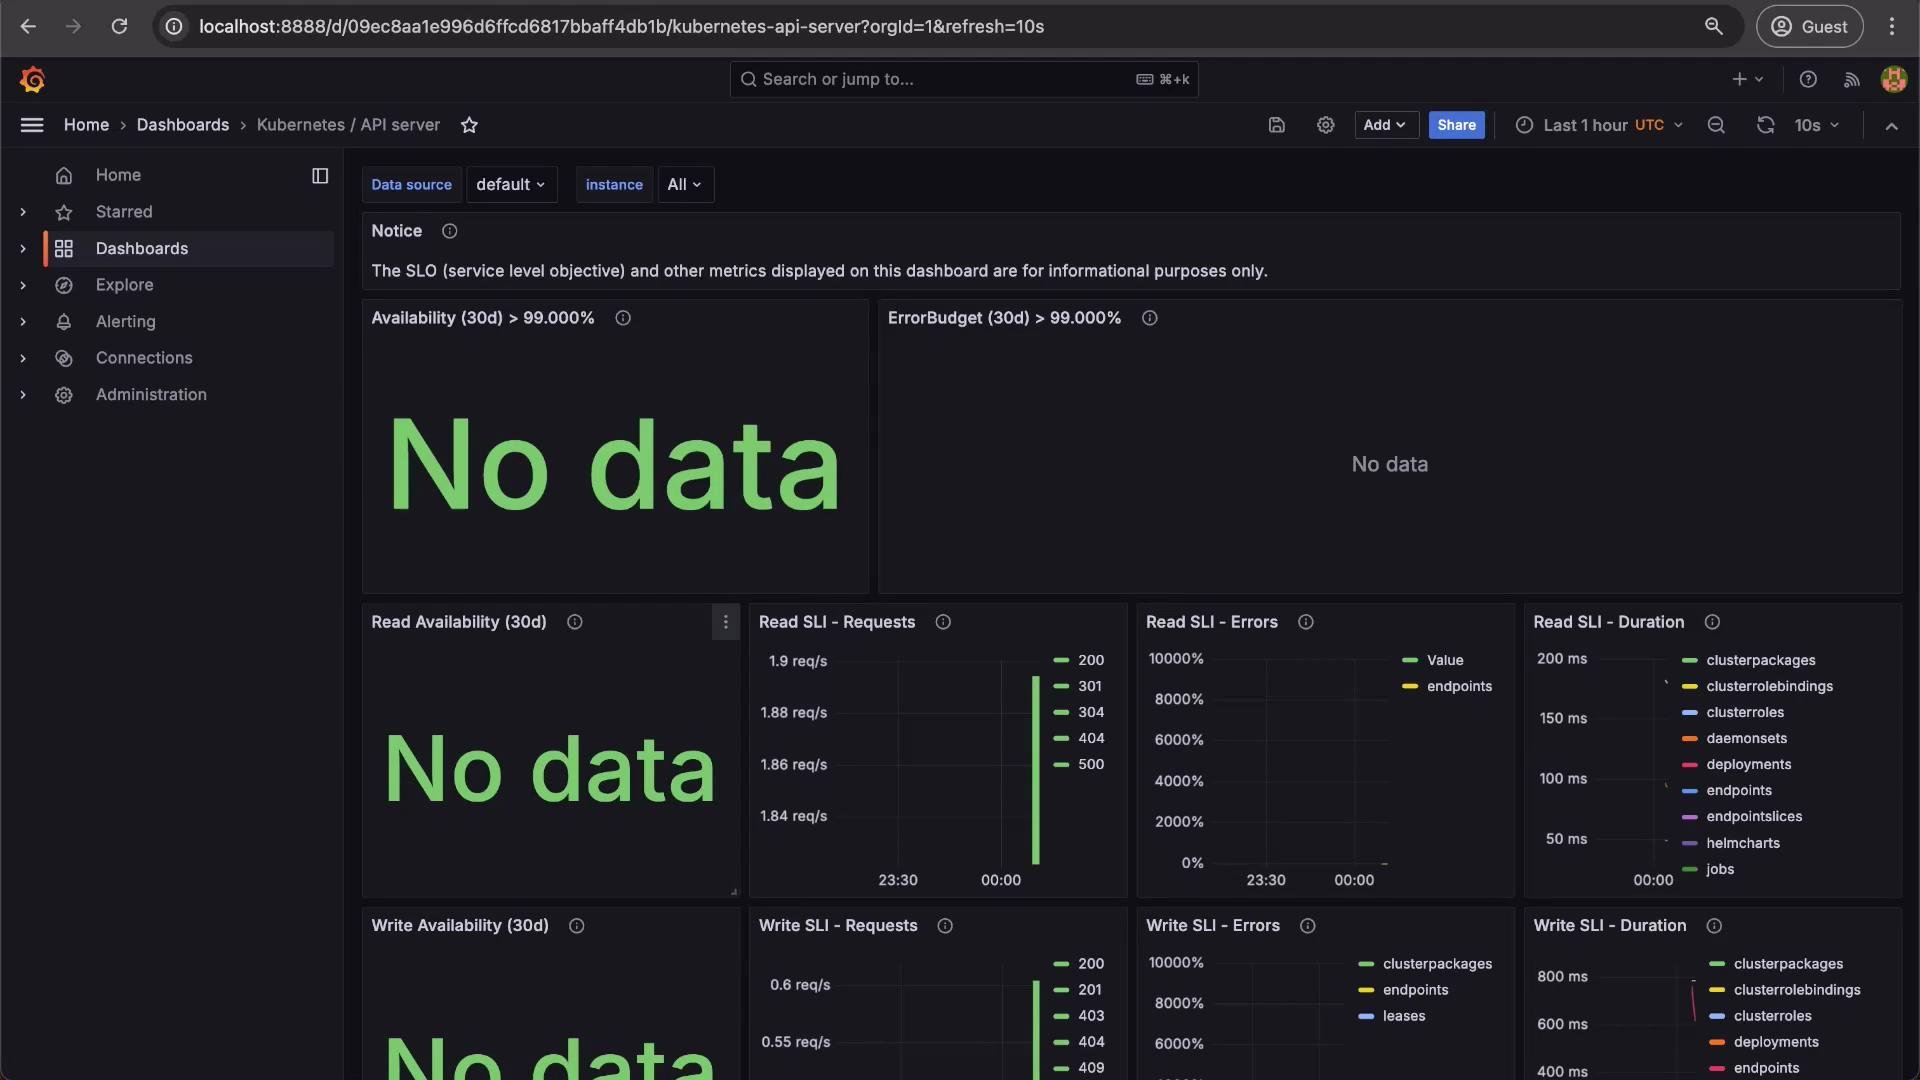
After logging into Grafana, dashboards will populate as Prometheus begins scraping metrics. It may take a few minutes for metrics to appear and for panels to show data.
After installation Glasskube will create the `kube-prometheus-stack` namespace and the stack’s pods will begin to initialize. Verify namespace and pod status:
```bash theme={null}
kubectl get namespace
```
Check pods in the monitoring namespace while resources start up:
```bash theme={null}
kubectl get pods -n kube-prometheus-stack
# Example output while pods initialize:
# NAME READY STATUS RESTARTS AGE
# alertmanager-kube-prometheus-stack-kube-alertmanager-0 0/2 Init:0/1 0 13s
# kube-prometheus-stack-kube-operator- 1/1 Running 0 20s
# kube-prometheus-stack-grafana- 0/3 Init:0/1 0 20s
# prometheus-kube-prometheus-stack-kube-prometheus-0 0/2 Init:0/1 0 12s
```
Give pods a minute or two to reach Running. A fully started example:
```bash theme={null}
kubectl get pods -n kube-prometheus-stack
# NAME READY STATUS RESTARTS AGE
# alertmanager-kube-prometheus-stack-kube-alertmanager-0 2/2 Running 0 89s
# kube-prometheus-stack-kube-operator- 1/1 Running 0 96s
# kube-prometheus-stack-grafana- 2/3 Running 0 96s
# prometheus-kube-prometheus-stack-n 1/1 Running 0 96s
# kube-prometheus-stack-kube-prometheus-0 2/2 Running 0 88s
```
Glasskube will display the Grafana entrypoint once the service or ingress is ready. When you open Grafana you will be prompted for credentials. The kube-prometheus-stack Helm chart typically stores the Grafana admin username and password in a Kubernetes secret inside the `kube-prometheus-stack` namespace.
To find and decode the Grafana admin credentials:
```bash theme={null}
# list secrets in the namespace and find the Grafana secret name
kubectl get secrets -n kube-prometheus-stack
# once you identify the Grafana secret name (eg. kube-prometheus-stack-grafana or -grafana),
# decode the admin username and password (key names may vary by chart/version):
kubectl get secret -n kube-prometheus-stack -o jsonpath="{.data.admin-user}" | base64 --decode; echo
kubectl get secret -n kube-prometheus-stack -o jsonpath="{.data.admin-password}" | base64 --decode; echo
```
Default Grafana credentials for many kube-prometheus-stack installs are:
* Username: `admin`
* Password: `prom-operator`
Always confirm by decoding the actual Kubernetes secret in your cluster (see command above) — some releases or charts may override defaults.
After logging into Grafana, dashboards will populate as Prometheus begins scraping metrics. It may take a few minutes for metrics to appear and for panels to show data.
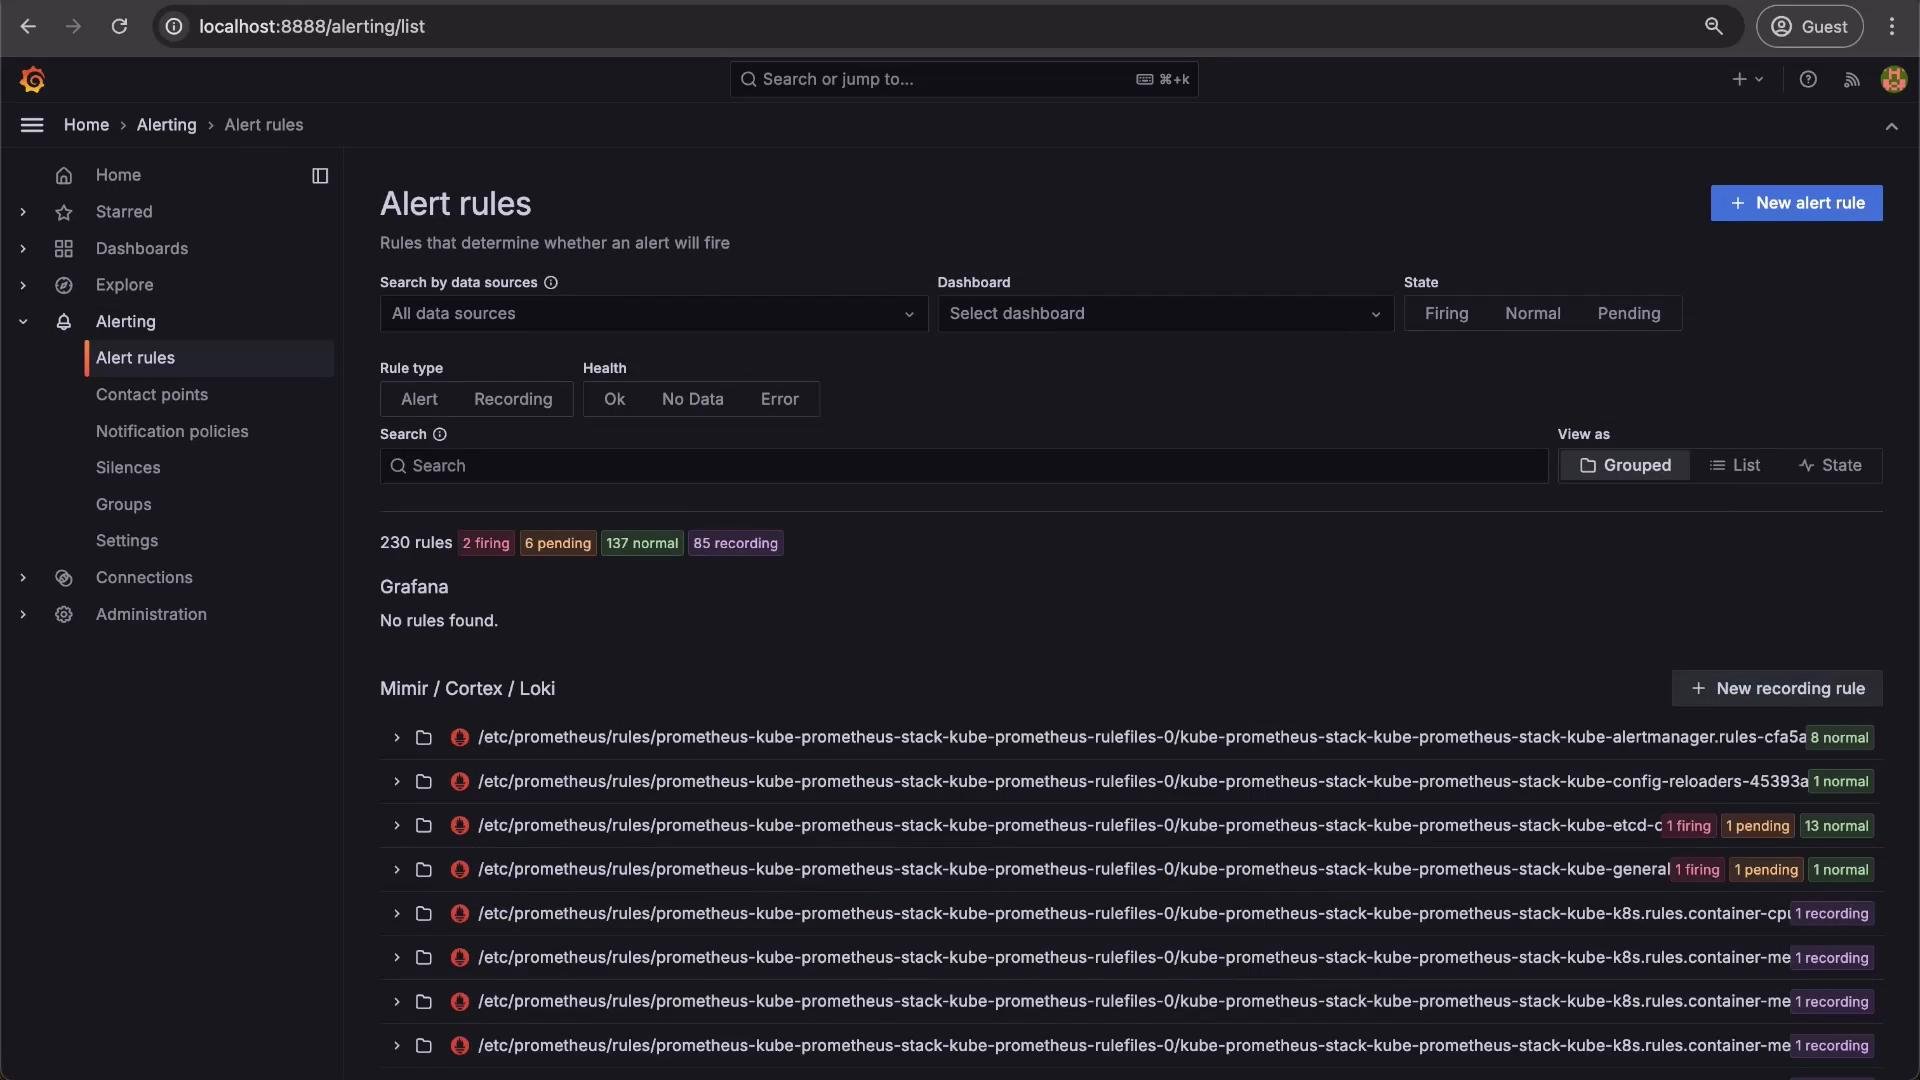
 The Rules UI shows alerting rules and their current state (firing, pending, or normal):
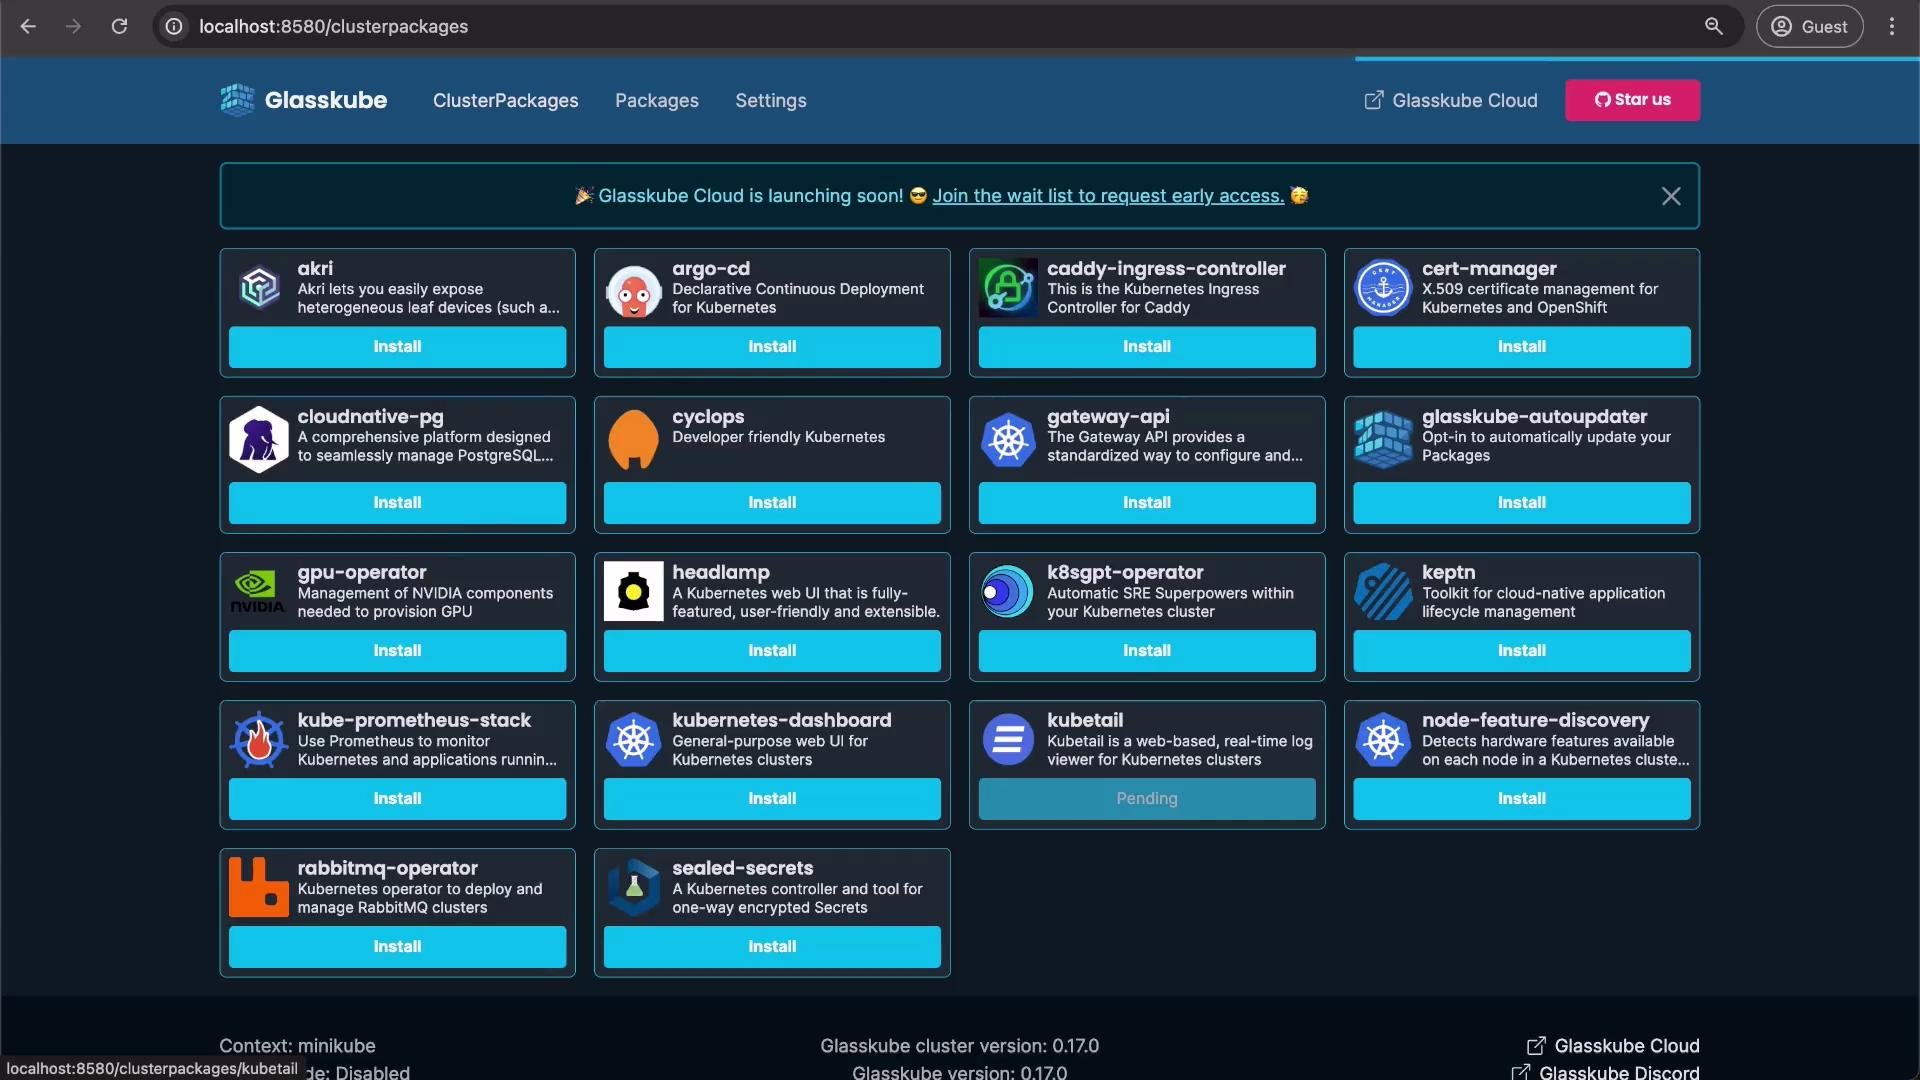
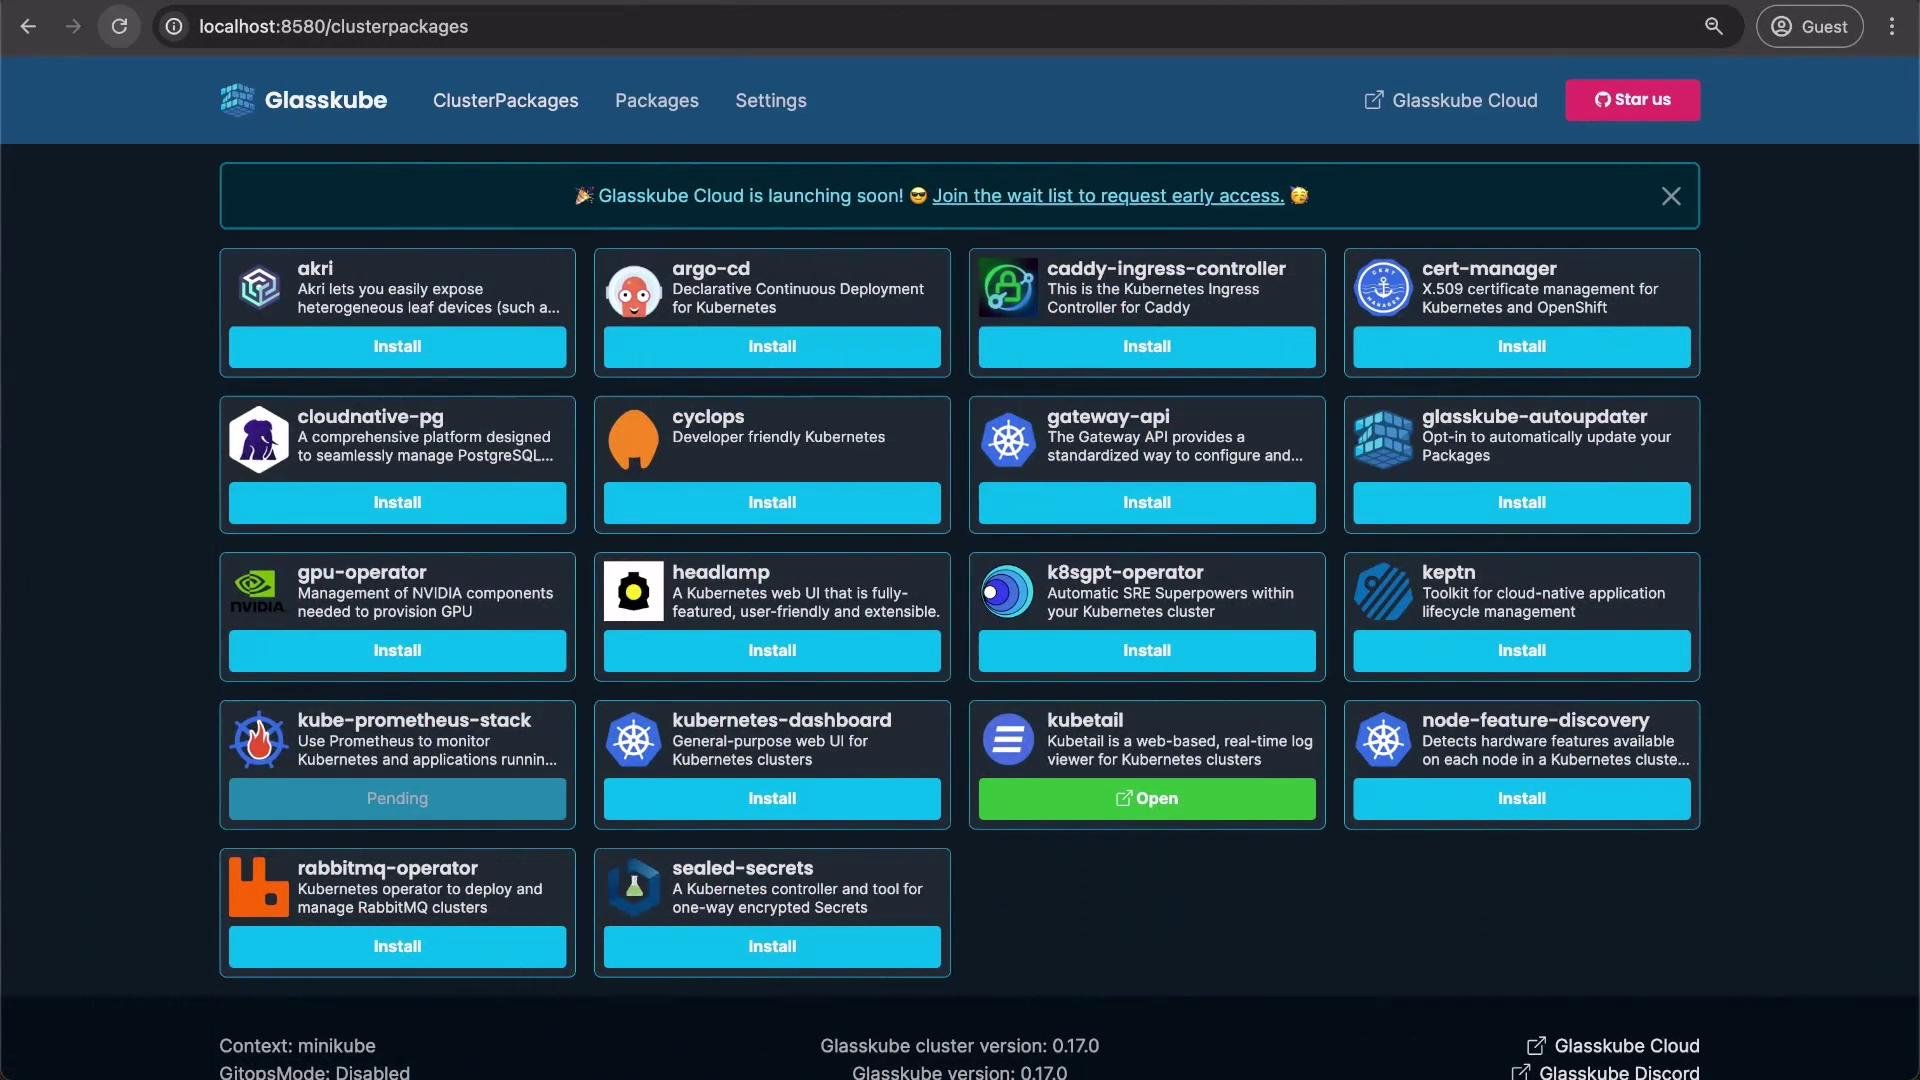
 Glasskube provides a central packages view for installing and managing both Kubetail and kube-prometheus-stack, plus many other packages:
 ***
## Summary
With Kubetail and kube-prometheus-stack deployed via Glasskube you gain both:
* Real-time log streaming and filtering across pods and containers (Kubetail)
* A full metrics collection, visualization, and alerting platform (Prometheus + Alertmanager + Grafana)
These tools together provide comprehensive observability for Kubernetes clusters, enabling faster troubleshooting and proactive alerting.
Further reading and references:
* [Kubernetes Documentation](https://kubernetes.io/docs/)
* [Prometheus Operator / kube-prometheus](https://github.com/prometheus-operator/kube-prometheus)
* [Grafana Docs](https://grafana.com/docs/)
* [kubectl reference](https://kubernetes.io/docs/reference/kubectl/)
This concludes the monitoring section.
***
## Summary
With Kubetail and kube-prometheus-stack deployed via Glasskube you gain both:
* Real-time log streaming and filtering across pods and containers (Kubetail)
* A full metrics collection, visualization, and alerting platform (Prometheus + Alertmanager + Grafana)
These tools together provide comprehensive observability for Kubernetes clusters, enabling faster troubleshooting and proactive alerting.
Further reading and references:
* [Kubernetes Documentation](https://kubernetes.io/docs/)
* [Prometheus Operator / kube-prometheus](https://github.com/prometheus-operator/kube-prometheus)
* [Grafana Docs](https://grafana.com/docs/)
* [kubectl reference](https://kubernetes.io/docs/reference/kubectl/)
This concludes the monitoring section.