> ## Documentation Index
> Fetch the complete documentation index at: https://notes.kodekloud.com/llms.txt
> Use this file to discover all available pages before exploring further.
# Custom Metrics Mechanisms
> Using application-specific custom metrics with Kubernetes Horizontal Pod Autoscaler via instrumentation, collectors, and adapters to enable autoscaling on business or performance signals.
Welcome back.
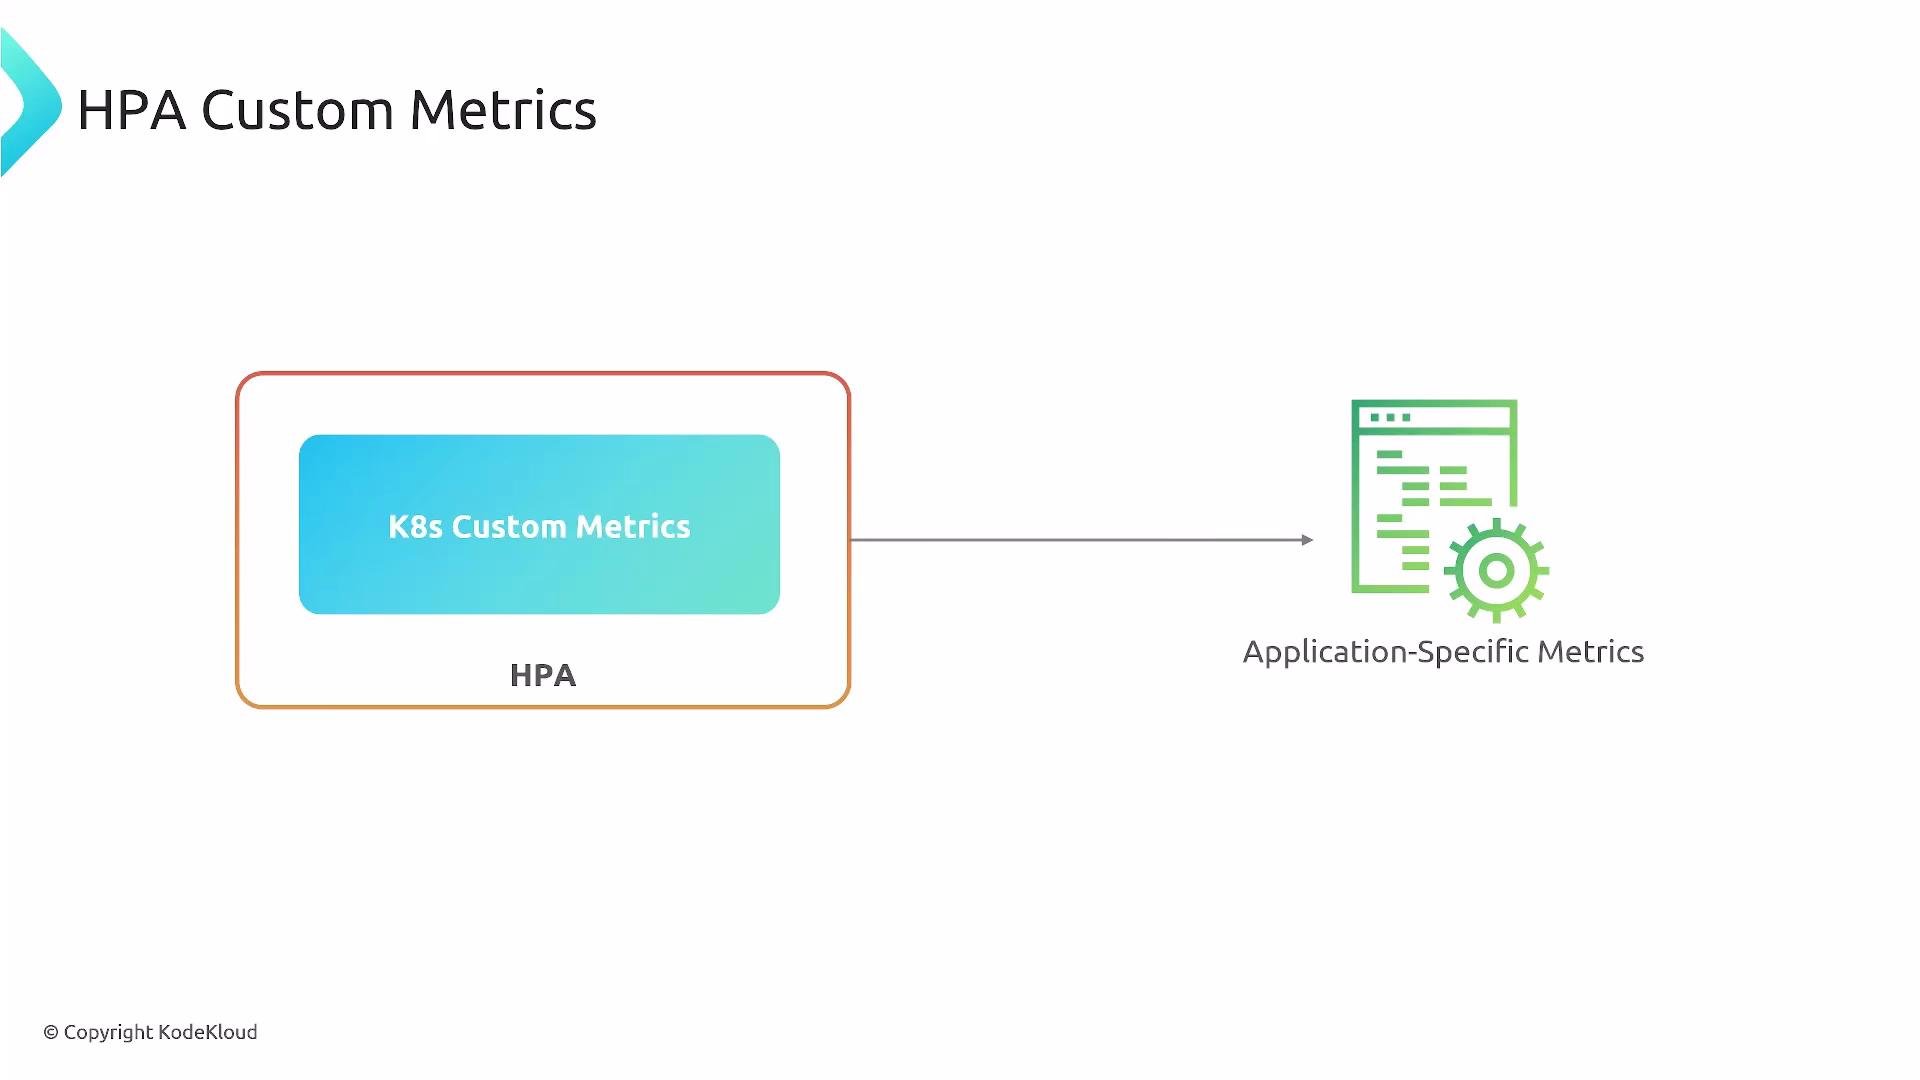
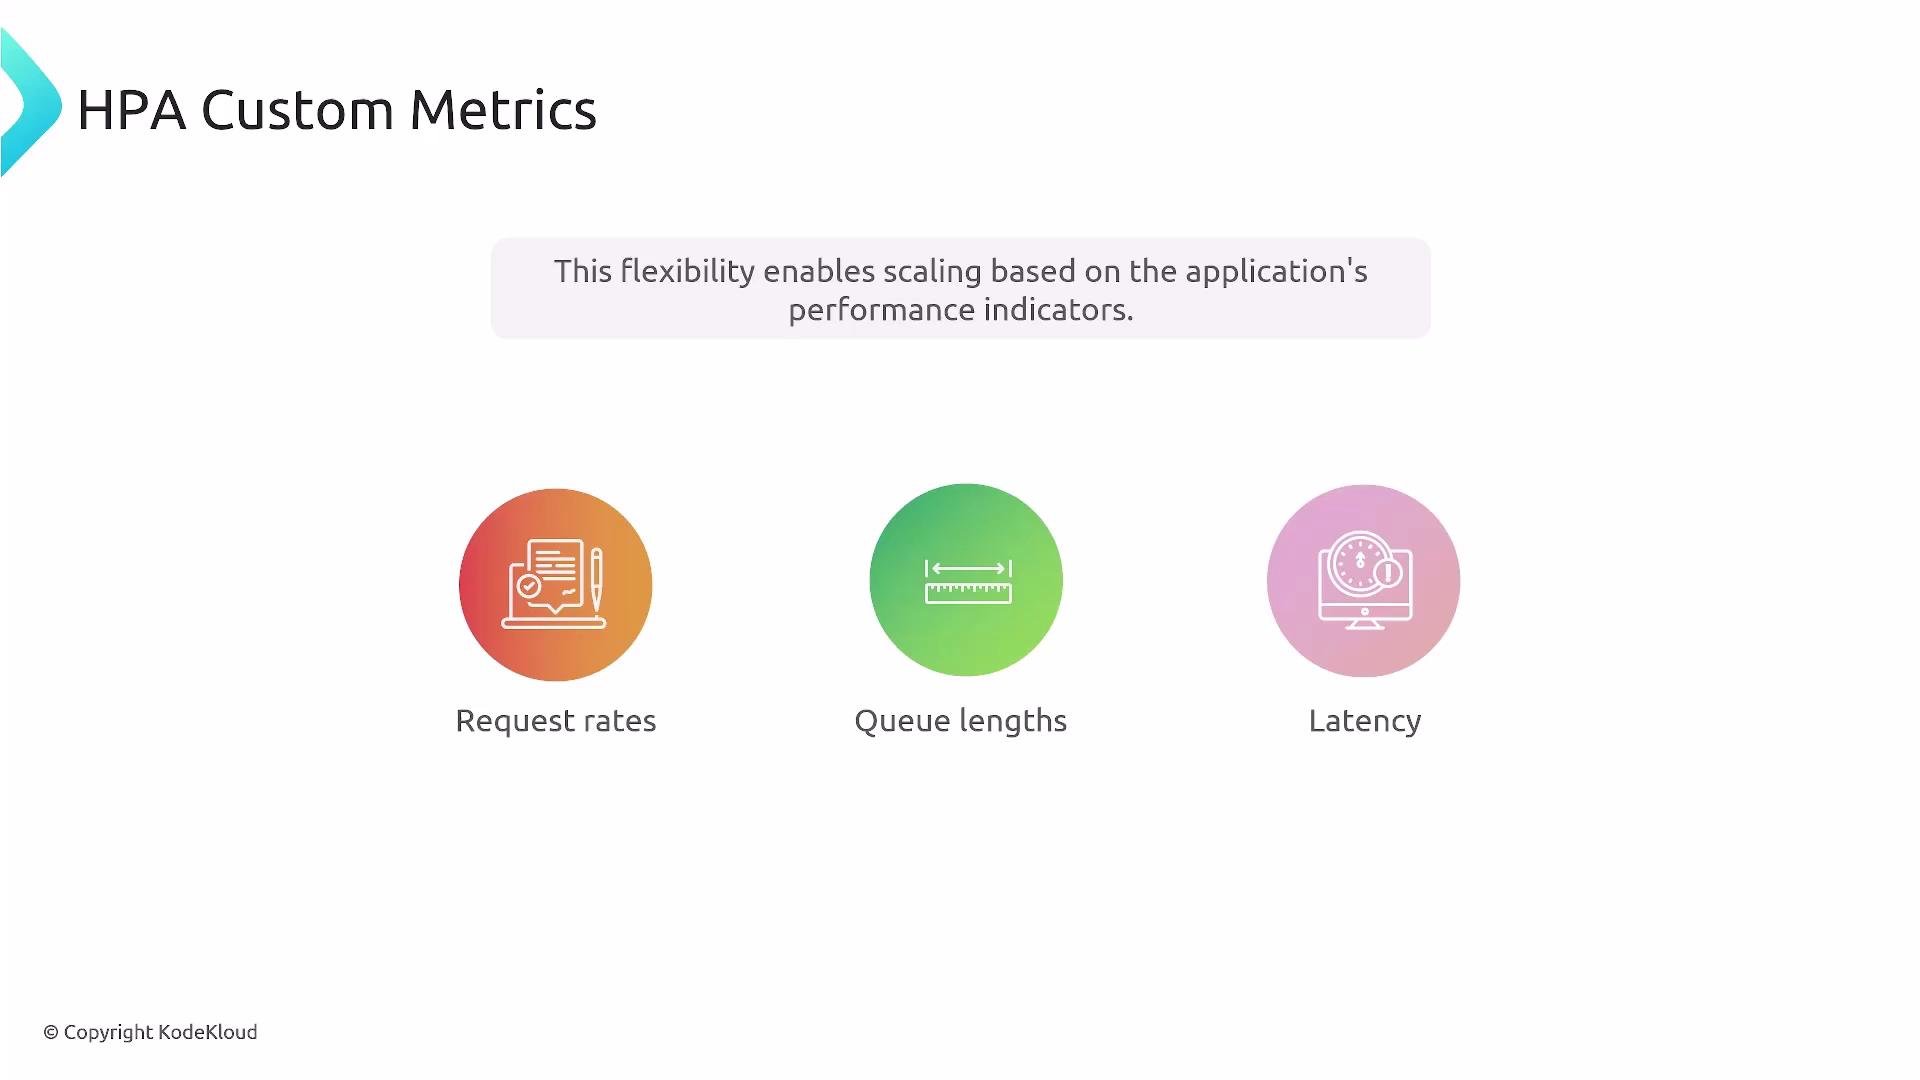
This lesson explains how to use custom metrics with the Kubernetes Horizontal Pod Autoscaler (HPA) and the components that enable application-specific metrics to drive scaling decisions. While built-in resource metrics (CPU, memory) are common, custom metrics let you autoscale based on business- or performance-oriented signals such as request rate, queue depth, or latency.
 Why use custom metrics?
* They reflect application behavior and user experience more directly than CPU/memory.
* They let you scale on real business signals (e.g., requests/sec, queue length, latency).
* They enable smarter autoscaling rules that can reduce cost while maintaining performance.
Why use custom metrics?
* They reflect application behavior and user experience more directly than CPU/memory.
* They let you scale on real business signals (e.g., requests/sec, queue length, latency).
* They enable smarter autoscaling rules that can reduce cost while maintaining performance.
 How custom metrics reach the HPA (the relay)
Custom metrics require a small pipeline inside the cluster. Think of this as a relay with four main runners:
1. Application instrumentation — your app exposes metrics (libraries like Prometheus client libraries or OpenTelemetry).
2. Metrics collection — a monitoring system scrapes or receives those metrics (for example, Prometheus server).
3. Metrics adapter — translates the monitoring system’s metrics into the Kubernetes Metrics API (exposes `custom.metrics.k8s.io` or `external.metrics.k8s.io`).
4. HPA — queries the Kubernetes API to read those metrics and scales Deployments/ReplicaSets accordingly.
Table: Components and responsibilities
| Component | Responsibility | Example |
| ----------- | ---------------------------------------------------- | ------------------------------------------------------ |
| Application | Expose application-specific metrics | Use Prometheus client libraries or OpenTelemetry |
| Collector | Scrape/receive and store metrics | Prometheus server |
| Adapter | Map collector metrics to Kubernetes metric APIs | `prometheus-adapter` (exposes `custom.metrics.k8s.io`) |
| HPA | Query metrics via Kubernetes API and scale resources | HorizontalPodAutoscaler (autoscaling/v2) |
Concretely, an adapter implements one or more of the metric APIs the HPA understands (for example, `custom.metrics.k8s.io` or `external.metrics.k8s.io`), mapping monitoring-system metrics into those APIs. A common setup is Prometheus + prometheus-adapter.
Kubernetes' built-in Metrics Server only provides resource metrics (`metrics.k8s.io`) for CPU and memory. To use application-level custom metrics you must run a monitoring system and an adapter (for example, Prometheus + `prometheus-adapter`) that exposes the metrics through the Kubernetes Custom/External Metrics APIs. See the Kubernetes core metrics pipeline docs for details: [https://kubernetes.io/docs/tasks/debug-application-cluster/core-metrics-pipeline/#metrics-server](https://kubernetes.io/docs/tasks/debug-application-cluster/core-metrics-pipeline/#metrics-server)
How custom metrics reach the HPA (the relay)
Custom metrics require a small pipeline inside the cluster. Think of this as a relay with four main runners:
1. Application instrumentation — your app exposes metrics (libraries like Prometheus client libraries or OpenTelemetry).
2. Metrics collection — a monitoring system scrapes or receives those metrics (for example, Prometheus server).
3. Metrics adapter — translates the monitoring system’s metrics into the Kubernetes Metrics API (exposes `custom.metrics.k8s.io` or `external.metrics.k8s.io`).
4. HPA — queries the Kubernetes API to read those metrics and scales Deployments/ReplicaSets accordingly.
Table: Components and responsibilities
| Component | Responsibility | Example |
| ----------- | ---------------------------------------------------- | ------------------------------------------------------ |
| Application | Expose application-specific metrics | Use Prometheus client libraries or OpenTelemetry |
| Collector | Scrape/receive and store metrics | Prometheus server |
| Adapter | Map collector metrics to Kubernetes metric APIs | `prometheus-adapter` (exposes `custom.metrics.k8s.io`) |
| HPA | Query metrics via Kubernetes API and scale resources | HorizontalPodAutoscaler (autoscaling/v2) |
Concretely, an adapter implements one or more of the metric APIs the HPA understands (for example, `custom.metrics.k8s.io` or `external.metrics.k8s.io`), mapping monitoring-system metrics into those APIs. A common setup is Prometheus + prometheus-adapter.
Kubernetes' built-in Metrics Server only provides resource metrics (`metrics.k8s.io`) for CPU and memory. To use application-level custom metrics you must run a monitoring system and an adapter (for example, Prometheus + `prometheus-adapter`) that exposes the metrics through the Kubernetes Custom/External Metrics APIs. See the Kubernetes core metrics pipeline docs for details: [https://kubernetes.io/docs/tasks/debug-application-cluster/core-metrics-pipeline/#metrics-server](https://kubernetes.io/docs/tasks/debug-application-cluster/core-metrics-pipeline/#metrics-server)
 Practical considerations when using custom metrics
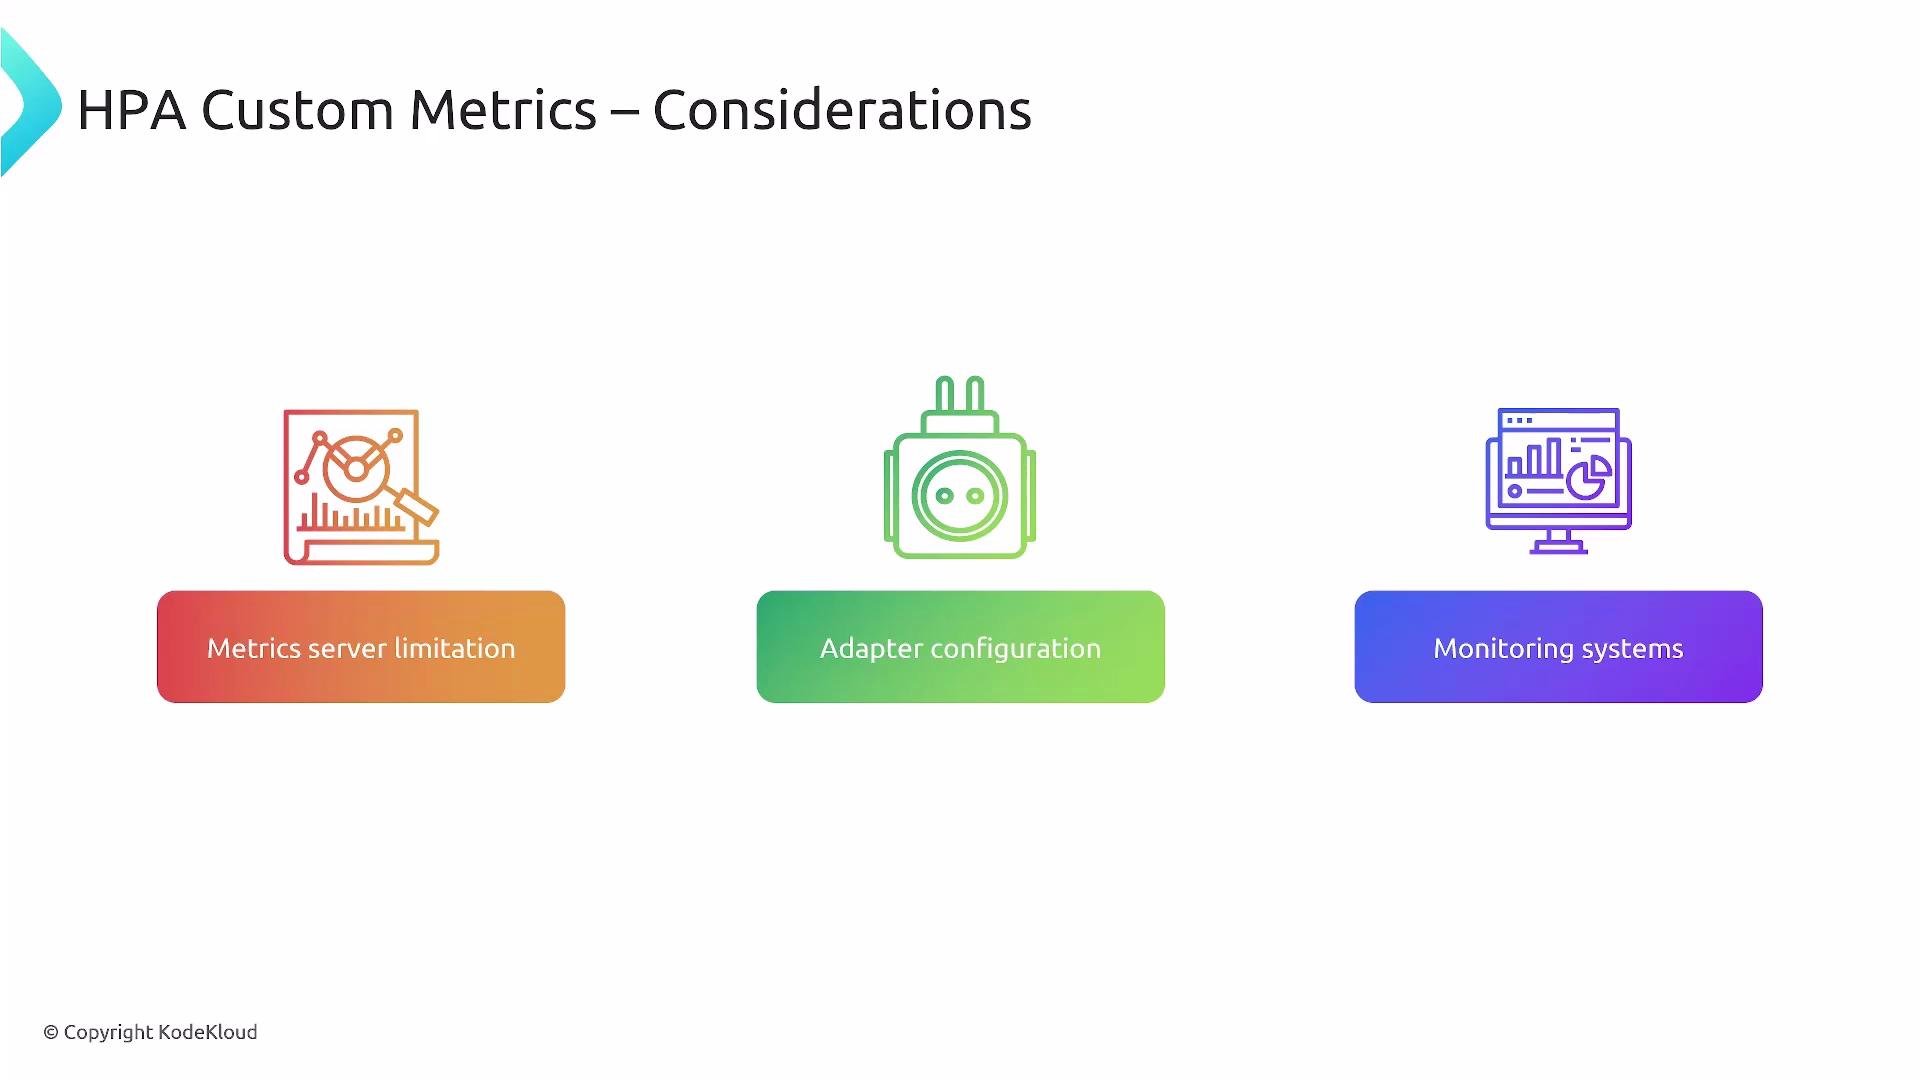
* Metrics server limitation: The default `metrics-server` serves only resource metrics. Install a monitoring stack (e.g., Prometheus) for application metrics.
* Adapter configuration: Install an adapter that implements the Custom/External Metrics APIs and map monitoring metrics to API resources. Configure metric names, namespaces, and RBAC carefully.
* Monitoring instrumenting: Make sure application agents, exporters, or client libraries expose metrics in a scrapeable/receivable format.
* Latency and staleness: Monitor scrape intervals, adapter refresh rates, and HPA stabilization windows to avoid scaling on stale or bursty data.
* Naming consistency: Use consistent metric names and labels between application code, monitoring system, and adapter rules.
API surface and metric types
| Metric API | Purpose | Notes |
| ------------------------- | ----------------------------------------- | ------------------------------------------------------------------------- |
| `metrics.k8s.io` | Resource metrics (CPU/memory) | Provided by Metrics Server |
| `custom.metrics.k8s.io` | Per-object or per-pod application metrics | For metrics exposed per Kubernetes object or pod |
| `external.metrics.k8s.io` | Metrics not tied to Kubernetes objects | For external systems e.g., cloud provider metrics or external queue depth |
Example: minimal HPA using a per-Pod custom metric
This sample HPA scales a Deployment named `my-app` using a per-pod custom metric called `requests_per_second`. The adapter must expose `requests_per_second` via the Custom Metrics API.
```yaml theme={null}
apiVersion: autoscaling/v2
kind: HorizontalPodAutoscaler
metadata:
name: my-app-hpa
spec:
scaleTargetRef:
apiVersion: apps/v1
kind: Deployment
name: my-app
minReplicas: 1
maxReplicas: 10
metrics:
- type: Pods
pods:
metric:
name: requests_per_second
target:
type: AverageValue
averageValue: "10"
```
Verify that the adapter exposes metrics
* Query the custom metrics API (example):
```bash theme={null}
kubectl get --raw "/apis/custom.metrics.k8s.io/v1beta1/"
```
* Check the adapter’s diagnostics or metrics endpoint (adapter-specific).
Notes and best practices
* Consistent naming: Keep metric names and labels aligned across application, collector, and adapter configuration.
* Validate exposure: Use `kubectl get --raw` to confirm the metric is available under the expected API path.
* Monitor pipeline latency: Scrape intervals and adapter refresh frequencies affect scaling reaction time.
* Stabilize scaling: Use HPA stabilization windows and threshold tuning to reduce flapping from transient spikes.
* RBAC and security: Ensure the adapter has proper permissions to expose metrics and that the HPA can query them.
Summary
Custom metrics enable HPA to scale workloads based on application-specific signals rather than only CPU/memory. To use them effectively you need:
* Application instrumentation (Prometheus/OpenTelemetry)
* A metrics collector (e.g., Prometheus)
* An adapter that exposes metrics through `custom.metrics.k8s.io` or `external.metrics.k8s.io`
* A configured HPA that references those metrics
When properly configured, this pipeline enables meaningful, business-focused autoscaling that optimizes performance and cost.
Links and references
* Prometheus client libraries: [https://prometheus.io/docs/instrumenting/clientlibs/](https://prometheus.io/docs/instrumenting/clientlibs/)
* OpenTelemetry: [https://opentelemetry.io/](https://opentelemetry.io/)
* Prometheus overview: [https://prometheus.io/docs/introduction/overview/](https://prometheus.io/docs/introduction/overview/)
* prometheus-adapter: [https://github.com/kubernetes-sigs/prometheus-adapter](https://github.com/kubernetes-sigs/prometheus-adapter)
* Kubernetes core metrics pipeline: [https://kubernetes.io/docs/tasks/debug-application-cluster/core-metrics-pipeline/#metrics-server](https://kubernetes.io/docs/tasks/debug-application-cluster/core-metrics-pipeline/#metrics-server)
Practical considerations when using custom metrics
* Metrics server limitation: The default `metrics-server` serves only resource metrics. Install a monitoring stack (e.g., Prometheus) for application metrics.
* Adapter configuration: Install an adapter that implements the Custom/External Metrics APIs and map monitoring metrics to API resources. Configure metric names, namespaces, and RBAC carefully.
* Monitoring instrumenting: Make sure application agents, exporters, or client libraries expose metrics in a scrapeable/receivable format.
* Latency and staleness: Monitor scrape intervals, adapter refresh rates, and HPA stabilization windows to avoid scaling on stale or bursty data.
* Naming consistency: Use consistent metric names and labels between application code, monitoring system, and adapter rules.
API surface and metric types
| Metric API | Purpose | Notes |
| ------------------------- | ----------------------------------------- | ------------------------------------------------------------------------- |
| `metrics.k8s.io` | Resource metrics (CPU/memory) | Provided by Metrics Server |
| `custom.metrics.k8s.io` | Per-object or per-pod application metrics | For metrics exposed per Kubernetes object or pod |
| `external.metrics.k8s.io` | Metrics not tied to Kubernetes objects | For external systems e.g., cloud provider metrics or external queue depth |
Example: minimal HPA using a per-Pod custom metric
This sample HPA scales a Deployment named `my-app` using a per-pod custom metric called `requests_per_second`. The adapter must expose `requests_per_second` via the Custom Metrics API.
```yaml theme={null}
apiVersion: autoscaling/v2
kind: HorizontalPodAutoscaler
metadata:
name: my-app-hpa
spec:
scaleTargetRef:
apiVersion: apps/v1
kind: Deployment
name: my-app
minReplicas: 1
maxReplicas: 10
metrics:
- type: Pods
pods:
metric:
name: requests_per_second
target:
type: AverageValue
averageValue: "10"
```
Verify that the adapter exposes metrics
* Query the custom metrics API (example):
```bash theme={null}
kubectl get --raw "/apis/custom.metrics.k8s.io/v1beta1/"
```
* Check the adapter’s diagnostics or metrics endpoint (adapter-specific).
Notes and best practices
* Consistent naming: Keep metric names and labels aligned across application, collector, and adapter configuration.
* Validate exposure: Use `kubectl get --raw` to confirm the metric is available under the expected API path.
* Monitor pipeline latency: Scrape intervals and adapter refresh frequencies affect scaling reaction time.
* Stabilize scaling: Use HPA stabilization windows and threshold tuning to reduce flapping from transient spikes.
* RBAC and security: Ensure the adapter has proper permissions to expose metrics and that the HPA can query them.
Summary
Custom metrics enable HPA to scale workloads based on application-specific signals rather than only CPU/memory. To use them effectively you need:
* Application instrumentation (Prometheus/OpenTelemetry)
* A metrics collector (e.g., Prometheus)
* An adapter that exposes metrics through `custom.metrics.k8s.io` or `external.metrics.k8s.io`
* A configured HPA that references those metrics
When properly configured, this pipeline enables meaningful, business-focused autoscaling that optimizes performance and cost.
Links and references
* Prometheus client libraries: [https://prometheus.io/docs/instrumenting/clientlibs/](https://prometheus.io/docs/instrumenting/clientlibs/)
* OpenTelemetry: [https://opentelemetry.io/](https://opentelemetry.io/)
* Prometheus overview: [https://prometheus.io/docs/introduction/overview/](https://prometheus.io/docs/introduction/overview/)
* prometheus-adapter: [https://github.com/kubernetes-sigs/prometheus-adapter](https://github.com/kubernetes-sigs/prometheus-adapter)
* Kubernetes core metrics pipeline: [https://kubernetes.io/docs/tasks/debug-application-cluster/core-metrics-pipeline/#metrics-server](https://kubernetes.io/docs/tasks/debug-application-cluster/core-metrics-pipeline/#metrics-server)