Kubernetes Autoscaling

Horizontal Pod Autoscaler HPA

HPA Multiple Metrics

Welcome to this guide on using Kubernetes’ Horizontal Pod Autoscaler (HPA) with both native and custom metrics. Combining CPU utilization with application-specific indicators—like request rate or transaction count—ensures your workloads scale precisely during demand spikes.

Use Case: E-commerce Platform

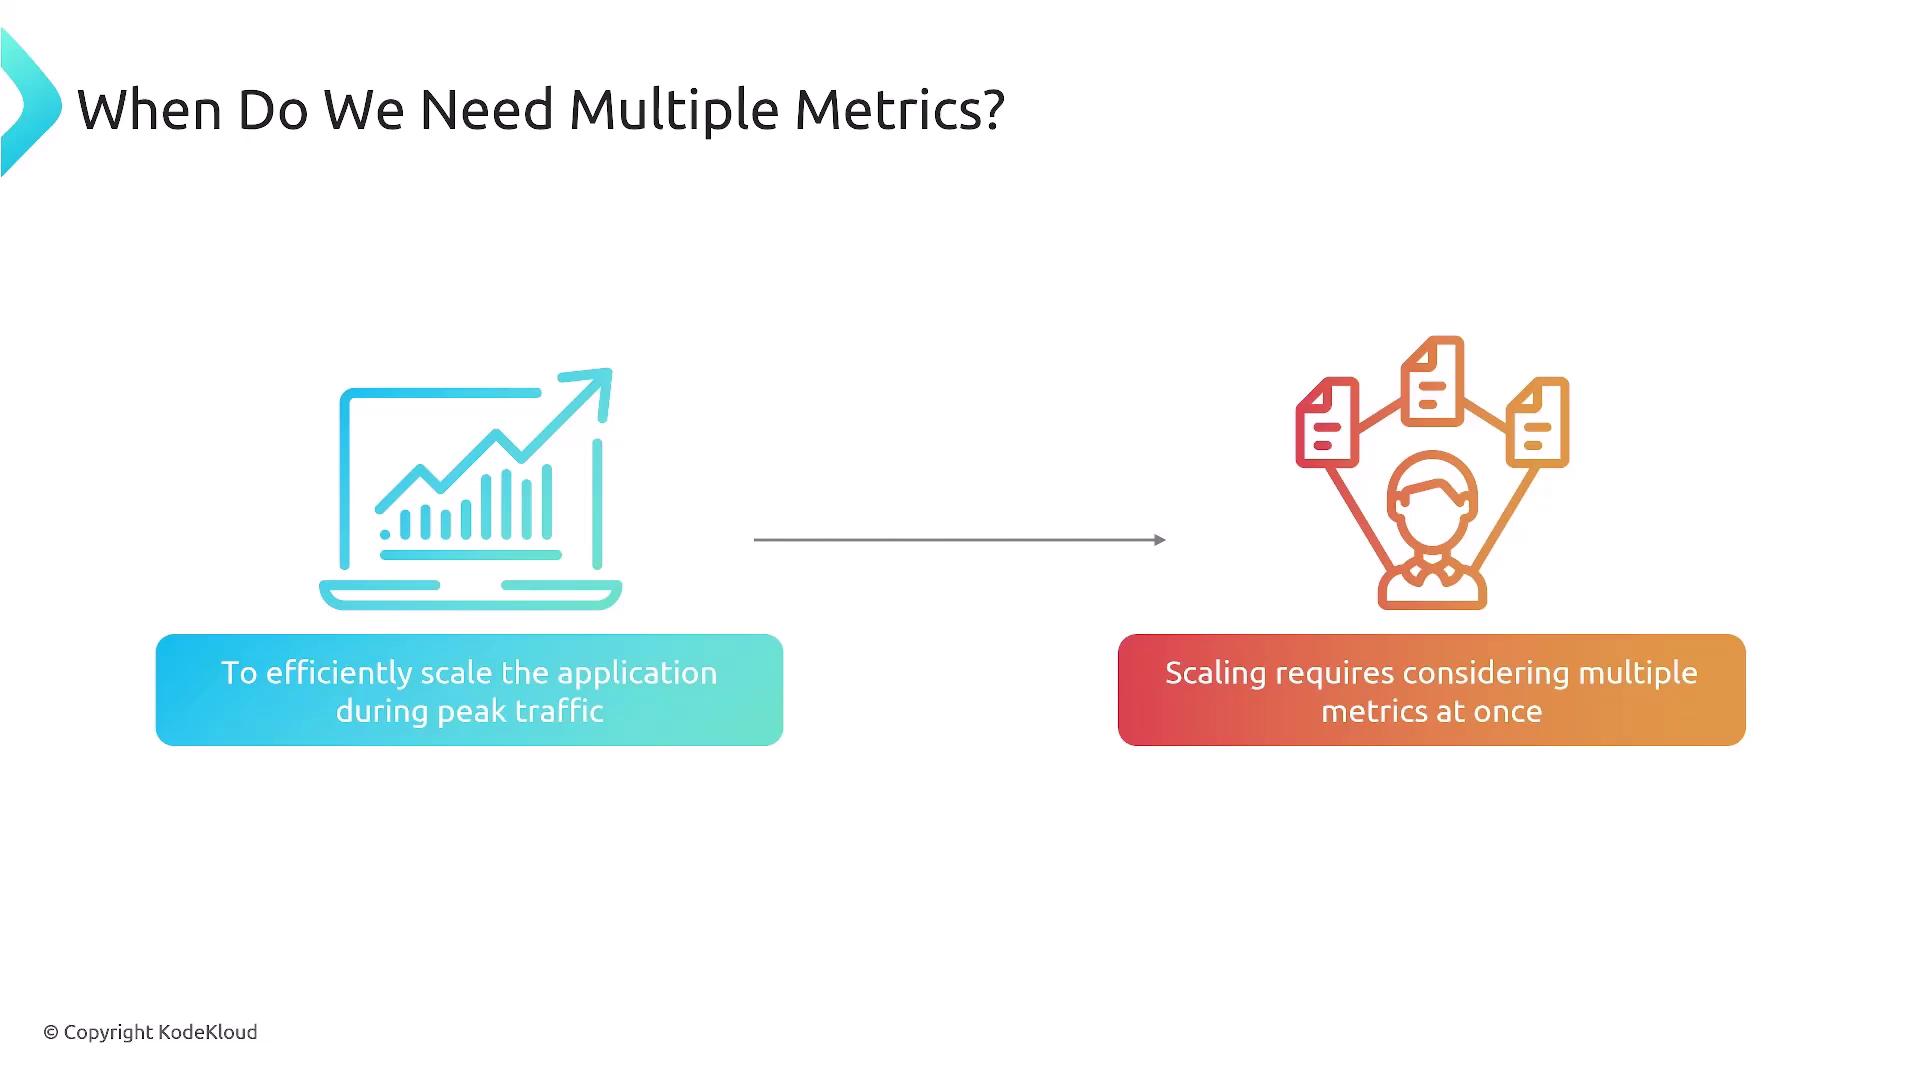
Consider a high-traffic e-commerce site where shoppers browse items, add them to carts, and complete purchases. Traffic surges during promotions make CPU and memory alone insufficient signals. You need application metrics (e.g., requests per second, cart size) to scale effectively.

The image illustrates the need for multiple metrics in an e-commerce application, highlighting three key activities: browsing products, adding to cart, and processing transactions.

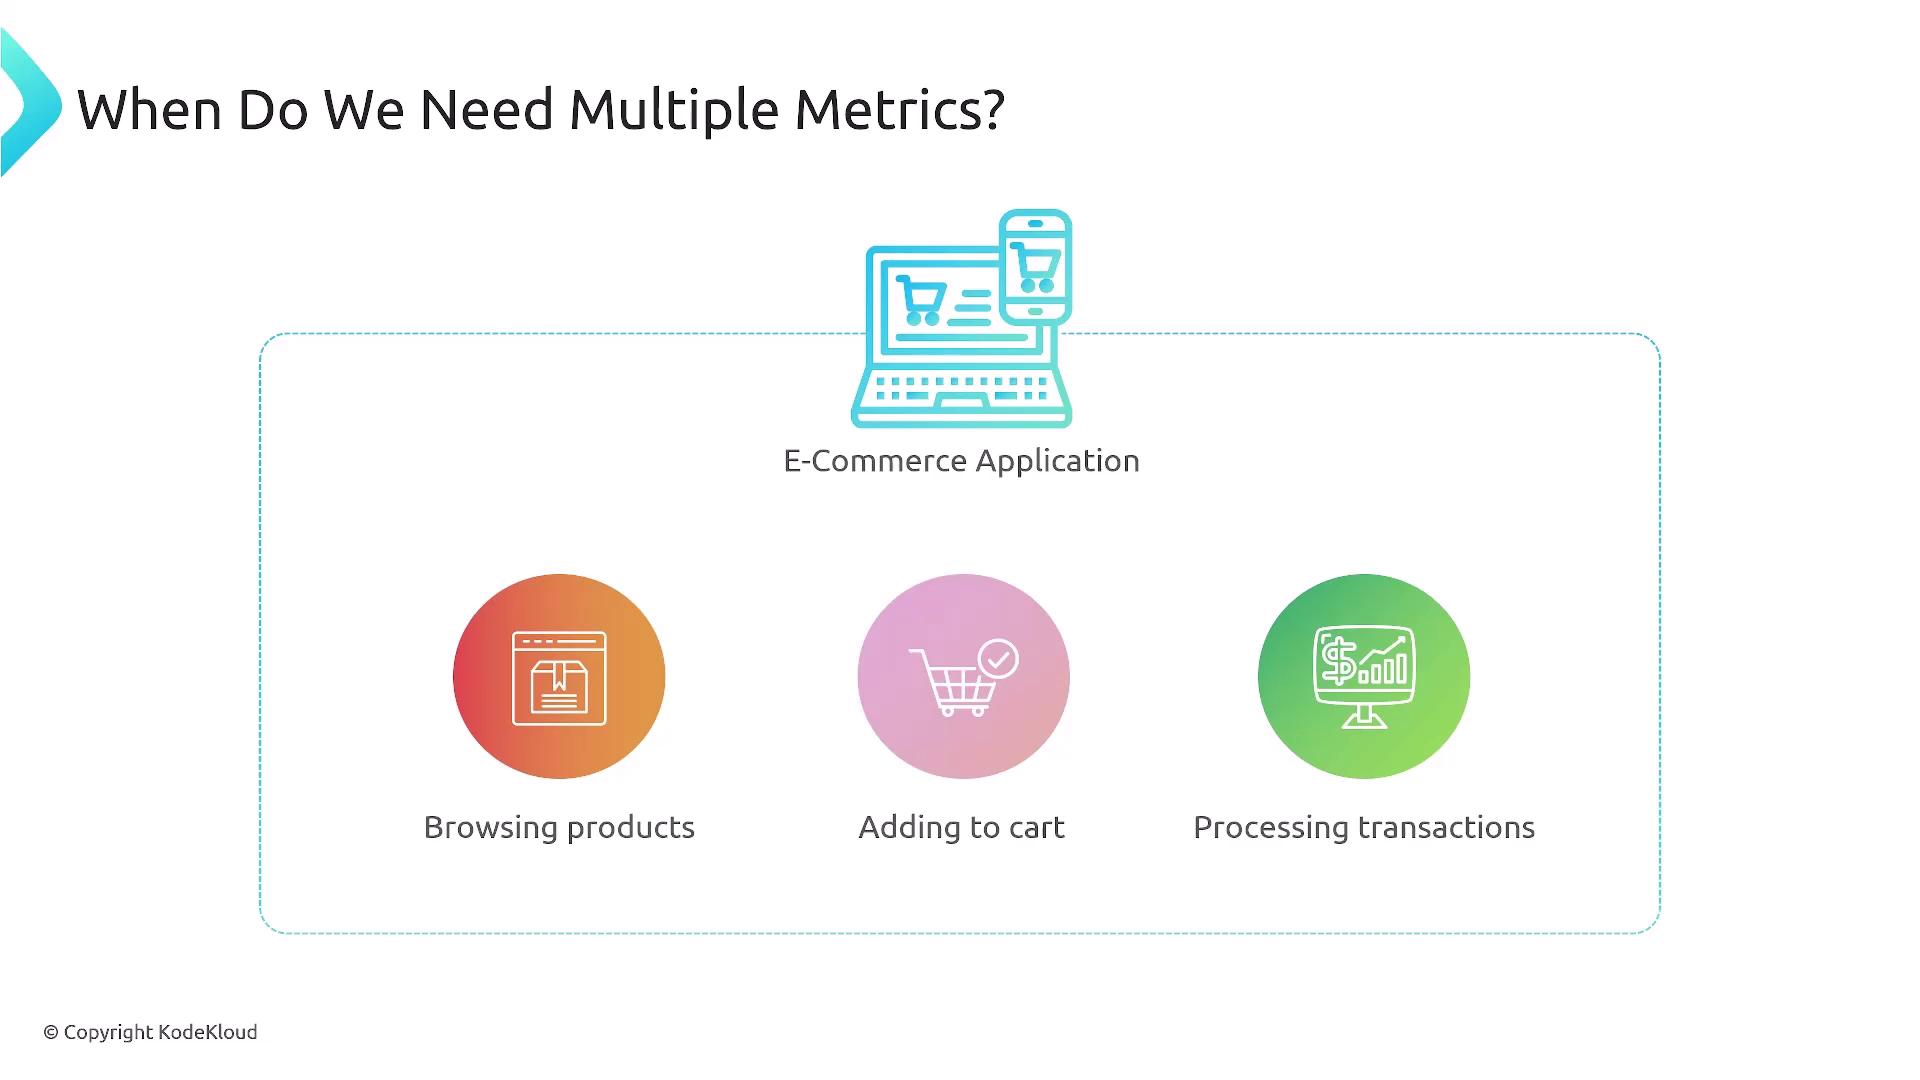
Microservices and Independent Scaling

Your platform runs three microservices:

  • Catalog Service: Handles product browsing
  • Cart Service: Manages cart operations
  • Checkout Service: Processes transactions

Each is a separate Deployment. To know when to scale the Catalog Service, monitor both CPU utilization and incoming request rate.

The image illustrates the need for multiple metrics to efficiently scale applications during peak traffic, highlighting that scaling requires considering various metrics simultaneously.

Exposing Custom Metrics with Prometheus

  1. Instrument your application to expose HTTP request metrics (e.g., active_requests).
  2. Deploy Prometheus in-cluster to scrape those metrics.

Note

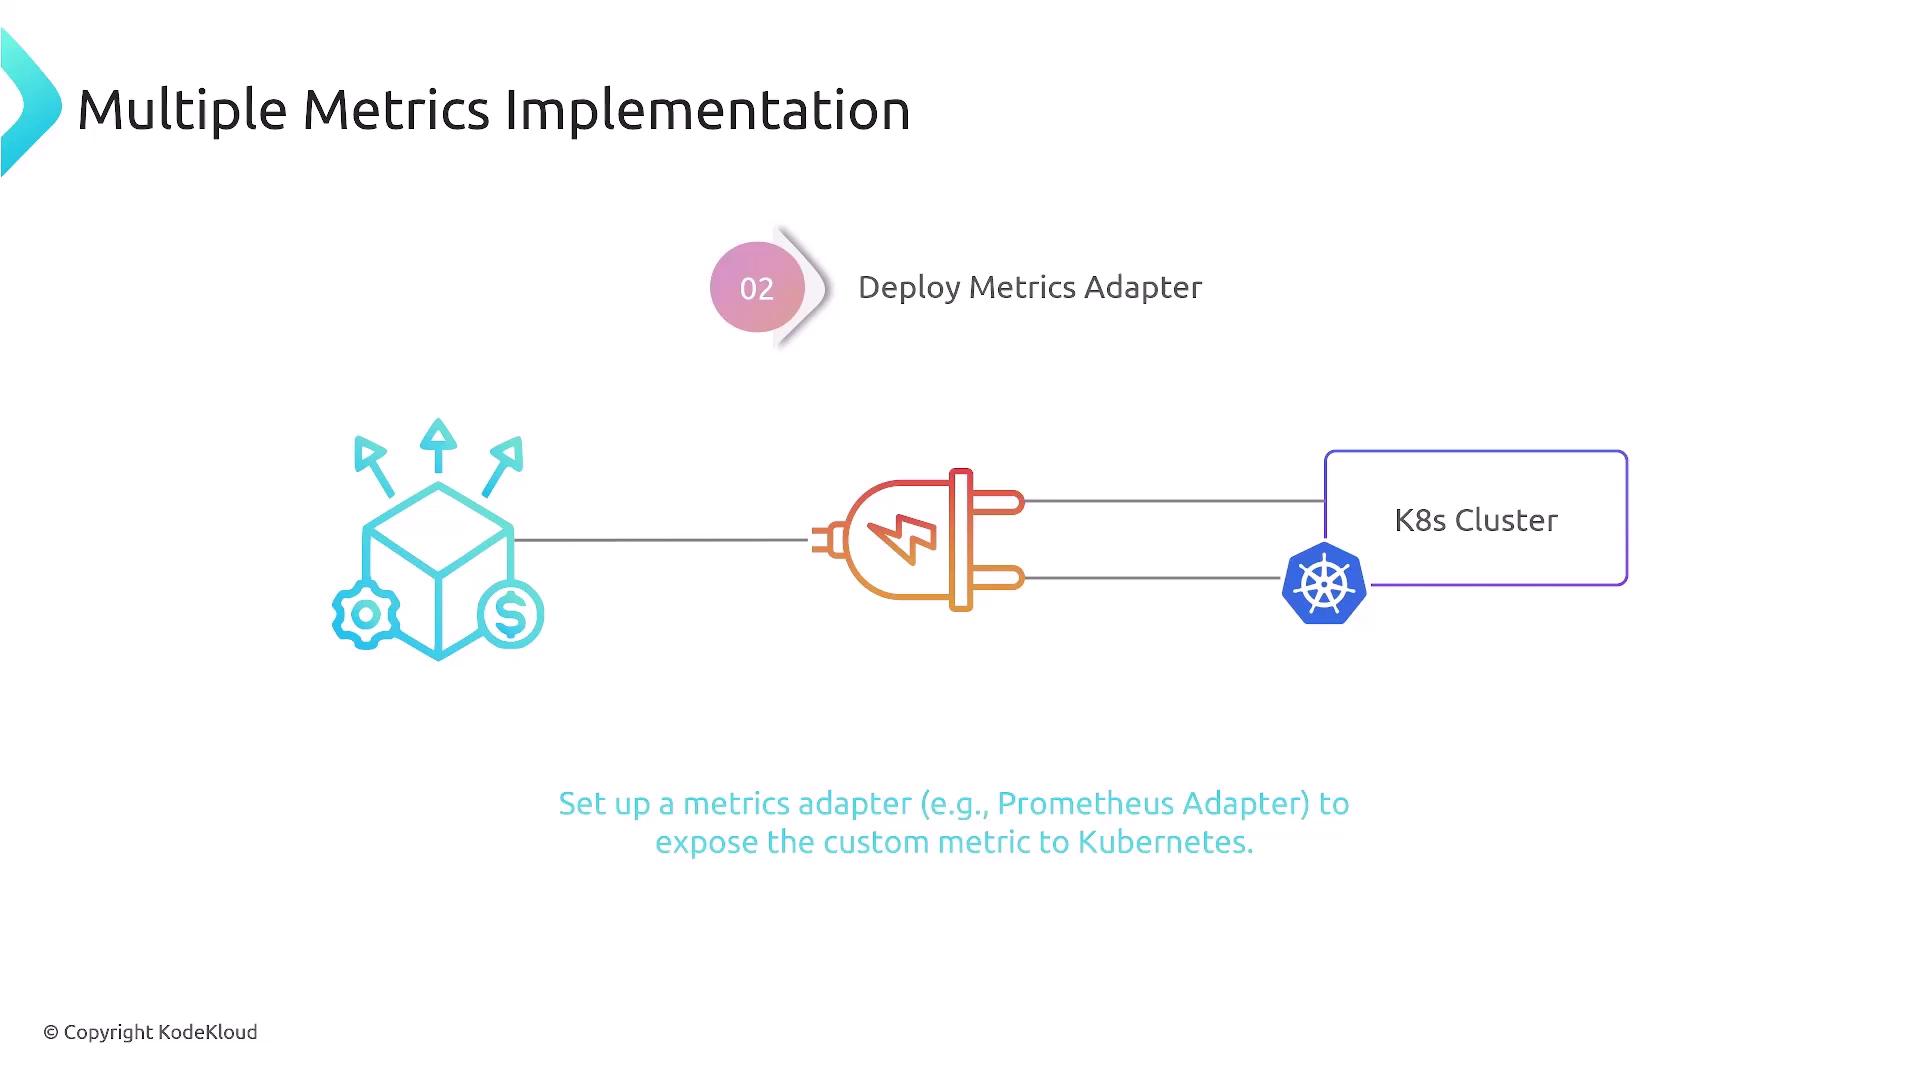
Ensure your service exports Prometheus-formatted metrics (e.g., via client libraries like prometheus-client).

Next, install a metrics adapter—such as the Prometheus Metrics Adapter—so Kubernetes can query custom metrics from Prometheus.

The image is a slide titled "Multiple Metrics Implementation" with a focus on exposing custom metrics. It suggests instrumenting the backend to track active HTTP requests and using a monitoring system like Prometheus to collect these metrics.

The image illustrates the implementation of multiple metrics by deploying a metrics adapter to expose custom metrics to a Kubernetes cluster.

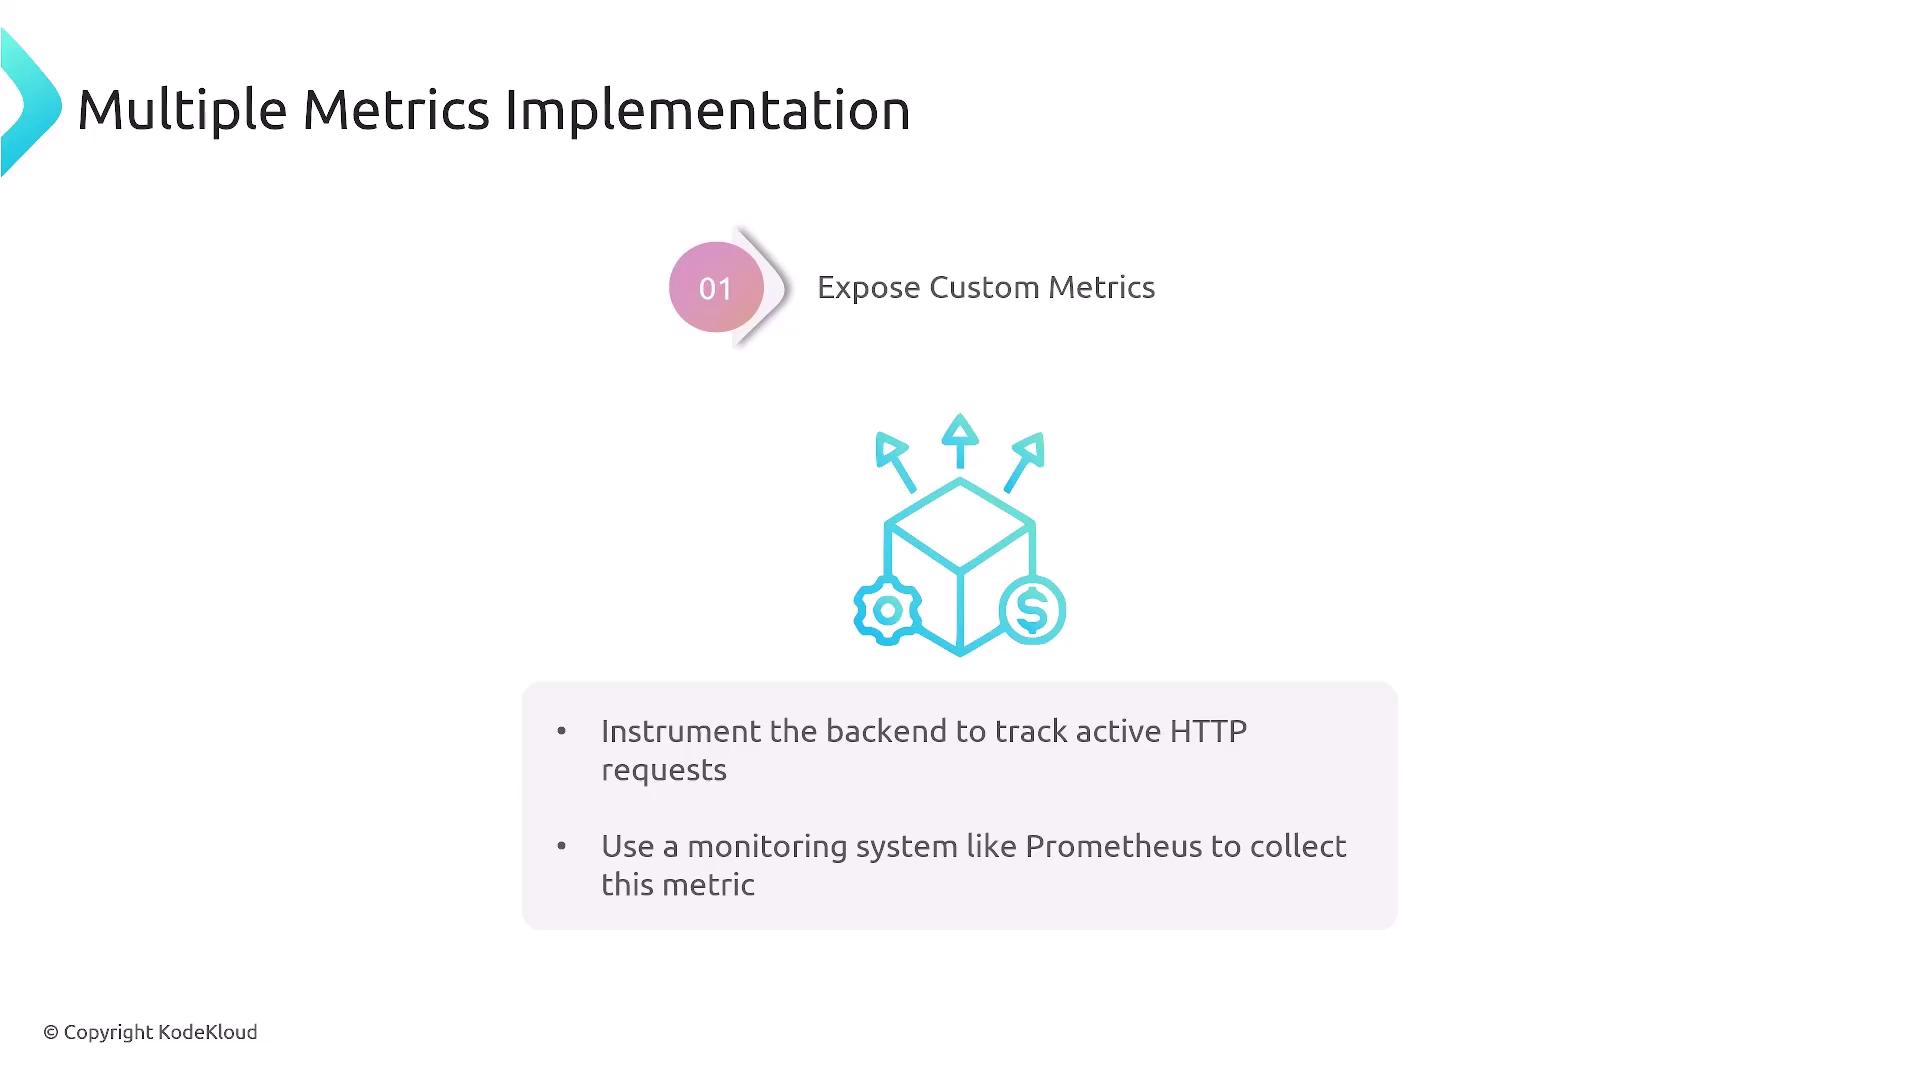
Configuring HPA with Multiple Metrics

Below is a sample HorizontalPodAutoscaler manifest that scales the backend-service Deployment by:

  • CPU utilization (70% average)
  • Active HTTP requests per pod (100 average)
apiVersion: autoscaling/v2
kind: HorizontalPodAutoscaler
metadata:
  name: backend-service-hpa
spec:
  scaleTargetRef:
    apiVersion: apps/v1
    kind: Deployment
    name: backend-service
  minReplicas: 2
  maxReplicas: 10
  metrics:
    - type: Resource
      resource:
        name: cpu
        target:
          type: Utilization
          averageUtilization: 70
    - type: Pods
      pods:
        metric:
          name: active_http_requests
        target:
          type: AverageValue
          averageValue: "100"
Metric TypeSourceAim
ResourceKubernetes Metrics ServerScale by CPU utilization (70% avg)
PodsPrometheus Metrics AdapterScale by HTTP requests (100 avg/pod)

The HPA controller evaluates both metrics and adjusts replicas to satisfy the most demanding threshold.

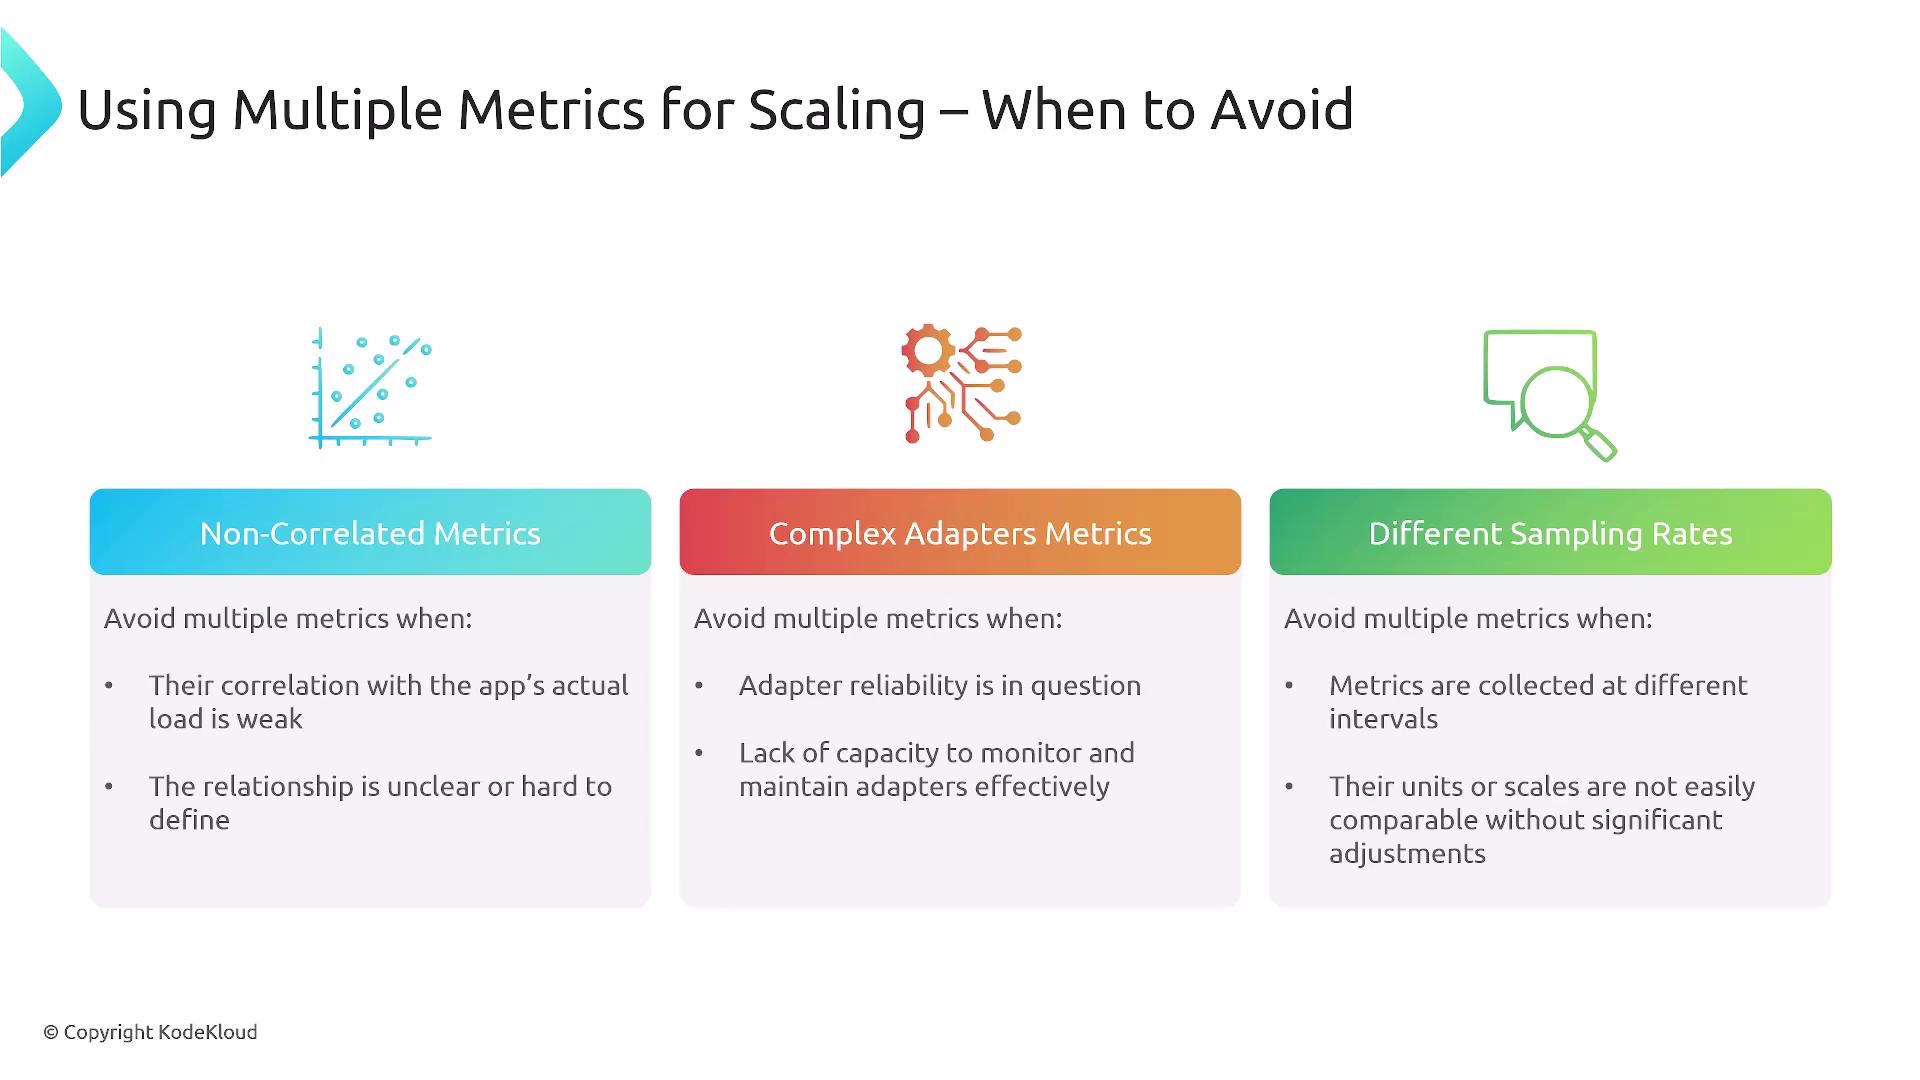
When to Avoid Multiple Metrics

While powerful, multiple-metric scaling can introduce complexity:

  • Metrics that are poorly correlated with real load
  • Unreliable or hard-to-maintain adapters
  • Disparate sampling rates or units

Warning

Mixing metrics with different collection intervals (e.g., 1s vs. 10m) can cause erratic scaling. Validate correlation before production.

The image provides guidelines on when to avoid using multiple metrics for scaling, focusing on non-correlated metrics, complex adapters metrics, and different sampling rates.


Balancing simplicity and accuracy is key. With the right metrics and adapters, HPA can keep your microservices responsive and cost-efficient.

Watch Video

Watch video content

Practice Lab

Practice lab

Previous
External Metrics Mechanisms