Kubernetes Networking Deep Dive

Kubernetes Ingress

Demo Traefik Observability

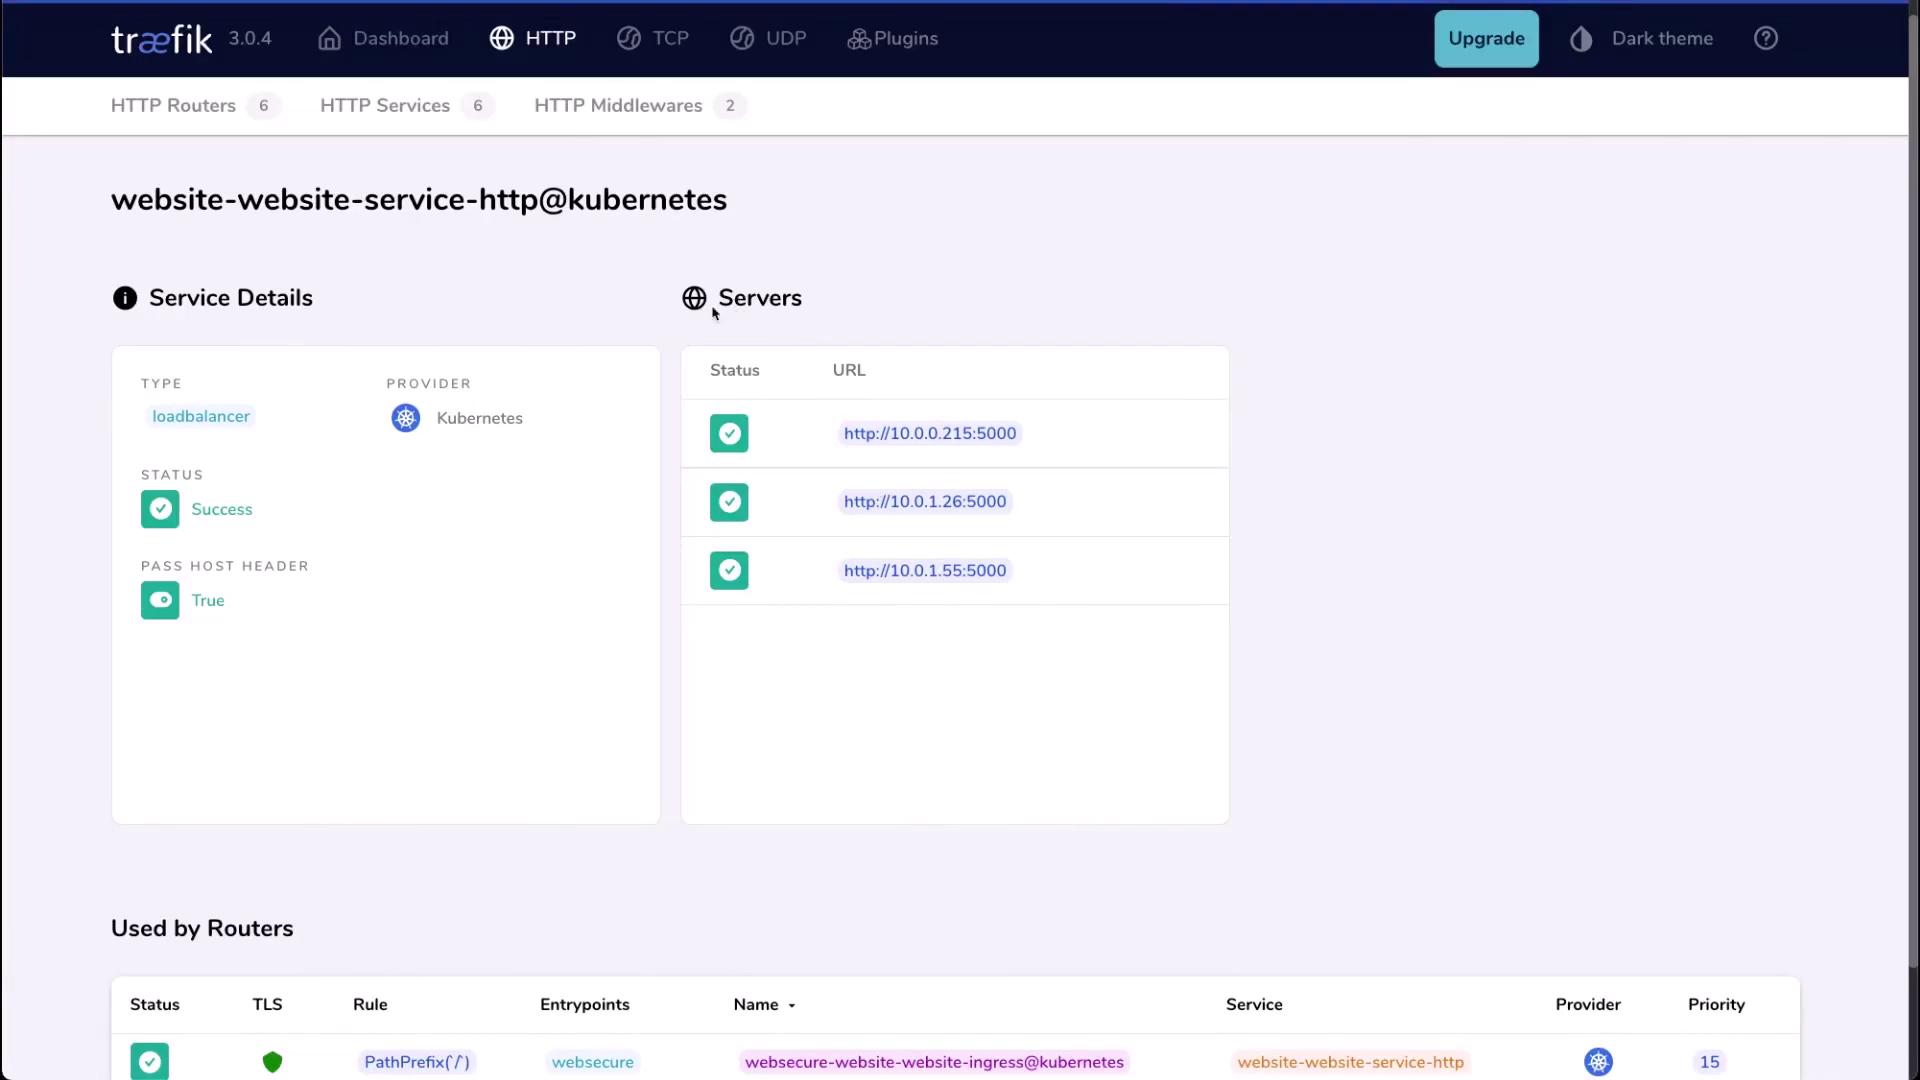
In this lesson, we’ll explore the Traefik dashboard—a powerful observability interface enabled by default in every Traefik installation. The dashboard provides real-time insights into routing rules, service health, and security settings. For production environments, avoid exposing this dashboard publicly. Use a private network or kubectl port-forward instead. In this lab, we will configure a NodePort (30000) for direct access.

1. Deploy the Traefik Dashboard Service

Create a Service of type NodePort to expose the Traefik API port:

# service-dashboard.yaml
apiVersion: v1
kind: Service
metadata:
  name: traefik-dashboard-service
  namespace: traefik
spec:
  type: NodePort
  ports:
    - port: 9000
      targetPort: traefik
      nodePort: 30000
  selector:
    app.kubernetes.io/instance: traefik-traefik

Apply and verify the Service:

kubectl apply -f service-dashboard.yaml
kubectl describe svc -n traefik traefik-dashboard-service

Expected output:

Name:                     traefik-dashboard-service
Namespace:                traefik
Selector:                 app.kubernetes.io/instance=traefik-traefik
Type:                     NodePort
IP:                       10.104.3.15
Port:                     9000/TCP
TargetPort:               traefik/TCP
NodePort:                 30000/TCP
Endpoints:                10.1.0.10:9000

2. Enable Insecure API Access

By default, Traefik’s API/dashboard is secured. For this lab, we’ll enable insecure access by adding --api.insecure=true to the deployment arguments.

Edit the Traefik deployment:

kubectl edit deployment traefik -n traefik

Under the container spec’s args: section, include:

args:
  - "--api.dashboard=true"
  - "--api.insecure=true"
  - "--entryPoints.metrics.address=:9100/tcp"
  - "--entryPoints.traefik.address=:9000/tcp"
  - "--entryPoints.web.address=:8000/tcp"
  - "--entryPoints.websecure.address=:8443/tcp"
  - "--metrics.prometheus=true"
  - "--metrics.prometheus.entrypoint=metrics"
  - "--providers.kubernetescrd"
  - "--providers.kubernetesingress"
  - "--entryPoints.websecure.http.tls=true"
  - "--log.level=INFO"
  - "--accesslog=true"
  - "--accesslog.fields.defaultmode=keep"
  - "--accesslog.fields.headers.defaultmode=drop"
  - "--ping=true"
  - "--global.sendanonymoususage"

Save and exit. The deployment will rollout updated pods:

kubectl get pods -n traefik

You should see:

NAME                         READY   STATUS    RESTARTS   AGE
traefik-79554cb74d-txqdf     1/1     Running   0          30s

3. Access the Dashboard

Open port 30000 on your node and navigate to:

http://<node-ip>:30000

On the dashboard, you’ll find:

  • Entry Points: Listening ports on the Traefik pod
  • Routers: Rules mapping incoming requests to services
  • Services: Backend services and their endpoints
  • Middlewares: Request transformations (none configured here)

Entry Points Overview

Entry PointPortProtocolTLS Enabled
metrics9100TCPNo
traefik9000TCPNo
web8000TCPNo
websecure8443TCPYes

Inspecting Services

On the Services page, you can drill into each service’s pods and endpoints. In our CompanyX application, all services show healthy endpoints:

The image shows a Traefik dashboard displaying service details for a Kubernetes load balancer, including server URLs and their statuses. It also lists routers used by the service with associated rules and priorities.

4. Scale the Application

Let’s scale the CompanyX website to 5 replicas:

kubectl scale deployment companyx-website --replicas=5

Verify new pods:

kubectl get pods -n companyx
NAME                                  READY   STATUS    RESTARTS   AGE
companyx-website-5d596d7d7d-abc12     1/1     Running   0          1m
companyx-website-5d596d7d7d-def34     1/1     Running   0          1m
companyx-website-5d596d7d7d-ghi56     1/1     Running   0          1m
companyx-website-5d596d7d7d-jkl78     1/1     Running   0          1m
companyx-website-5d596d7d7d-mno90     1/1     Running   0          1m

Refresh the Traefik dashboard—you’ll now see five healthy pods listed under the CompanyX service.

Note

In a production setup, secure the dashboard with authentication or restrict access to a private network.


This completes our overview of the Traefik observability dashboard—an invaluable tool for monitoring traffic flows, routing, and service health in Kubernetes. For further reading, see the Traefik documentation.

Watch Video

Watch video content

Previous
Demo Traefik Installation