> ## Documentation Index
> Fetch the complete documentation index at: https://notes.kodekloud.com/llms.txt
> Use this file to discover all available pages before exploring further.
# Demo Cilium Hubble
> This article provides a guide on setting up Cilium Hubble for metrics, monitoring, and visibility in a Kubernetes environment.
## Prerequisites
* A running Kubernetes cluster with Cilium installed (v1.15.3 or later).
* Prometheus and Grafana deployed in the `cilium-monitoring` namespace.
Hubble components (Relay, UI, metrics) are disabled by default. You must enable them via Helm to collect and visualize network flows.
## 1. Verify Cilium and Hubble Status
First, confirm Cilium is healthy and Hubble is not yet active:
```bash theme={null}
root@controlplane ~ ➜ cilium status
Cilium: OK
Operator: OK
Envoy DaemonSet: disabled (using embedded mode)
Hubble Relay: disabled
ClusterMesh: disabled
Deployment cilium-operator Desired: 1, Ready: 1/1, Available: 1/1
DaemonSet cilium Desired: 2, Ready: 2/2, Available: 2/2
Containers: cilium Running: 2
cilium-operator Running: 1
Cluster Pods: 5/5 managed by Cilium
Helm chart version: v1.15.3
Image versions
cilium quay.io/cilium/cilium:v1.15.3
cilium-operator quay.io/cilium/operator-generic:v1.15.3
```
Verify that Grafana and Prometheus are up but not receiving Hubble metrics:
```bash theme={null}
root@controlplane ~ ➜ kubectl get all -n cilium-monitoring
NAME READY STATUS RESTARTS AGE
pod/grafana-xxx 1/1 Running 0 10m
pod/prometheus-yyy 1/1 Running 0 10m
NAME TYPE CLUSTER-IP PORT(S)
service/grafana NodePort 10.98.81.88 3000:32000/TCP
service/prometheus ClusterIP 10.99.242.121 9090/TCP
```
Check that the Cilium Helm repo is configured:
```bash theme={null}
root@controlplane ~ ➜ helm repo list
NAME URL
cilium https://helm.cilium.io/
```
## 2. Enable Hubble Components
Upgrade your Cilium installation to enable Hubble Relay, UI, and Prometheus metrics:
```bash theme={null}
root@controlplane ~ ➜ helm upgrade cilium cilium/cilium --version 1.15.4 \
--namespace kube-system \
--reuse-values \
--set hubble.enabled=true \
--set hubble.relay.enabled=true \
--set hubble.ui.enabled=true \
--set hubble.metrics.enableOpenMetrics=true \
--set prometheus.enabled=true \
--set operator.prometheus.enabled=true \
--set hubble.metrics.enabled="{dns,drop,tcp,flow,port_distribution,icmp,httpV2:exemplars=true;labelsContext=source_ip,source_namespace,destination_ip,destination_namespace,destination_workload,traffic_direction}"
```
| Metric Type | Description |
| ------------------ | --------------------------------------------- |
| dns | DNS query and response details |
| drop | Packets dropped by policy or misconfiguration |
| tcp, icmp | L4 protocol-specific flow statistics |
| port\_distribution | Top ports by traffic volume |
| httpV2 | HTTP/2 requests and response summaries |
After a minute, confirm that Hubble Relay and UI are healthy:
```bash theme={null}
root@controlplane ~ ➜ cilium status
...
Hubble Relay: OK
Hubble UI: OK
```
## 3. View Hubble Metrics in Grafana
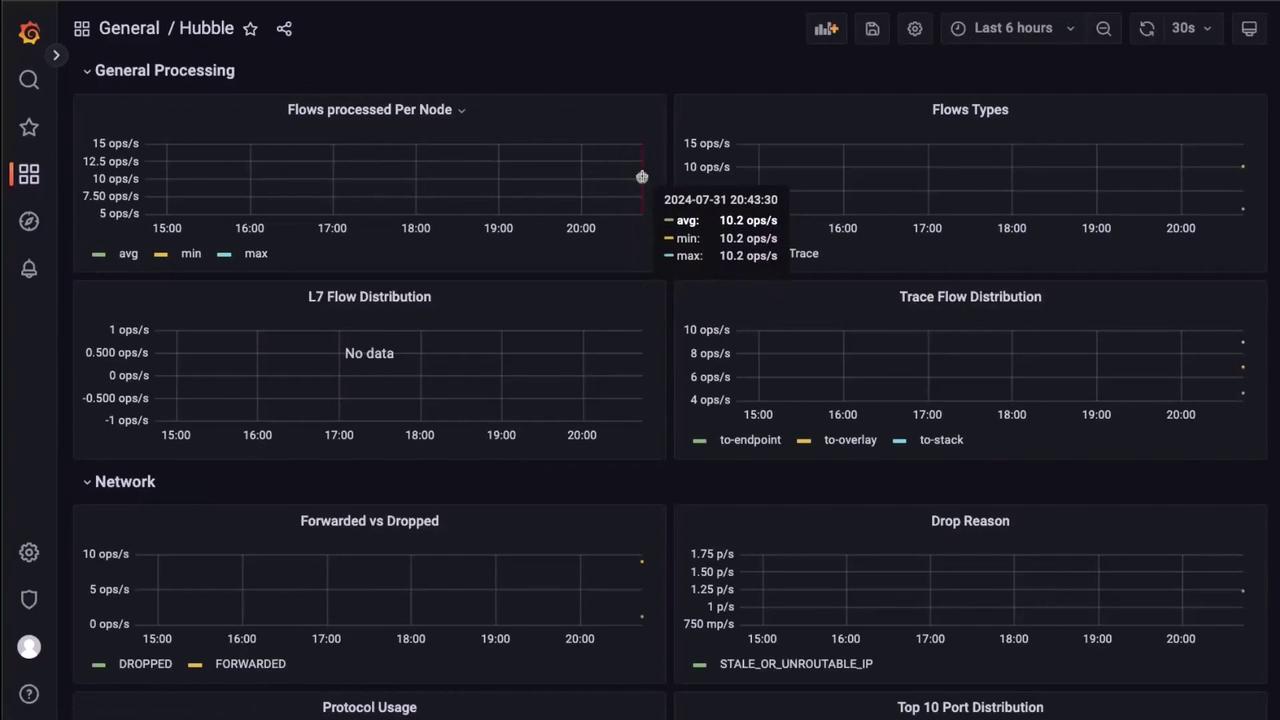
Navigate to the Grafana dashboard in the `cilium-monitoring` namespace. You should see Hubble flow metrics such as flows per node, dropped vs forwarded traffic, and protocol distribution:
## 4. Expose the Hubble UI as NodePort
By default, the Hubble UI service is `ClusterIP`. Edit it to use a NodePort for external access:
```bash theme={null}
root@controlplane ~ ➜ kubectl edit svc hubble-ui -n kube-system
```
Replace the spec with:
```yaml theme={null}
apiVersion: v1
kind: Service
metadata:
name: hubble-ui
namespace: kube-system
spec:
type: NodePort
ports:
- name: http
port: 80
targetPort: 8081
nodePort: 30000
selector:
k8s-app: hubble-ui
```
Exposing services via NodePort can open your cluster to external traffic. Ensure proper firewall rules or security groups are in place.
Now you can access the Hubble UI at `:30000`.
## 5. Test Network Flows with curl
We have a demo application offering two endpoints:
* `/api` – restricted to requests with header `X-API-KEY: abc123` from pods labeled `app=admin`.
* `/healthz` – open to all traffic.
Create a `CiliumNetworkPolicy` to enforce this:
```yaml theme={null}
apiVersion: cilium.io/v2
kind: CiliumNetworkPolicy
metadata:
name: demo-policy
namespace: default
spec:
endpointSelector:
matchLabels:
app: demo
ingress:
- fromEndpoints:
- matchLabels: {app: admin}
toPorts:
- ports: [{port: "80", protocol: TCP}]
rules:
http:
- method: GET
path: /healthz
- method: GET
path: /api
headers: {X-API-KEY: abc123}
```
Apply the policy and perform valid and invalid requests:
```bash theme={null}
root@controlplane ~ ➜ kubectl run --rm -i --tty admin --labels=app=admin \
--image=curlimages/curl --restart=Never -- \
curl -H "X-API-KEY: abc123" http://app-svc-80/api
{"message":"Have a great day!","method":"GET","url":"/api"}
```
Invalid request (missing API key) will time out:
```bash theme={null}
root@controlplane ~ ➜ kubectl run --rm -i --tty admin --image=curlimages/curl \
--restart=Never -- curl http://app-svc-80/api --connect-timeout 2
curl: (28) Failed to connect to app-svc-80 port 80 after 2001 ms: Timeout was reached
```
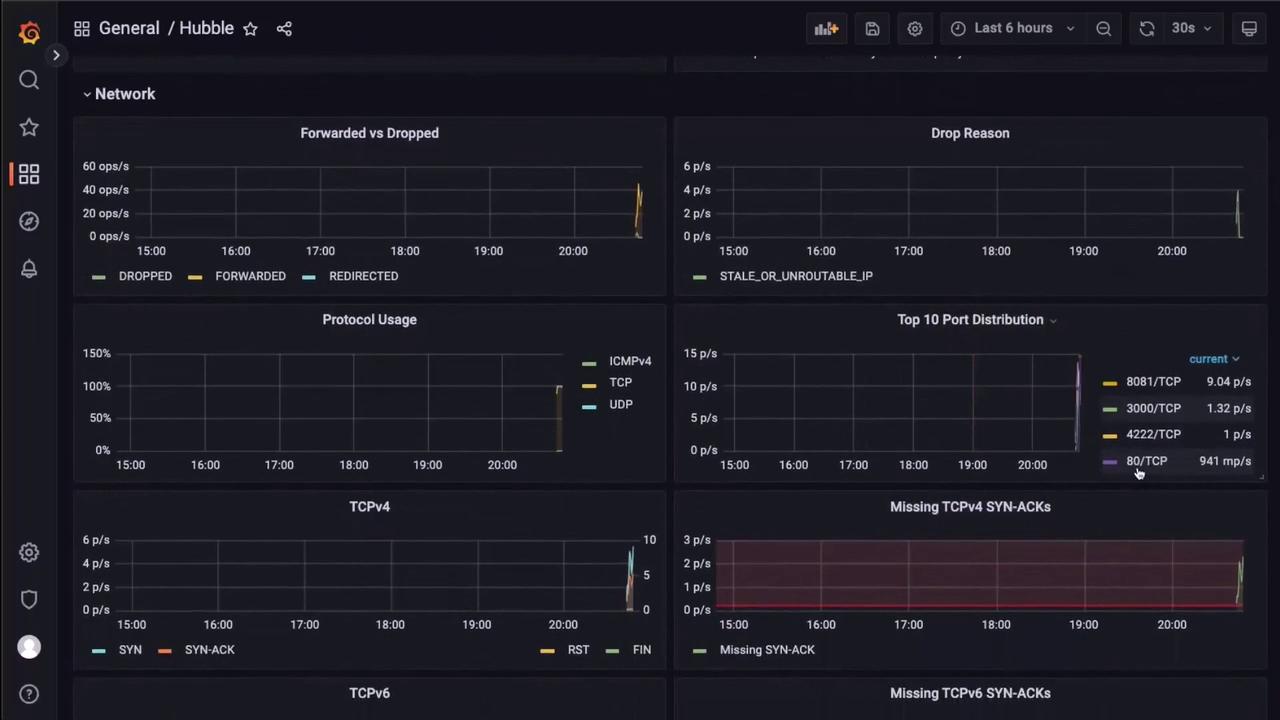
### Observe Metrics for Forwarded vs Dropped Flows
Return to Grafana to see the changes in the “Forwarded vs Dropped” panel and other flow statistics:
## 6. Visualize Live Flows in Hubble UI
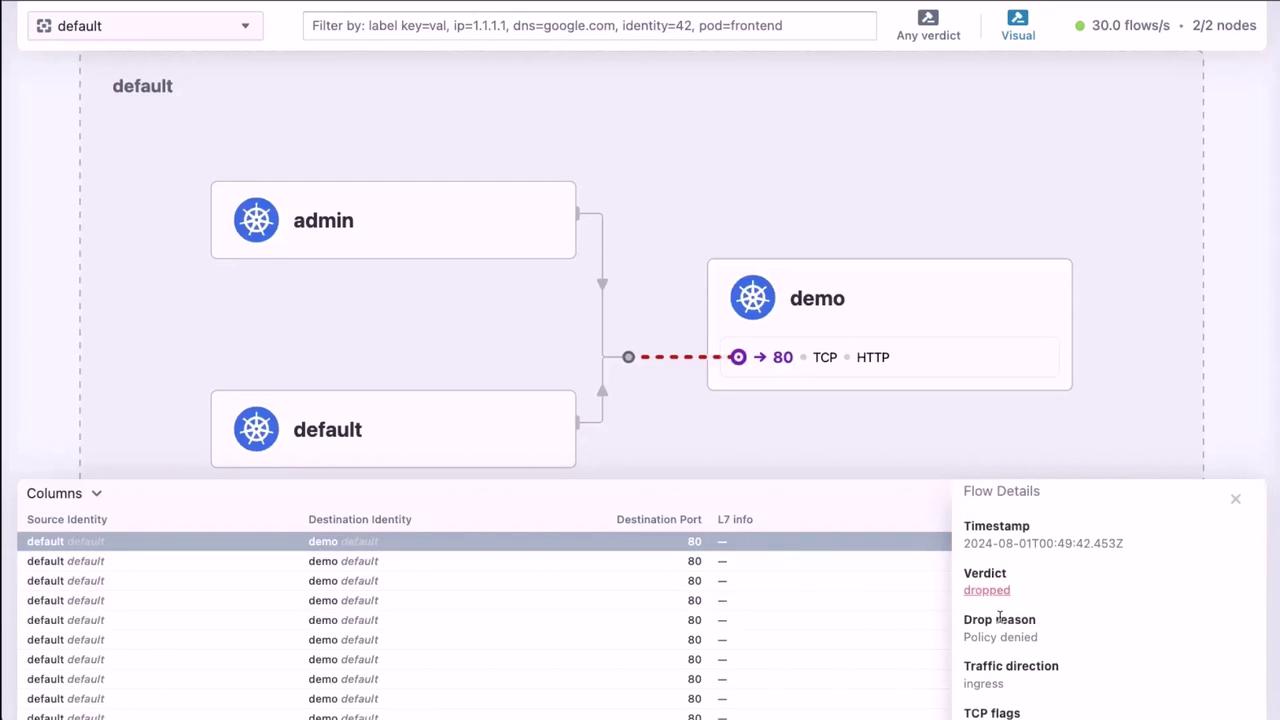
Open the Hubble UI at `:30000` to explore live network flows. Click on any flow to see detailed metadata and policy verdicts:
## 7. Using the Hubble CLI
You can also use the Hubble CLI for real-time troubleshooting. Exec into a Cilium agent pod:
```bash theme={null}
root@controlplane ~ ➜ kubectl exec -it -n kube-system cilium-xxxx -c cilium-agent -- /bin/bash
root@cilium:/home/cilium# hubble version
hubble 0.13.2 compiled with go1.21.8 on linux/amd64
root@cilium:/home/cilium# hubble status
Healthcheck (unix:///var/run/cilium/hubble.sock): Ok
Current/Max Flows: 4095/4095 (100.00%)
Flows/s: 4.77
```
Stream live flow logs:
```bash theme={null}
root@cilium:/home/cilium# hubble observe
Aug 1 00:52:09.273: 10.0.1.84:54976 <> kube-system/hubble-ui:8081 to-overlay FORWARDED (TCP SYN)
Aug 1 00:52:09.276: kube-system/hubble-ui:57128 -> kube-system/hubble-relay:4245 FORWARDED (TCP ACK, PSH)
```
Filter flows by namespace, pod, time range, or format:
```bash theme={null}
# Only default namespace
root@cilium# hubble observe --namespace default
# From the admin pod
root@cilium# hubble observe --namespace default --from-pod admin
# Last 30 minutes
root@cilium# hubble observe --since 30m
# Follow live updates
root@cilium# hubble observe --follow
# JSON output
root@cilium# hubble observe -o json | jq .
[
{
"time": "2024-08-01T00:49:41.474560859Z",
"source": {
"pod": "admin",
"namespace": "default"
},
"destination": {
"pod": "demo-deployment-7ccd685fcc-6grkd",
"namespace": "default",
"port": 80
},
"Type": "L3_L4",
"Summary": "TCP SYN"
}
]
```
## Conclusion
Cilium Hubble delivers powerful network observability through both a rich UI and command-line interface. Integrate Hubble with Prometheus and Grafana for long-term monitoring or use the `hubble` CLI for on-the-fly troubleshooting.
## Links and References
* [Cilium Documentation](https://docs.cilium.io/)
* [Hubble Getting Started](https://docs.cilium.io/en/stable/gettingstarted/hubble/)
* [Prometheus Official Site](https://prometheus.io)
* [Grafana Labs](https://grafana.com)