> ## Documentation Index
> Fetch the complete documentation index at: https://notes.kodekloud.com/llms.txt
> Use this file to discover all available pages before exploring further.
# Prometheus Operator
> Describes how the Prometheus Operator automates Prometheus on Kubernetes using CRDs like ServiceMonitor PodMonitor and PrometheusRule to manage configuration, selectors, ownership, and reconciliation
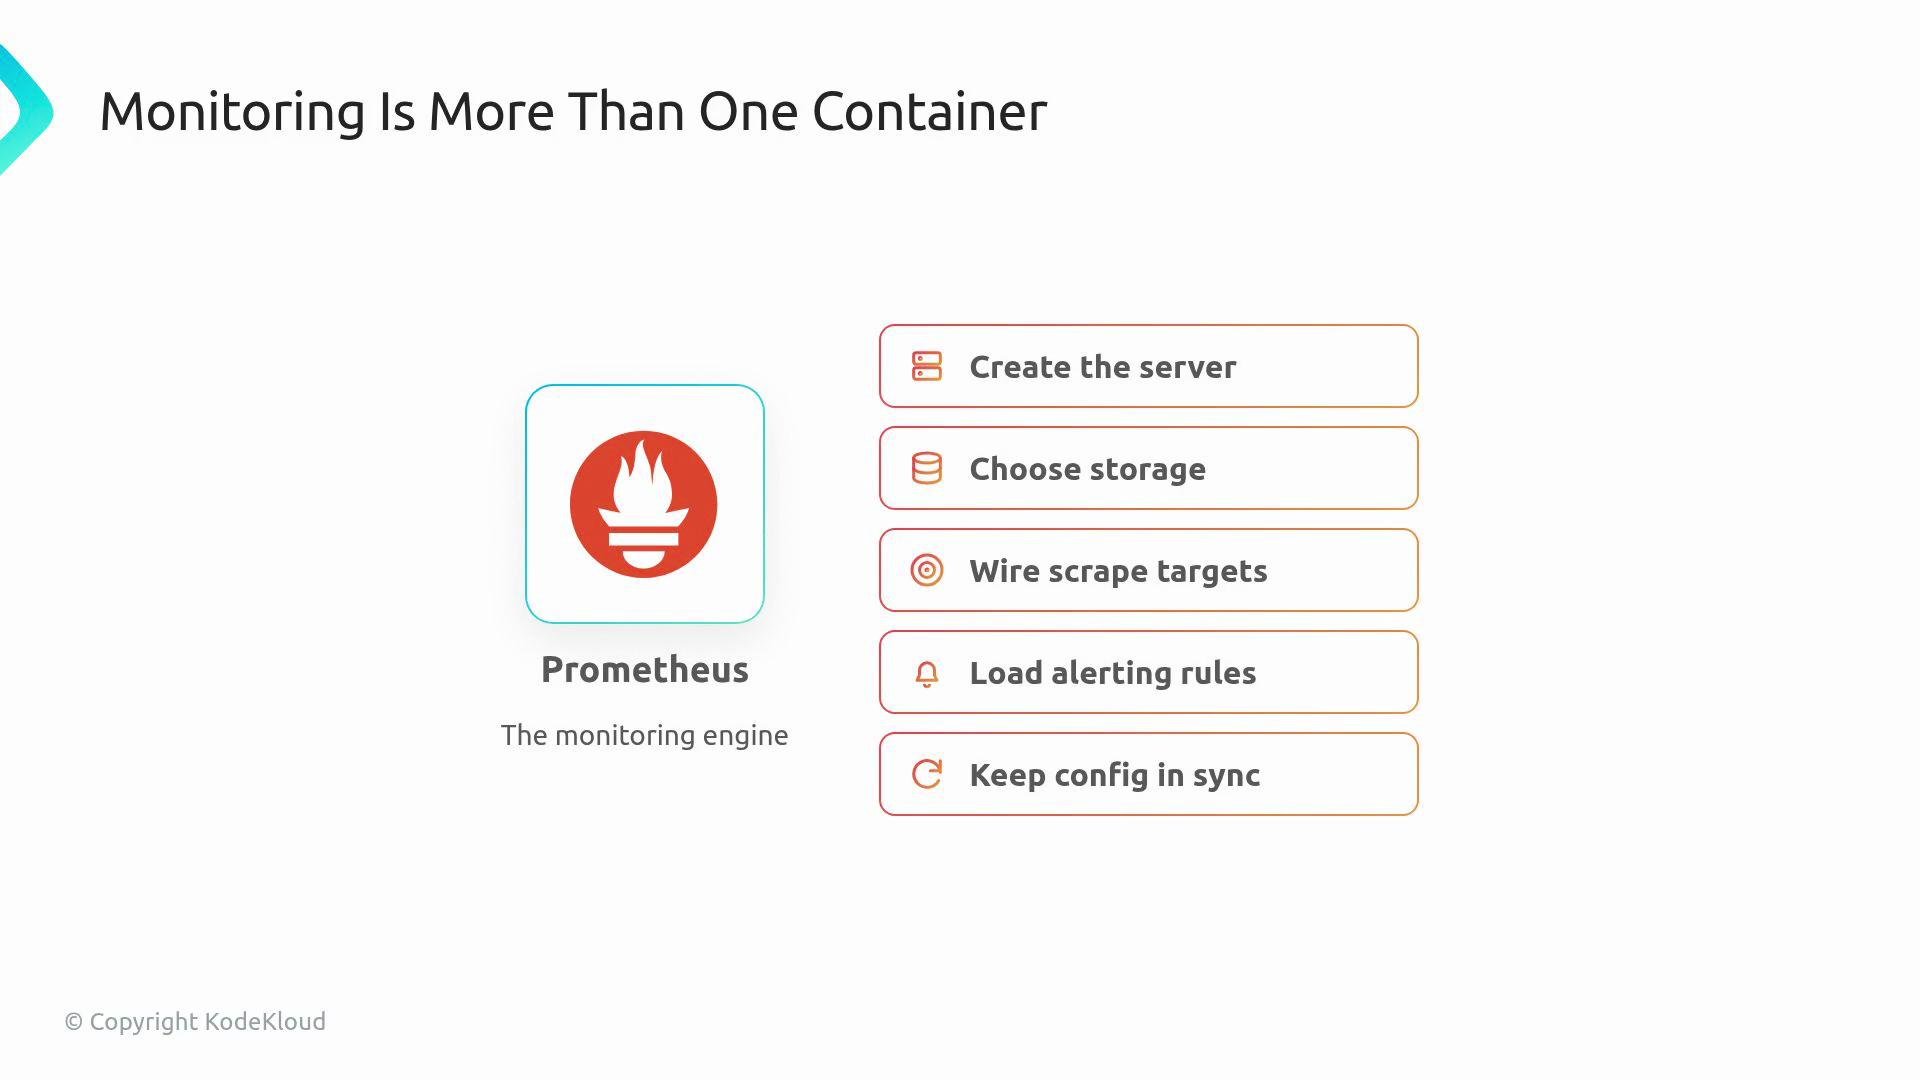
Prometheus is the de facto monitoring engine for collecting metrics and evaluating alerting rules in cloud-native environments. Running Prometheus effectively on Kubernetes requires more than a single container: you must provision the server, choose durable storage, wire up scrape targets, load recording and alerting rules, and keep configuration synchronized with cluster resources.
 The Prometheus Operator automates these operational tasks using Kubernetes-native, declarative resources and a controller that continuously reconciles the desired state into a running Prometheus instance.
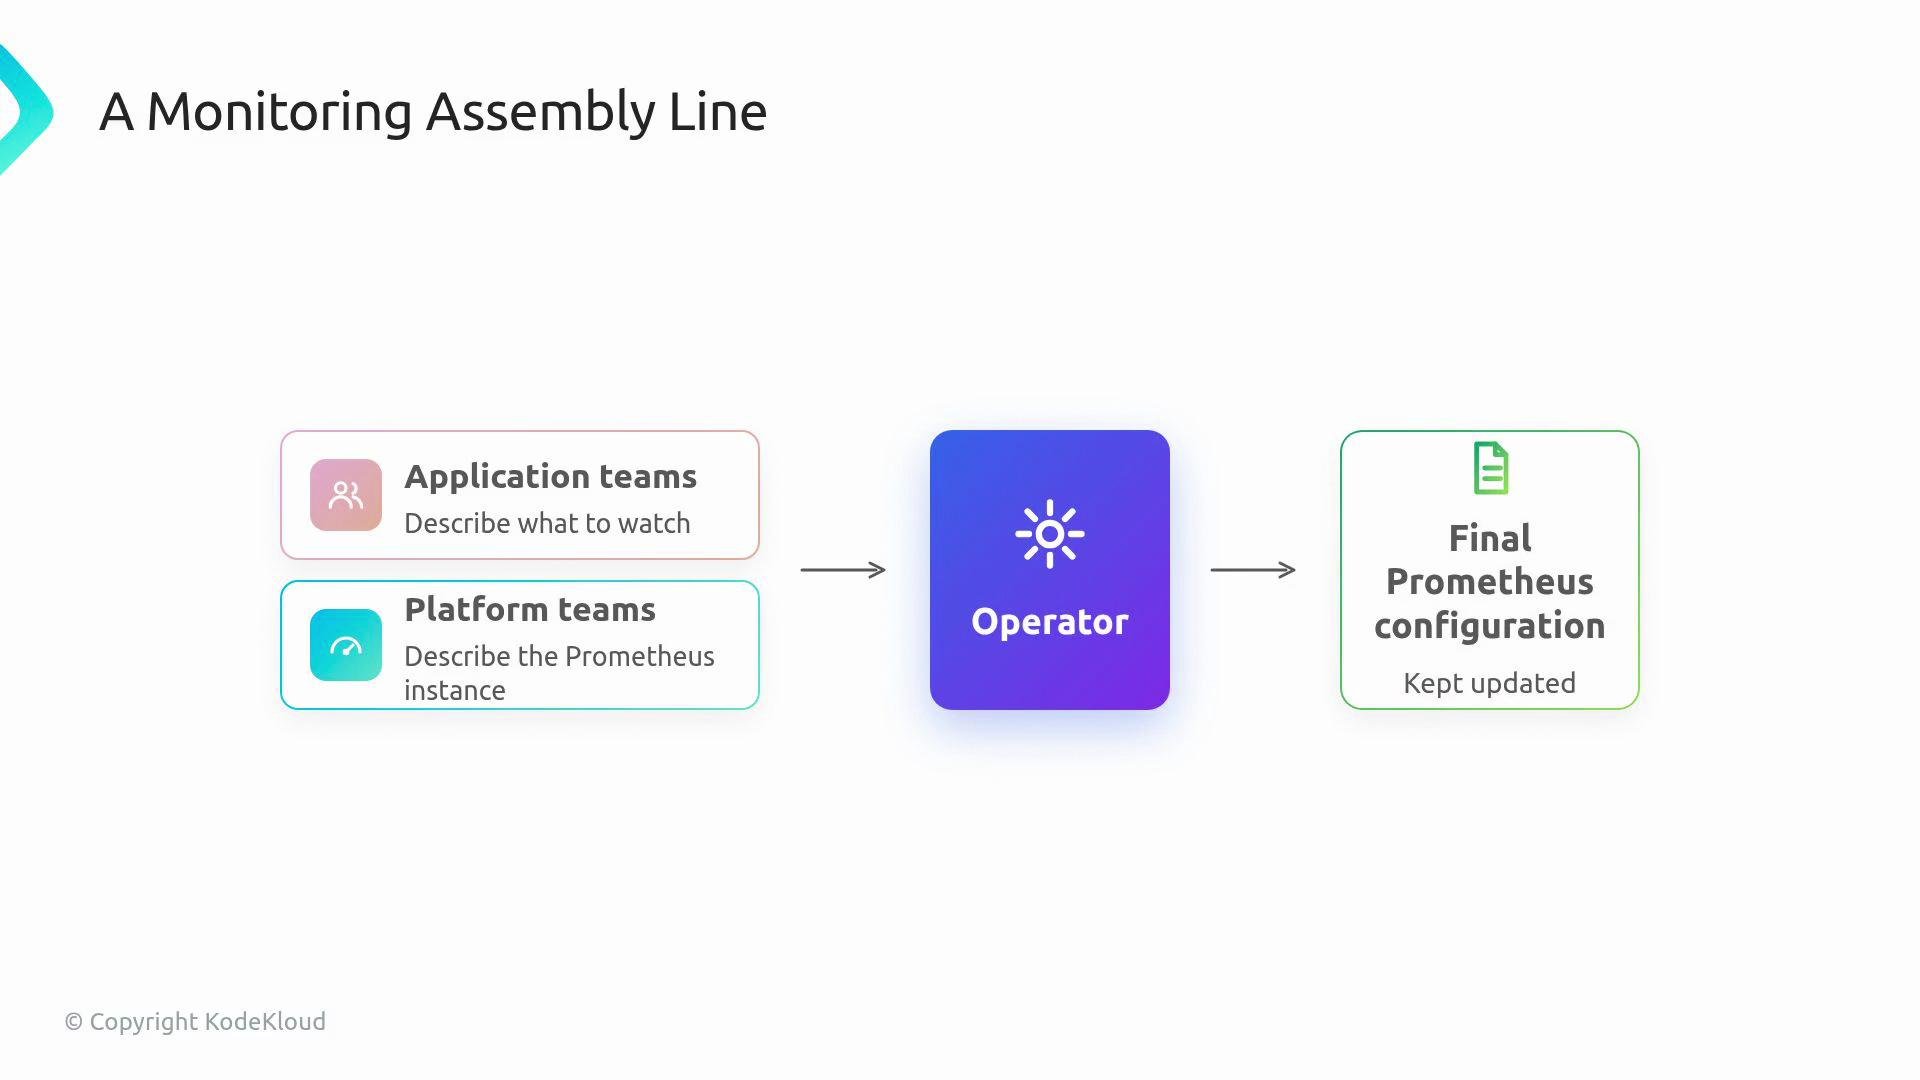 Conceptually, think of the operator as a monitoring assembly line:
* Application teams express what should be monitored (monitoring intent).
* Platform teams define Prometheus instances that will do the scraping and alerting.
* The operator composes those inputs into a final Prometheus runtime configuration (prometheus.yml, StatefulSets, Services, ConfigMaps, Secrets) and keeps them in sync.
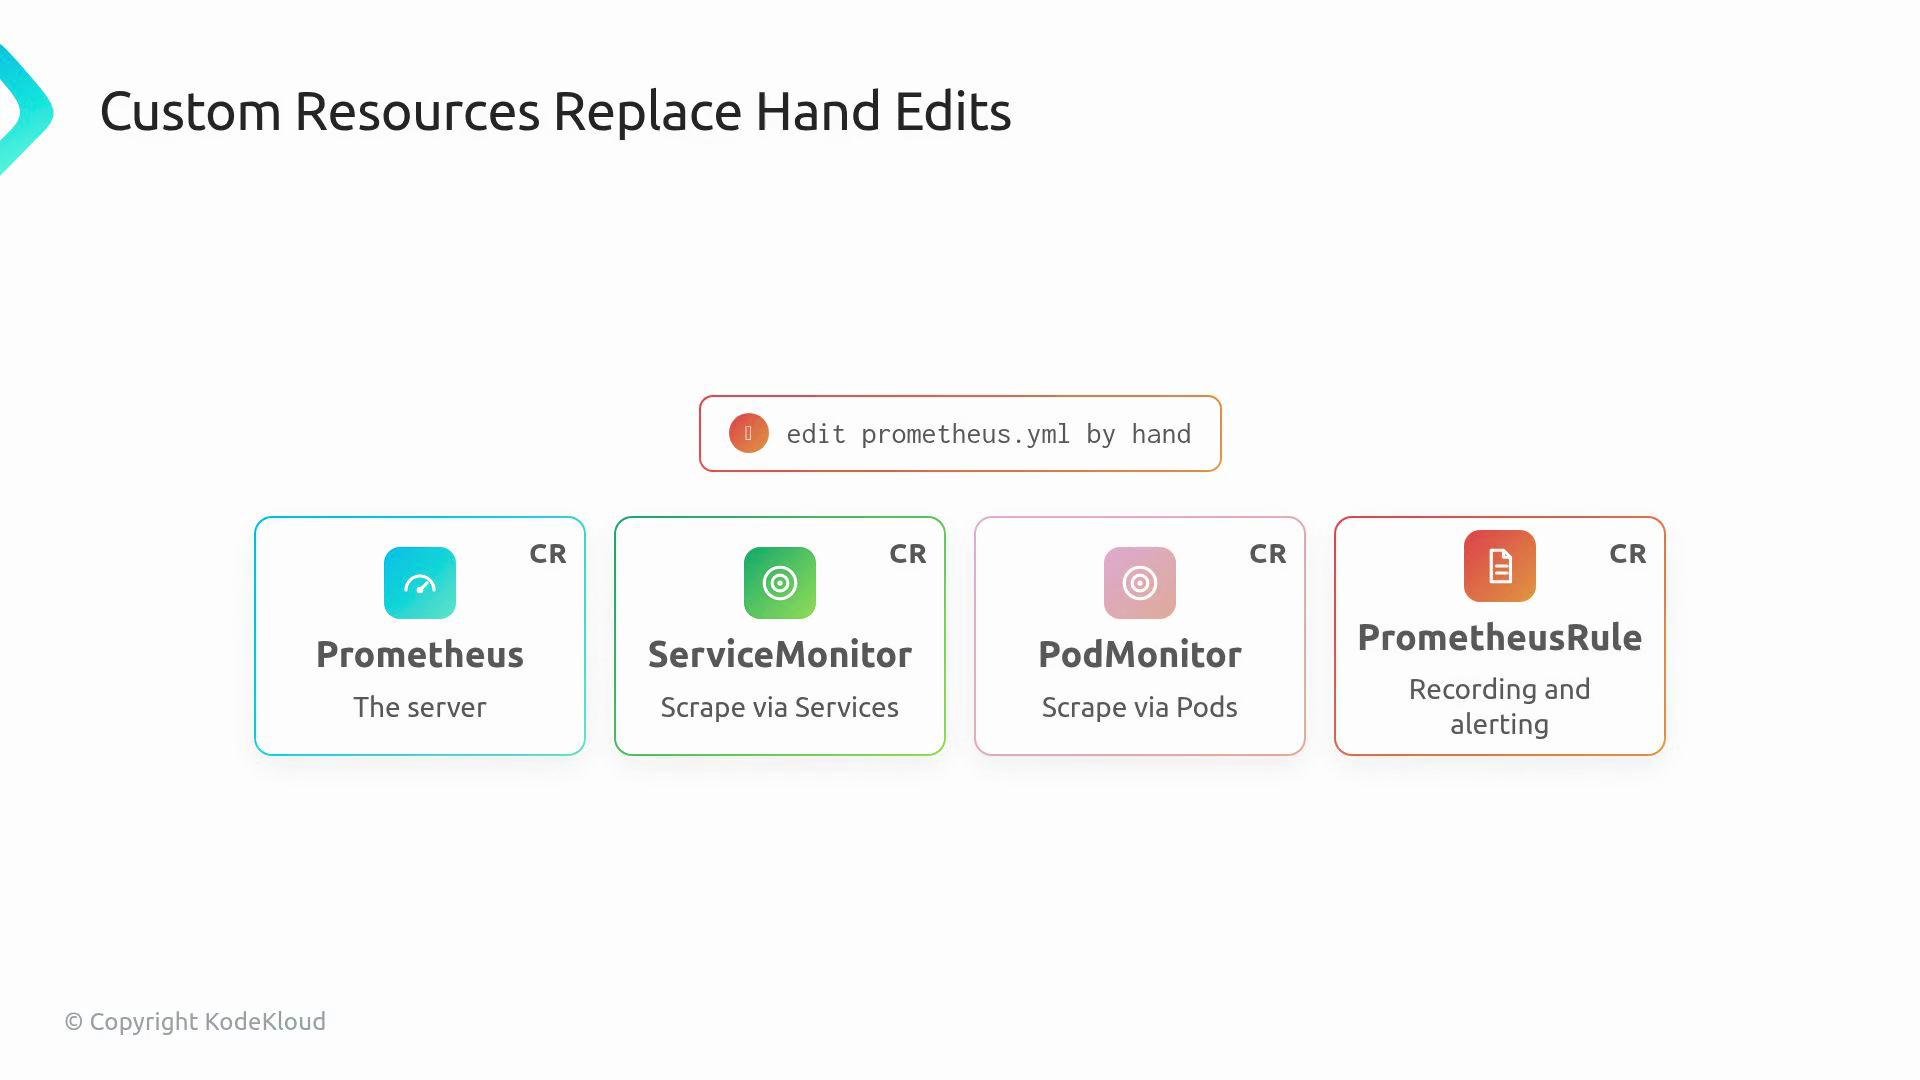
Instead of manually editing a central prometheus.yml, you work with custom resources (CRDs) such as Prometheus, ServiceMonitor, PodMonitor, and PrometheusRule. Each custom resource declares desired behavior and ownership; the controller implements that desired state by creating and updating the underlying Kubernetes objects.
Conceptually, think of the operator as a monitoring assembly line:
* Application teams express what should be monitored (monitoring intent).
* Platform teams define Prometheus instances that will do the scraping and alerting.
* The operator composes those inputs into a final Prometheus runtime configuration (prometheus.yml, StatefulSets, Services, ConfigMaps, Secrets) and keeps them in sync.
Instead of manually editing a central prometheus.yml, you work with custom resources (CRDs) such as Prometheus, ServiceMonitor, PodMonitor, and PrometheusRule. Each custom resource declares desired behavior and ownership; the controller implements that desired state by creating and updating the underlying Kubernetes objects.
 ## Key custom resources (CRDs)
| Resource | Purpose | Example / Notes |
| -------------- | ------------------------------------------------------------------------------------------------------------- | ------------------------------------------------------------------------------ |
| Prometheus | Describes a Prometheus server instance and drives creation of StatefulSet, Services, ConfigMaps, and Secrets. | Controls which monitors and rules are selected via selectors. |
| ServiceMonitor | Selects Services and tells Prometheus which endpoints to scrape. | Useful when metrics are exposed via Services. See example below. |
| PodMonitor | Selects Pods directly — ideal when applications expose metrics on pod endpoints instead of Service endpoints. | Alternative to ServiceMonitor for pod-level scraping. |
| PrometheusRule | Holds recording and alerting rules for Prometheus. | Recording rules precompute series; alerting rules send alerts to Alertmanager. |
## Example: ServiceMonitor
A ServiceMonitor lets application teams publish monitoring intent as Kubernetes objects. The operator discovers matching ServiceMonitors and includes them in the generated Prometheus configuration.
```yaml theme={null}
apiVersion: monitoring.coreos.com/v1
kind: ServiceMonitor
metadata:
name: api-service-monitor
spec:
selector:
matchLabels:
app: api
endpoints:
- port: metrics
path: /metrics
```
## Example: Prometheus resource with selectors
Platform teams use the Prometheus CR to define a Prometheus instance and scope which monitoring objects it ingests. Use label selectors to enforce clear ownership boundaries across teams.
```yaml theme={null}
apiVersion: monitoring.coreos.com/v1
kind: Prometheus
metadata:
name: payments-prometheus
spec:
serviceMonitorSelector:
matchLabels:
team: payments
ruleSelector:
matchLabels:
team: payments
```
A ServiceMonitor owned by the payments team would include the corresponding label:
```yaml theme={null}
apiVersion: monitoring.coreos.com/v1
kind: ServiceMonitor
metadata:
name: api-service-monitor
labels:
team: payments
spec:
selector:
matchLabels:
app: api
endpoints:
- port: metrics
path: /metrics
```
This label-selector pattern enables platform and application teams to collaborate without giving direct write access to a shared Prometheus config file. The operator composes those independent resources into a coherent Prometheus runtime configuration.
## How selectors and ownership work
A Prometheus resource uses selectors to determine which ServiceMonitors, PodMonitors, and PrometheusRules belong to it. This model supports multi-tenant or shared clusters by scoping ingestion to labeled resources:
* Platform teams create one or more Prometheus instances and configure selectors.
* Application teams label their ServiceMonitors/PodMonitors/PrometheusRules to indicate ownership.
* The operator discovers matching objects and includes them in the generated Prometheus configuration.
Use consistent label conventions (for example, `team: payments`) to make ownership and intent explicit across your organization.
## Operator responsibilities and reconciliation
The Prometheus Operator handles lifecycle details that are error-prone when done manually:
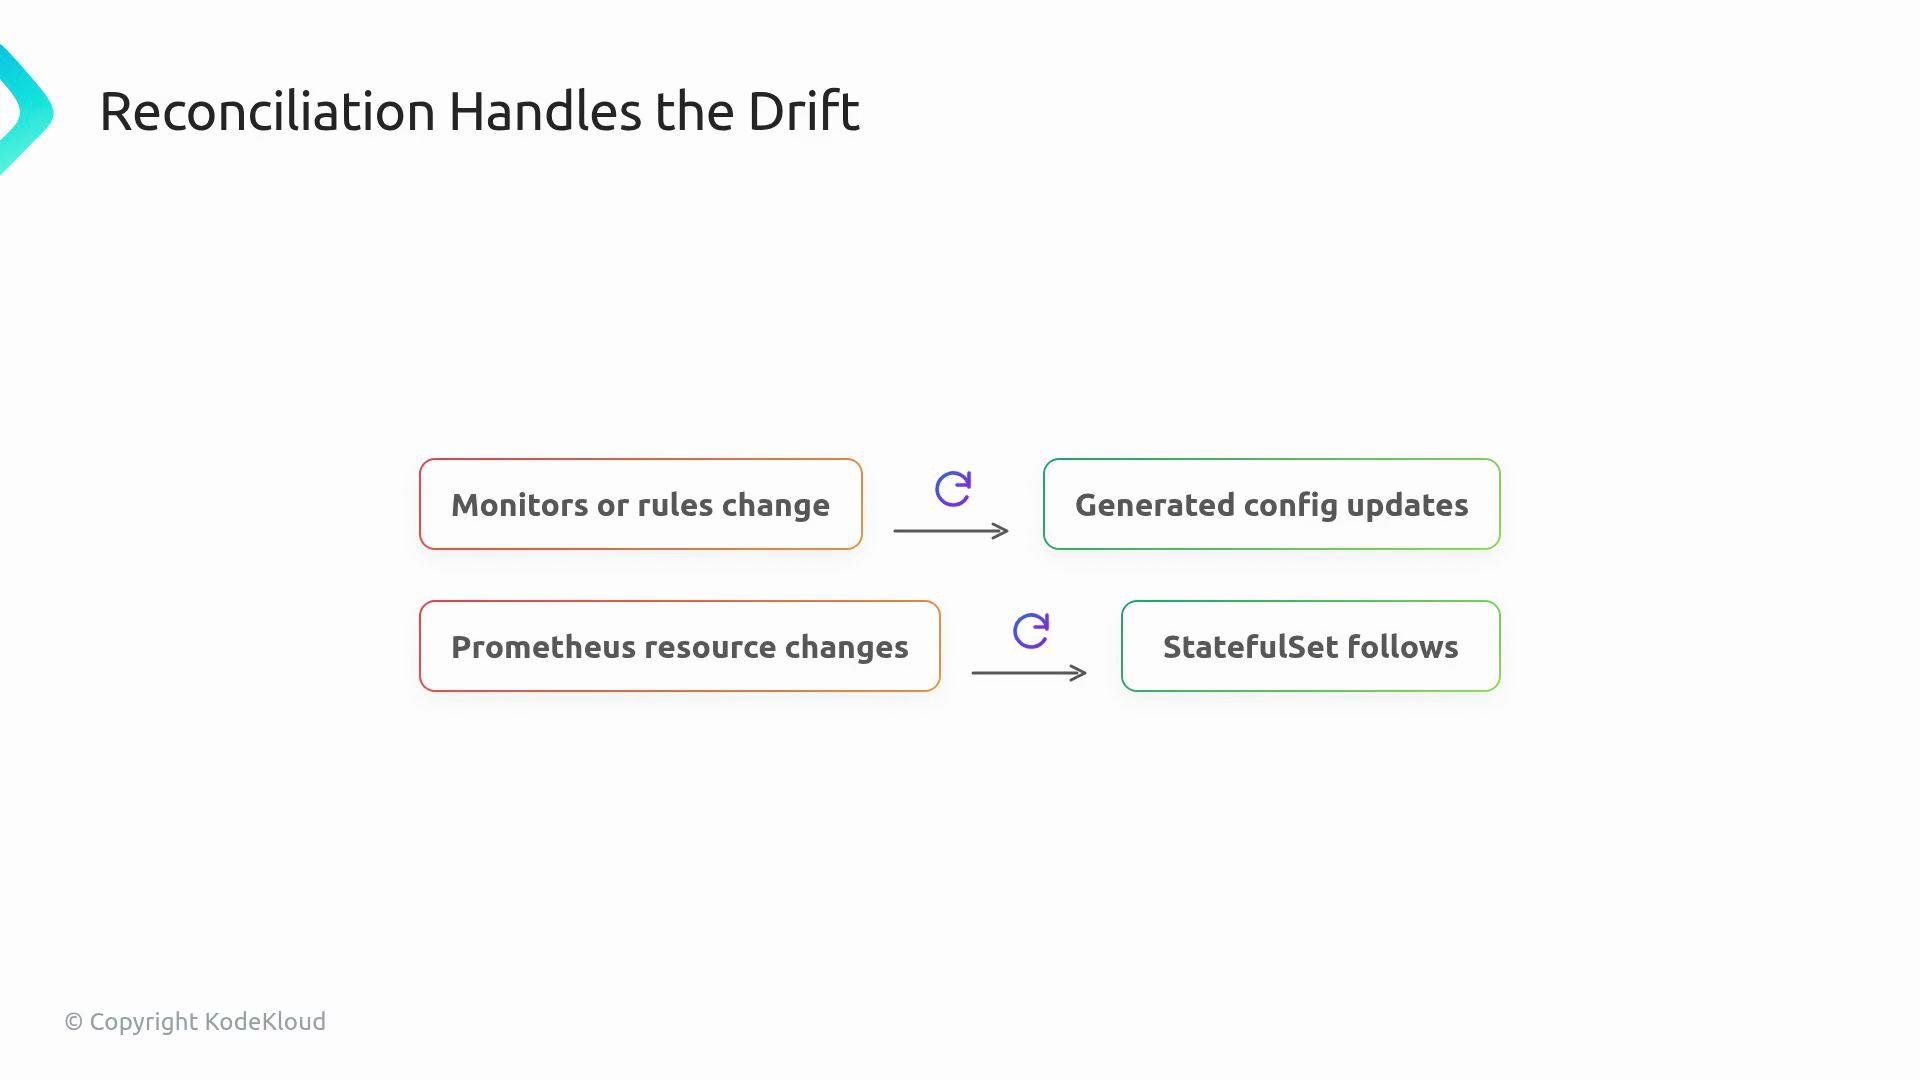
* When selected ServiceMonitors or PrometheusRules change, the operator regenerates the Prometheus configuration and triggers a reload.
* When the Prometheus custom resource changes, the operator updates the managed StatefulSet and related resources so the running server matches the desired state.
* The controller continuously reconciles discrepancies (drift) instead of relying on manual reloads or human memory.
## Key custom resources (CRDs)
| Resource | Purpose | Example / Notes |
| -------------- | ------------------------------------------------------------------------------------------------------------- | ------------------------------------------------------------------------------ |
| Prometheus | Describes a Prometheus server instance and drives creation of StatefulSet, Services, ConfigMaps, and Secrets. | Controls which monitors and rules are selected via selectors. |
| ServiceMonitor | Selects Services and tells Prometheus which endpoints to scrape. | Useful when metrics are exposed via Services. See example below. |
| PodMonitor | Selects Pods directly — ideal when applications expose metrics on pod endpoints instead of Service endpoints. | Alternative to ServiceMonitor for pod-level scraping. |
| PrometheusRule | Holds recording and alerting rules for Prometheus. | Recording rules precompute series; alerting rules send alerts to Alertmanager. |
## Example: ServiceMonitor
A ServiceMonitor lets application teams publish monitoring intent as Kubernetes objects. The operator discovers matching ServiceMonitors and includes them in the generated Prometheus configuration.
```yaml theme={null}
apiVersion: monitoring.coreos.com/v1
kind: ServiceMonitor
metadata:
name: api-service-monitor
spec:
selector:
matchLabels:
app: api
endpoints:
- port: metrics
path: /metrics
```
## Example: Prometheus resource with selectors
Platform teams use the Prometheus CR to define a Prometheus instance and scope which monitoring objects it ingests. Use label selectors to enforce clear ownership boundaries across teams.
```yaml theme={null}
apiVersion: monitoring.coreos.com/v1
kind: Prometheus
metadata:
name: payments-prometheus
spec:
serviceMonitorSelector:
matchLabels:
team: payments
ruleSelector:
matchLabels:
team: payments
```
A ServiceMonitor owned by the payments team would include the corresponding label:
```yaml theme={null}
apiVersion: monitoring.coreos.com/v1
kind: ServiceMonitor
metadata:
name: api-service-monitor
labels:
team: payments
spec:
selector:
matchLabels:
app: api
endpoints:
- port: metrics
path: /metrics
```
This label-selector pattern enables platform and application teams to collaborate without giving direct write access to a shared Prometheus config file. The operator composes those independent resources into a coherent Prometheus runtime configuration.
## How selectors and ownership work
A Prometheus resource uses selectors to determine which ServiceMonitors, PodMonitors, and PrometheusRules belong to it. This model supports multi-tenant or shared clusters by scoping ingestion to labeled resources:
* Platform teams create one or more Prometheus instances and configure selectors.
* Application teams label their ServiceMonitors/PodMonitors/PrometheusRules to indicate ownership.
* The operator discovers matching objects and includes them in the generated Prometheus configuration.
Use consistent label conventions (for example, `team: payments`) to make ownership and intent explicit across your organization.
## Operator responsibilities and reconciliation
The Prometheus Operator handles lifecycle details that are error-prone when done manually:
* When selected ServiceMonitors or PrometheusRules change, the operator regenerates the Prometheus configuration and triggers a reload.
* When the Prometheus custom resource changes, the operator updates the managed StatefulSet and related resources so the running server matches the desired state.
* The controller continuously reconciles discrepancies (drift) instead of relying on manual reloads or human memory.
 ## Deployment patterns and ecosystem
In production clusters, the Prometheus Operator is frequently installed as part of a broader monitoring stack (for example, using Helm charts) that includes:
* Prometheus servers
* Alertmanager
* Grafana
* Prometheus exporters
* Dashboards and default alerting rules
After installation, cluster resources (ServiceMonitors, PodMonitors, PrometheusRules) are the primary extension points teams use to customize monitoring behavior for their applications.
Selectors in the Prometheus resource control which monitoring objects a Prometheus instance will ingest. Use labels and selectors to enforce clear ownership boundaries in shared clusters.
## Links and references
* Prometheus Operator (GitHub): [https://github.com/prometheus-operator/prometheus-operator](https://github.com/prometheus-operator/prometheus-operator)
* Prometheus documentation: [https://prometheus.io/docs/introduction/overview/](https://prometheus.io/docs/introduction/overview/)
* Alertmanager: [https://prometheus.io/docs/alerting/latest/alertmanager/](https://prometheus.io/docs/alerting/latest/alertmanager/)
* Helm charts and packaging: [https://helm.sh/](https://helm.sh/)
* Kubernetes concepts (labels & selectors): [https://kubernetes.io/docs/concepts/overview/working-with-objects/labels/](https://kubernetes.io/docs/concepts/overview/working-with-objects/labels/)
You will deploy Prometheus through the operator, create a monitored target, and use a ServiceMonitor to connect it to the Prometheus instance.
## Deployment patterns and ecosystem
In production clusters, the Prometheus Operator is frequently installed as part of a broader monitoring stack (for example, using Helm charts) that includes:
* Prometheus servers
* Alertmanager
* Grafana
* Prometheus exporters
* Dashboards and default alerting rules
After installation, cluster resources (ServiceMonitors, PodMonitors, PrometheusRules) are the primary extension points teams use to customize monitoring behavior for their applications.
Selectors in the Prometheus resource control which monitoring objects a Prometheus instance will ingest. Use labels and selectors to enforce clear ownership boundaries in shared clusters.
## Links and references
* Prometheus Operator (GitHub): [https://github.com/prometheus-operator/prometheus-operator](https://github.com/prometheus-operator/prometheus-operator)
* Prometheus documentation: [https://prometheus.io/docs/introduction/overview/](https://prometheus.io/docs/introduction/overview/)
* Alertmanager: [https://prometheus.io/docs/alerting/latest/alertmanager/](https://prometheus.io/docs/alerting/latest/alertmanager/)
* Helm charts and packaging: [https://helm.sh/](https://helm.sh/)
* Kubernetes concepts (labels & selectors): [https://kubernetes.io/docs/concepts/overview/working-with-objects/labels/](https://kubernetes.io/docs/concepts/overview/working-with-objects/labels/)
You will deploy Prometheus through the operator, create a monitored target, and use a ServiceMonitor to connect it to the Prometheus instance.