Kubernetes Troubleshooting for Application Developers

Prerequisites

k9s Walkthrough

Hi everyone,

In this lesson, we’re diving into k9s—one of the most efficient tools for managing your Kubernetes clusters. k9s is a terminal-based UI that provides almost all the capabilities of kubectl, but with a polished, interactive interface and a variety of shortcuts to boost your productivity. If you prefer working in the terminal over a web-based console, k9s is an excellent choice.

The image shows a stylized dog face with Kubernetes logos as glasses, promoting "k9s," a Kubernetes CLI tool. The text includes a playful tagline, "Who Let The Pods Out?"

Think of k9s as an enhanced, visually engaging version of kubectl. Scroll down for OS-specific installation instructions and a collection of useful examples within the official documentation.

The image shows a webpage from k9scli.io featuring a section on documentation with links to installation, commands, customizations, benchmarking, RBAC, and tutorials.

Connecting to Your Cluster

Before you start, make sure your kubeconfig is set to the correct context. Launch k9s with the following command:

k9s

Once started, you’ll see several key sections on the screen:

  • Top Left: Displays cluster details such as context name, cluster name, Kubernetes version, and, if available, CPU/memory metrics.
  • Middle: Shows a list of namespaces, dynamically updating based on your usage.
  • Right: Lists available keyboard shortcuts corresponding to the selected resource (e.g., D for describe, Ctrl-D for delete, E for edit).

The image shows a terminal interface for managing Kubernetes pods, displaying details about a running "nginx" pod, including its status, CPU, memory usage, and node information. It also includes a list of keyboard shortcuts for various actions.

Tip

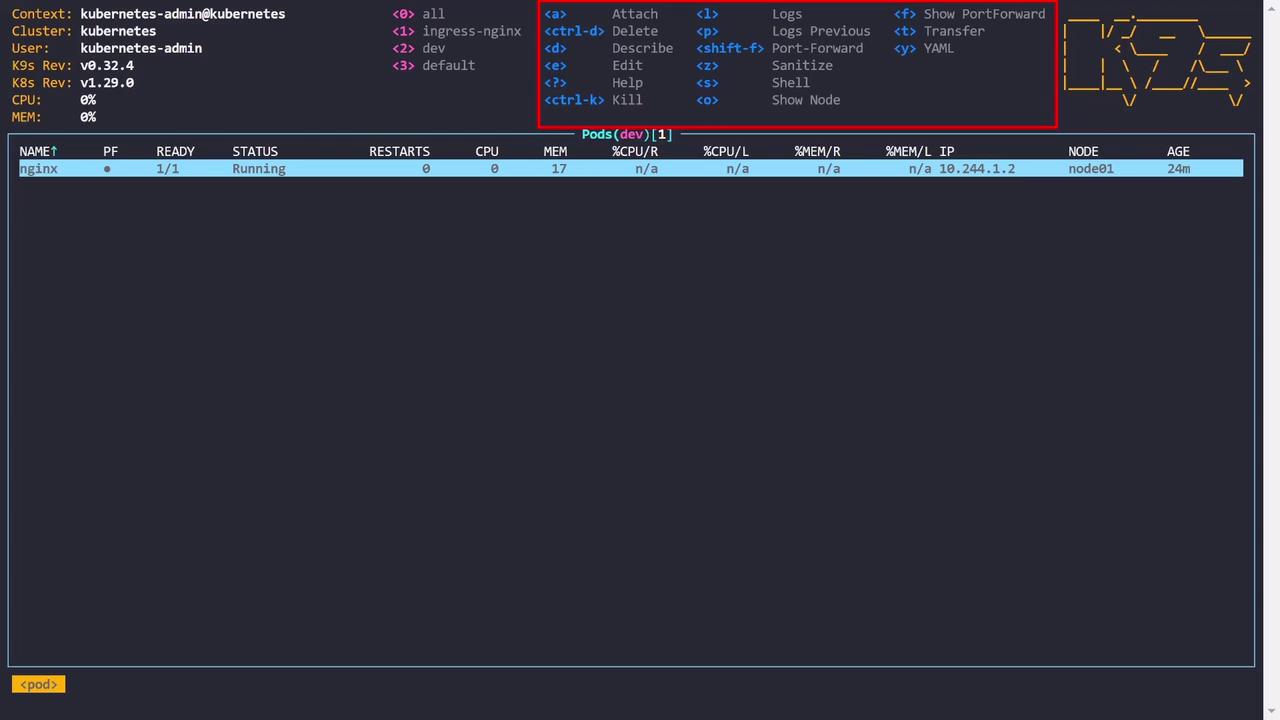
The navigation shortcuts in k9s resemble Vim/VI commands. If you’re not familiar with Vim, consider spending a few minutes learning its basic commands to enhance your k9s experience.

Viewing Pods Across All Namespaces

If activity in your current namespace (e.g., dev) seems light, press the numeral zero (0) to view pods across all namespaces.

Viewing Deployments

To inspect Deployments, press the colon (:) key, type "Deployment," and hit Enter. This will display all deployments across namespaces. For example:

Deployment (all) [20]
NAMESPACE               NAME                                        READY   UP-TO-DATE   AVAILABLE   AGE
ingress-nginx           ingress-nginx-controller                     1/1     1            1           22m
kube-system             cores DNS                                   2/2     1            1           22m
kube-system             metrics-server                              1/1     1            1           22m
kubernetes-dashboard    kubernetes-dashboard-api                    1/1     1            1           22m
kubernetes-dashboard    kubernetes-dashboard-auth                   1/1     1            1           22m
kubernetes-dashboard    kubernetes-dashboard-kong                   1/1     1            1           22m
kubernetes-dashboard    kubernetes-dashboard-metrics-scraper        1/1     1            1           22m
kubernetes-dashboard    kubernetes-dashboard-web                    1/1     1            1           22m
monitoring              grafana                                     1/1     1            1           22m
monitoring              prometheus-kube-state-metrics               1/1     1            1           22m
monitoring              prometheus-prometheus-pushgateway           1/1     1            1           22m
monitoring              prometheus-server                           0/1     1            0           22m
qa                      argo-cd-argocd-applicationset-controller     1/1     1            1           22m
qa                      argo-cd-argocd-dex-server                   1/1     1            1           22m
qa                      argo-cd-argocd-notifications-controller     1/1     1            1           22m
qa                      argo-cd-argocd-redis                        1/1     1            1           22m
qa                      argo-cd-argocd-repo-server                  1/1     1            1           22m
qa                      argo-cd-argocd-server                       1/1     1            1           22m
staging                 vault-agent-injector                        1/1     1            1           21m
uat                     notes-app-deployment                        2/2     1            2           22m

Viewing Services

To view services, press the colon (:) key and type "service" (or "svc"). This is equivalent to running kubectl get services -a. For example:

Namespaces           Name                                      Ready   Up-to-date   Available   Age
ingress-nginx        ingress-nginx-controller                  1/1     1            1           22m
kube-system          corends                                  2/2     2            2           72m
kube-system          metrics-server                           1/1     1            1           22m
kubernetes-dashboard kubernetes-dashboard-api                 1/1     1            1           22m
kubernetes-dashboard kubernetes-dashboard-auth                1/1     1            1           22m
kubernetes-dashboard kubernetes-dashboard-kong                1/1     1            1           22m
kubernetes-dashboard kubernetes-dashboard-metrics-scraper      1/1     1            1           22m
kubernetes-dashboard kubernetes-dashboard-web                 1/1     1            1           22m
monitoring           grafana                                  1/1     1            1           22m
monitoring           prometheus-kube-state-metrics             1/1     1            1           22m
monitoring           prometheus-prometheus-pushgateway         0/1     1            0           22m
monitoring           prometheus-server                         0/1     1            0           22m
qa                   argo-cd-argocdapplicationset-controller   1/1     1            1           22m
qa                   argo-cd-argocd-dex-server                  1/1     1            1           22m
qa                   argo-cd-argocd-notifications-controller    1/1     1            1           22m
qa                   argo-cd-argocd-redis                       1/1     1            1           22m
qa                   argo-cd-argocd-repo-server                 1/1     1            1           22m
qa                   argo-cd-argocd-server                      1/1     1            1           22m
qa                   vault-agent-injector                       1/1     1            1           22m
qa                   notes-app-deployment                       2/2     2            2           22m

You can also inspect custom resource definitions (CRDs) by typing their name (e.g., "applications" for an Argo application) at the prompt.

Exploring Pods and Logs

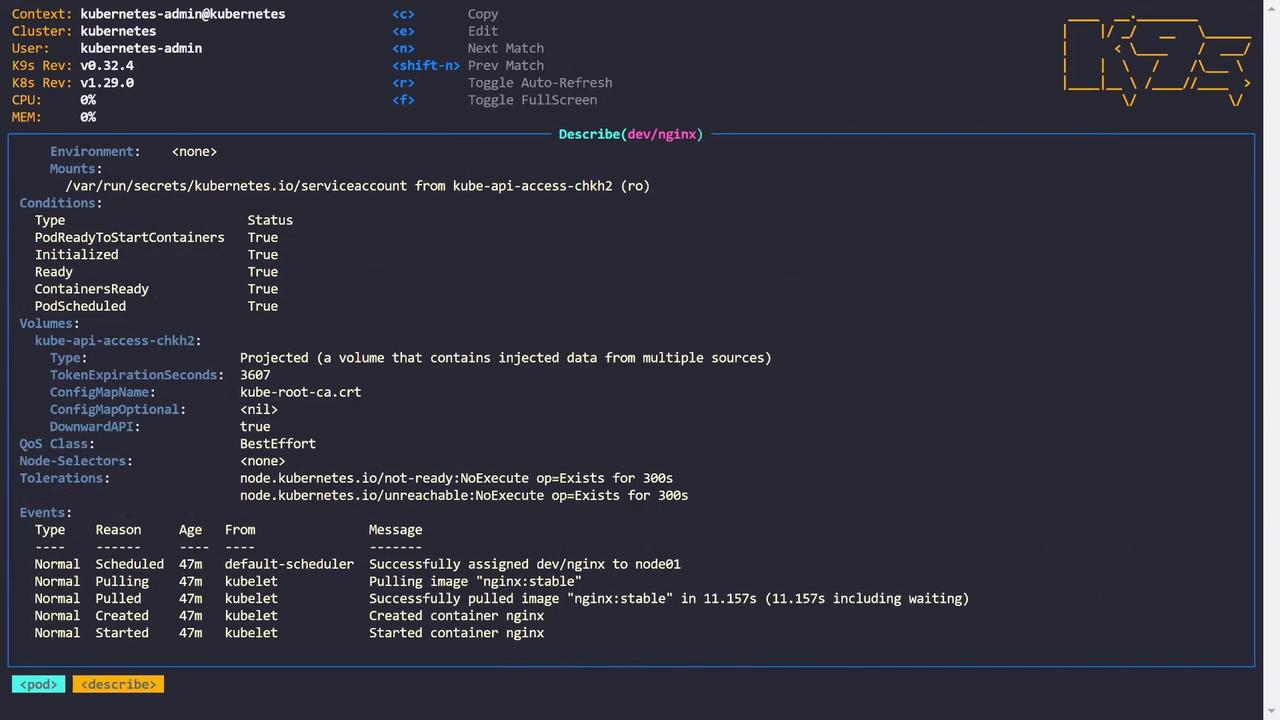
When you select a pod, the available key bindings change to actions specific to that resource. For example, press L to view the pod logs. In log view, these shortcuts become available:

  • S: Stop autoscrolling.
  • T: Toggle timestamps.
  • /: Search within the logs (e.g., search for "kube-system").
  • 2 or 3: Filter logs from the last minute or five minutes, respectively.
  • Escape: Exit the log view.

Press D to display detailed information about a resource (the equivalent of running kubectl describe). Additionally, pressing S can launch a shell within a container, simplifying command execution.

The image shows a terminal interface displaying Kubernetes pod details, including environment, conditions, volumes, and events related to the deployment of an Nginx container.

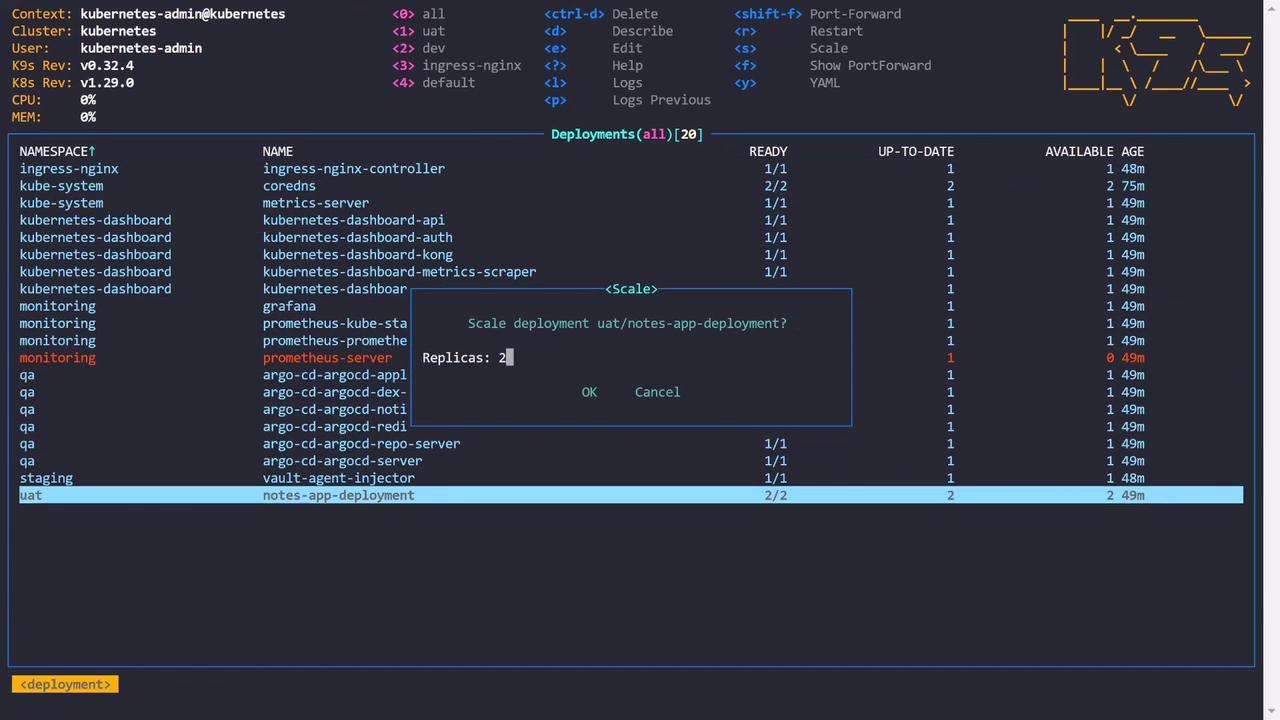
Editing and Scaling Deployments

Switch to deployments to access different shortcuts. Press E to open an editor and modify the configuration for a deployment. For instance:

apiVersion: apps/v1
kind: Deployment
metadata:
  annotations:
    deployment.kubernetes.io/revision: "1"
    kubectl.kubernetes.io/last-applied-configuration: |
      {"apiVersion":"apps/v1","kind":"Deployment","metadata":{"annotations":{},"labels":{"app.kubernetes.io/component":"controller","app.kubernetes.io/instance":"ingress-nginx","app.kubernetes.io/name":"ingress-nginx","app.kubernetes.io/version":"1.1.3"},"name":"ingress-nginx-controller","namespace":"ingress-nginx"},"spec":{"minReadySeconds":0,"revisionHistoryLimit":10,"selector":{"matchLabels":{"app.kubernetes.io/component":"controller","app.kubernetes.io/instance":"ingress-nginx"}},"template":{"metadata":{"labels":{"app.kubernetes.io/component":"controller","app.kubernetes.io/instance":"ingress-nginx","app.kubernetes.io/name":"ingress-nginx"}},"spec":{"containers":[{"args":["/nginx-ingress-controller","--election-id=ingress-controller-leader","--controller-class=k8s.io/ingress-nginx","--ingress-class=nginx","--configmap=$(POD_NAMESPACE)/ingress-nginx-controller","--validating-webhook-port=8443","--validating-webhook-certificate=/usr/local/certificates/key"],"env":[{"name":"POD_NAME","valueFrom":{"fieldRef":{"fieldPath":"metadata.name"}}}],"image":"k8s.gcr.io/ingress-nginx/controller:v1.1.3@sha256:31f47c1202b39dfe822ab76370bdb4ade199a00b37e4d14554f4d3fe2","imagePullPolicy":"IfNotPresent","lifecycle":{"preStop":{"exec":{"command":"/wait-shutdown"}}},"livenessProbe":{"failureThreshold":5,"httpGet":{"path":"/healthz","port":10254,"scheme":"HTTP"},"initialDelaySeconds":10,"successThreshold":1},"name":"controller","ports":[{"containerPort":80,"name":"http","protocol":"TCP"},{"containerPort":443,"name":"webhook","protocol":"TCP","readinessProbe":{"failureThreshold":3,"httpGet":{"path":"/healthz","port":10254,"scheme":"HTTP"},"initialDelaySeconds":10,"periodSeconds":10,"successThreshold":1},"resources":{"requests":{"memory":"100Mi"},"limits":{"memory":"90Mi"},"securityContext":{"allowPrivilegeEscalation":true},"capabilities":{"add":["NET_BIND_SERVICE"],"drop":["ALL"],"runAsUser":101},"volumeMounts":[{"mountPath":"/usr/local/certificates","name":"webhook-cert","readOnly":true}]},"dnsPolicy":"ClusterFirst","nodeSelector":{"kubernetes.io/os":"linux"},"serviceAccountName":"ingress-nginx","terminationGracePeriodSeconds":300,"volumes":[{"name":"webhook-cert","secret":{"secretName":"ingress-nginx-admission"}}]}}}
  creationTimestamp: "2024-06-01T16:23:14Z"
  generation: 1
  labels:
    app.kubernetes.io/component: controller
    app.kubernetes.io/instance: ingress-nginx
    app.kubernetes.io/name: ingress-nginx
    app.kubernetes.io/version: 1.1.3
spec:
  progressDeadlineSeconds: 600
  replicas: 1

Editor Customization

By default, k9s uses Vim as its editor, but you can configure it to use Nano or another editor of your choice.

Deployments also provide shortcuts for actions like restarting (R) and scaling, allowing you to adjust the number of replicas and see changes in real time.

The image shows a Kubernetes dashboard interface displaying various deployments and their statuses, with a pop-up window for scaling a specific deployment.

Additionally, port-forwarding is available when needed for troubleshooting.

Managing Services and Sorting

When viewing services, k9s offers sorting options to help you quickly locate the desired resource. For example, press Shift+A to sort services by age, and press the same key again to reverse the order. Similarly, press Shift+N to sort services by name.
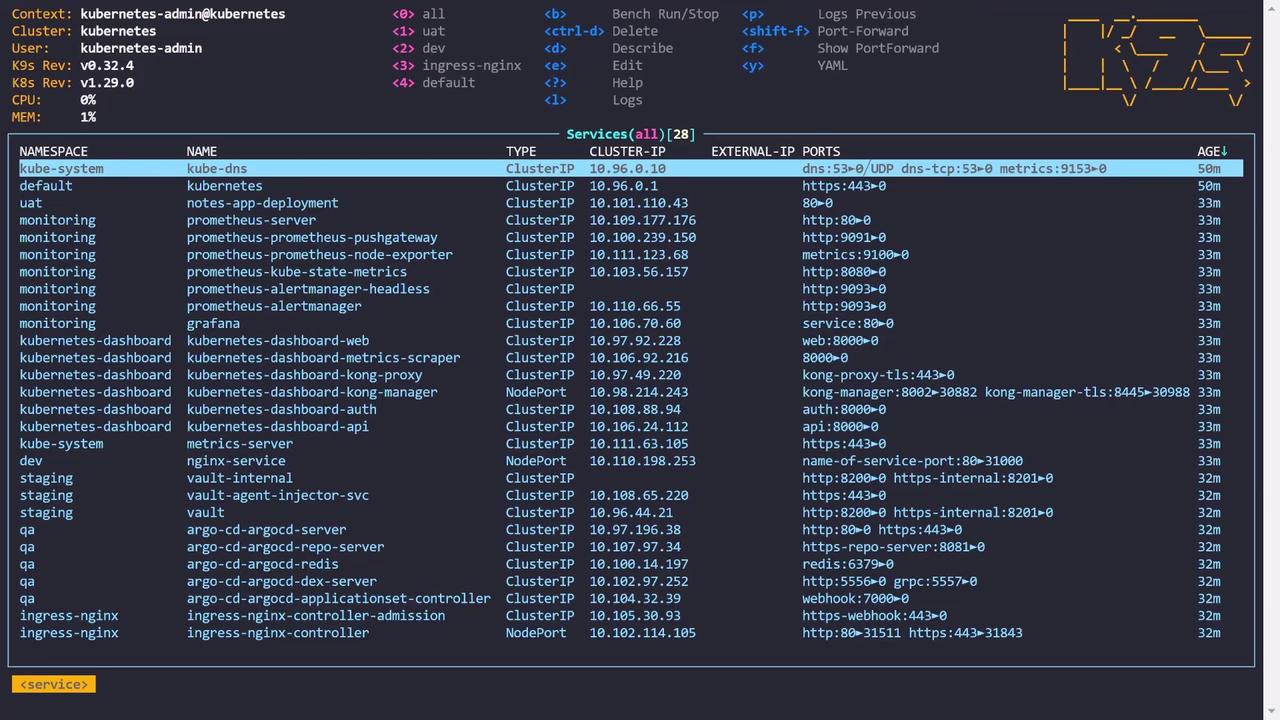
The image shows a terminal interface displaying Kubernetes services, including details like namespace, name, type, cluster IP, ports, and age. It includes a list of services with their respective configurations and status.

Another handy shortcut is Control+A, which displays all resource kinds available. You can then type a resource name—such as "deployments"—to quickly filter and review them. An example output for deployments might look like:

Deployments (all) 20
NAMESPACE                NAME                                   READY  UP-TO-DATE  AVAILABLE  AGE
ingress-nginx           ingress-nginx-controller                 1/1    1           1          33m
kube-system             coreDNS                                  2/2    1           1          33m
kube-system             metrics-server                           1/1    1           1          34m
kubernetes-dashboard    kubernetes-dashboard-api                 1/1    1           1          34m
kubernetes-dashboard    kubernetes-dashboard-auth                1/1    1           1          34m
kubernetes-dashboard    kubernetes-dashboard-kong                1/1    1           1          34m
kubernetes-dashboard    kubernetes-dashboard-metrics-scraper     1/1    1           1          34m
kubernetes-dashboard    kubernetes-dashboard-web                  1/1    1           1          34m
monitoring              grafana                                  1/1    1           1          33m
monitoring              prometheus-kube-state-metrics           1/1    1           1          33m
monitoring              prometheus-prometheus-pushgateway       1/1    1           1          33m
monitoring              prometheus-server                        0/1    1           0          33m
qa                      argo-cd-argocd-applicationset-controller 1/1    1           1          33m
qa                      argo-cd-argocd-dex-server                1/1    1           1          33m
qa                      argo-cd-argocd-notifications-controller   1/1    1           1          33m
qa                      argo-cd-argocd-redis                     1/1    1           1          33m
qa                      argo-cd-argocd-repo-server               1/1    1           1          33m
qa                      argo-cd-argocd-server                    1/1    1           1          33m
qa                      vault-agent-injector                     1/1    1           1          33m
staging                 notes-app-deployment                     2/2    2           2          34m

Visualizing RBAC

k9s also provides a unique perspective on role-based access control (RBAC). By inspecting resources like role bindings, you can view detailed permission visualizations. These visualizations illustrate which actions (e.g., get, list, watch, create, update) are permitted on resources like ConfigMaps and highlight any restrictions (e.g., patch, delete).

The image shows a terminal interface displaying Kubernetes role-based access control (RBAC) permissions for various resources, with checkmarks and crosses indicating allowed and disallowed actions.

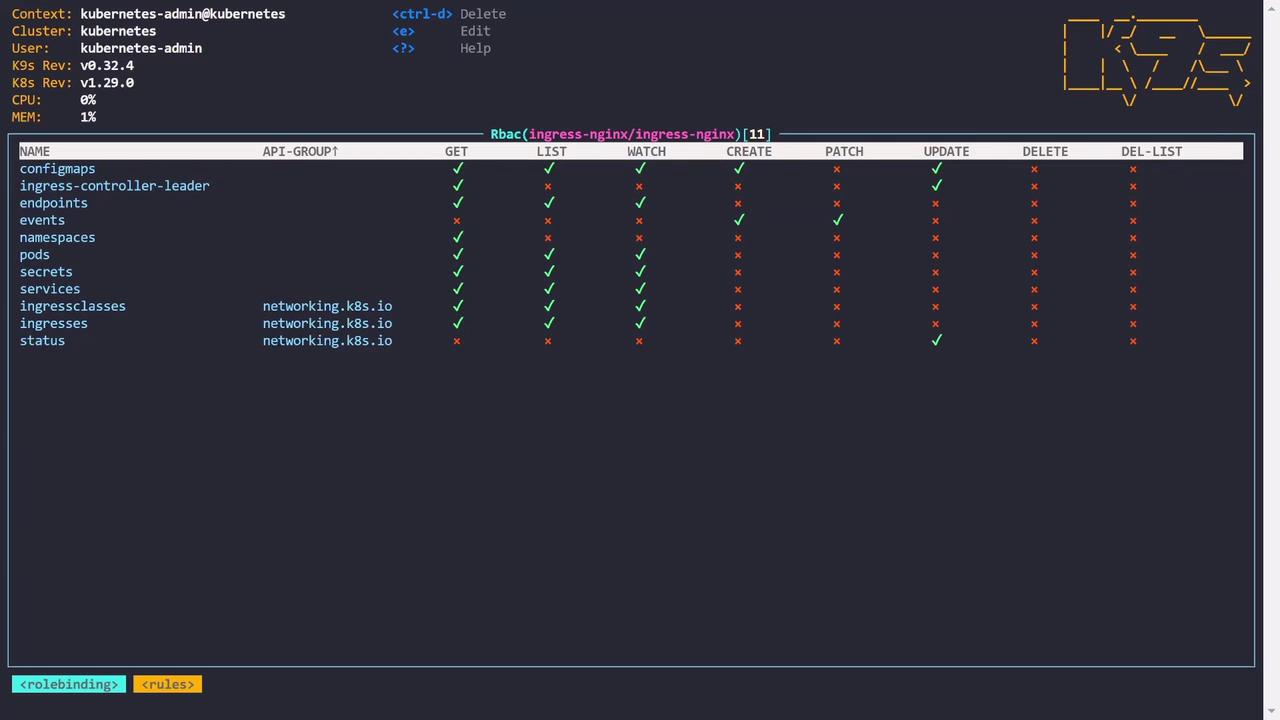
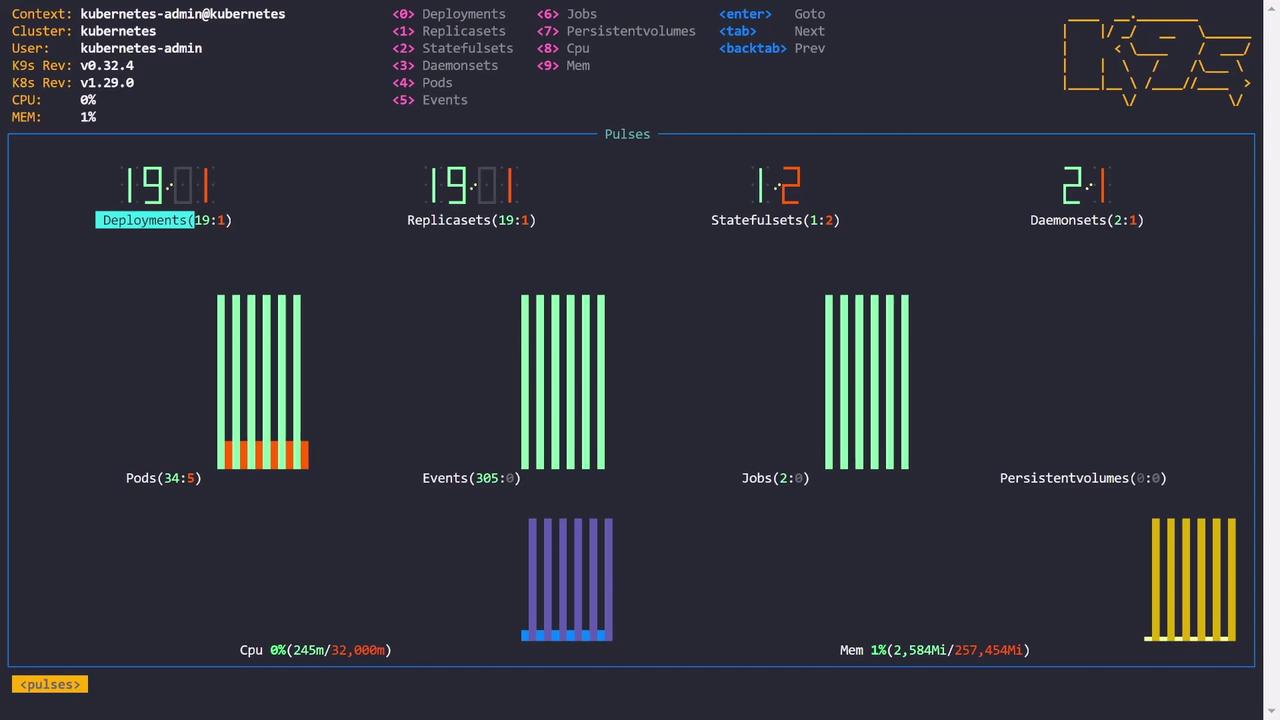
Custom Dashboards and Resource Overviews

k9s includes several dashboards to provide a comprehensive overview of your Kubernetes environment:

  • Deployments Dashboard: View summaries (e.g., 20 deployments with 19 ready and one pending).
  • Pods Dashboard: Check real-time statistics (e.g., 39 pods with 34 ready and 5 facing issues).
  • Metrics Dashboard: Access real-time CPU and memory metrics if a metrics server is installed.
  • X-Ray Dashboard: Dive deep into resource relationships, such as the connections between deployments, pods, containers, namespaces, and service accounts.

The image shows a Kubernetes dashboard displaying various metrics such as deployments, replicasets, statefulsets, and resource usage (CPU and memory) with visual bar graphs.

Final Thoughts

This lesson provided an overview of k9s, highlighting its intuitive navigation shortcuts and powerful features for:

  • Viewing logs and detailed resource descriptions.
  • Editing configurations and scaling deployments.
  • Exploring RBAC permissions with clear visualizations.
  • Managing services, sorting resources, and using custom dashboards.

With added customizations such as setting your preferred editor or defining aliases, k9s can significantly streamline your Kubernetes operations.

To exit k9s, simply press q:

controlplane ~ ➜ k9s

See you in the next lesson!

Watch Video

Watch video content

Previous
Kubernetes EphemeralDebug Containers