This article explores common Kubernetes issues causing pods to remain in a pending state and provides actionable solutions for each scenario.
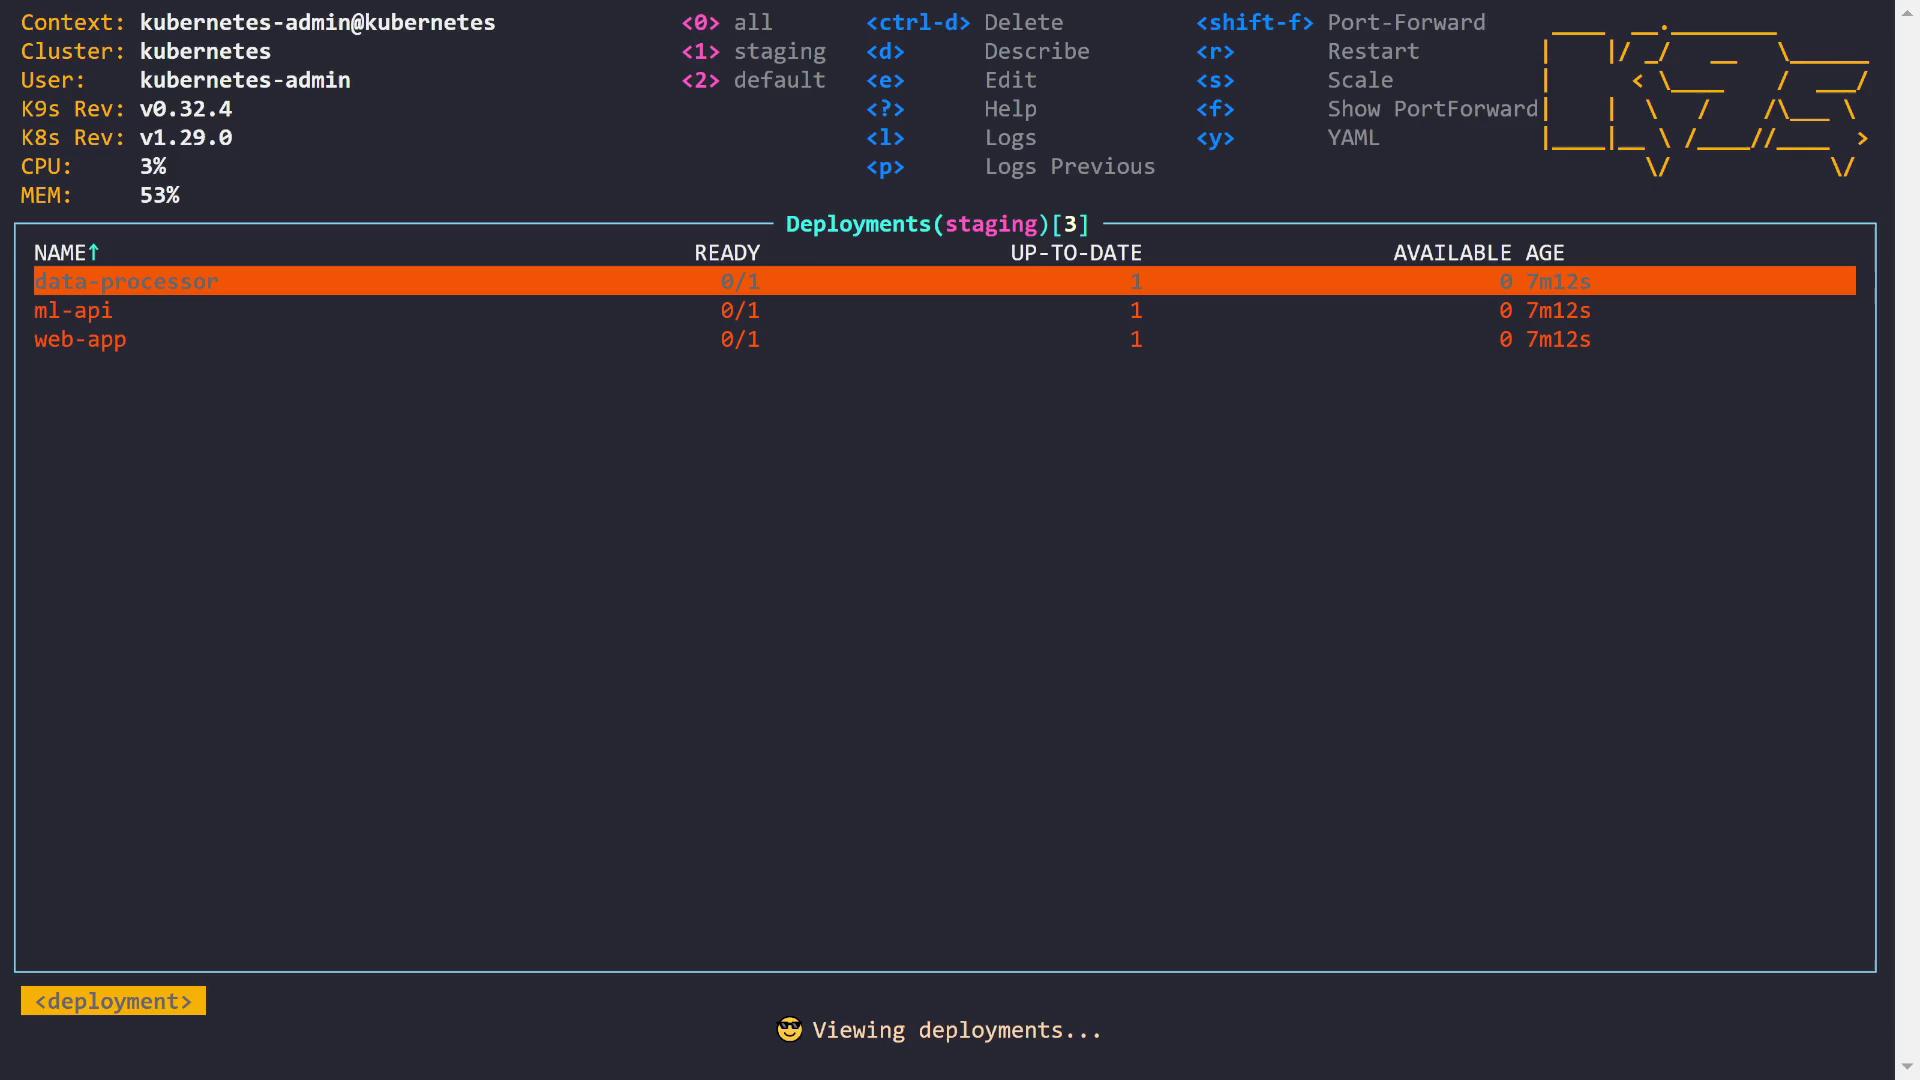
In this lesson, we explore a common Kubernetes issue—pods remaining in the pending state. This guide covers three scenarios that cause pods to get stuck during scheduling and provides actionable solutions.When a pod is in the pending state, Kubernetes has received the request to run it, but no available node meets the pod’s scheduling requirements. Let’s start by checking the pods in our cluster. As seen below, three pods are currently pending:
Below, we examine three examples that highlight different causes for pending pods.
The first scenario involves the data processor pod. Running the describe command reveals that our cluster has two nodes. The scheduler indicates failures due to insufficient CPU on one node and an untolerated taint on the control plane node. The output is as follows:
Describe(staging/data-processor-64596d6fbfb-b7csp)Environment: <none>Mounts: /var/run/secrets/kubernetes.io/serviceaccount from kube-api-access-htgcx (ro)Conditions: Type Status PodScheduled FalseVolumes: kube-api-access-htgcx: Type: Projected (a volume that contains injected data from multiple sources) TokenExpirationSeconds: 3607 ConfigMapName: kube-root-ca.crt ConfigMapOptional: <nil> DownwardAPI: trueQoS Class: BurstableNode-Selectors: <none>Tolerations: node.kubernetes.io/not-ready:NoExecute op=Exists for 300s node.kubernetes.io/unreachable:NoExecute op=Exists for 300s workload-machine-learning:NoScheduleEvents: Type Reason Age From Message ------ ----- --- ---- ------- Warning FailedScheduling 27s (x2 over 5m49s) default-scheduler 0/2 nodes are available: 1 Insufficient cpu, 1 node(s) had untolerated taint {node-role.kubernetes.io/control-plane: }. preemption: 0/2 nodes are available: 1 No preemption victims found for incoming pod, 1 Preemption is not helpful for scheduling.
The event logs indicate that the first node flagged “Insufficient cpu”. To understand this, we inspect the pod’s CPU requests:
Describe(staging/data-processor-64596d6fbfb-b7csp)Environment: <none>Mounts: /var/run/secrets/kubernetes.io/serviceaccount from kube-api-access-htgxc (ro)Conditions: Type Status PodScheduled FalseVolumes: kube-api-access-htgxc: Type: Projected (a volume that contains injected data from multiple sources) TokenExpirationSeconds: 3607 ConfigMapName: kube-root-ca.crt ConfigMapOptional: <nil> DownwardAPI: trueQoS Class: BurstableNode-Selectors: <none>Tolerations: node.kubernetes.io/not-ready:NoExecute op=Exists for 300s node.kubernetes.io/unreachable:NoExecute op=Exists for 300s workload=machine-learning:NoScheduleEvents: Type Reason Age From Message ---- ------ ---- ---- ------- Warning FailedScheduling 27s (x2 over 5m49s) default-scheduler 0/2 nodes are available: 1 Insufficient cpu, 1 node(s) had untolerated taint {node-role.kubernetes.io/control-plane: }. preemption: 0/2 nodes are available: 1 No preemption victims found for incoming pod, 1 Preemption is not helpful for scheduling.
The pod requires two CPUs. However, the node (ignoring the control plane) has a total of two CPUs and is already running three pods, leaving no capacity to satisfy the new request:
Describe(staging/data-processor-6459d6fbfb-b7csp)Port: <none>Host Port: <none>Limits: cpu: 2Requests: cpu: 2Environment: <none>Mounts: /var/run/secrets/kubernetes.io/serviceaccount from kube-api-access-htgcx (ro)Conditions: Type Status PodScheduled FalseVolumes: kube-api-access-htgcx: Type: Projected (a volume that contains injected data from multiple sources) TokenExpirationSeconds: 3607 ConfigMapName: kube-root-ca.crt ConfigMapOptional: <nil> DownwardAPI: trueQoS Class: BurstableNode-Selectors: <none>Tolerations: node.kubernetes.io/not-ready:NoExecute op=Exists for 300s
To resolve the issue, you can reduce the CPU request (for example, from “2” to “1”) so that the pod fits into the available node capacity.
The pod specification defines both CPU requests and limits as shown below:
Here is the YAML snippet for the data processor deployment:
The Kubernetes scheduler only considers the CPU requests, not the limits. If a node has sufficient free resources based on requests, the pod is scheduled; otherwise, it remains pending. After updating the CPU request, the pod transitions from pending to running. If your workload truly demands the original allocation, consider scaling your cluster by adding a new node.
The second example focuses on the ML API pod. The scheduler logs indicate that one node did not meet the pod’s node affinity and that the control plane node carries an untolerated taint:
Context: kubernetes-admin@kubernetesCluster: kubernetesUser: kubernetes-adminK9S Rev: v0.32.4K8S Rev: v1.29.0CPU: 3%MEM: 53%Describe(staging/ml-api-6b9bb6c9f4-n2rbm)Environment: <none>Mounts: /var/run/secrets/kubernetes.io/serviceaccount from kube-api-access-4wb5b (ro)Conditions: Type Status PodScheduled FalseVolumes: kube-api-access-4wb5b: Type: Projected (a volume that contains injected data from multiple sources) TokenExpirationSeconds: 3607 ConfigMapName: kube-root-ca.crt ConfigMapOptional: <nil> DownwardAPI: trueQoS Class: BestEffortNode-Selectors: type: gpuTolerations: node.kubernetes.io/not-ready:NoExecute op=Exists for 300s node.kubernetes.io/unreachable:NoExecute op=Exists for 300s workload-machine-learning:NoScheduleEvents: Type Reason Age Message ---- ------ --- ------- Warning FailedScheduling 3m55s (x2 over 9m17s) default-scheduler 0/2 nodes are available: 1 node(s) didn't match Pod's node affinity /selector, 1 node(s) had untolerated taint {node-role.kubernetes.io/control-plane: }. preemption: 0/2 nodes are available: 2 Preemption is not helpful for scheduling.
The pod specifies a node selector with the label “type=gpu”, but none of the nodes have this label. To confirm, running:
kubectl describe pod staging/ml-api-6b9bb6c9f4-n2rbm
shows that the pod requires a node with “type: gpu”. The solution is to label the appropriate node:
kubectl label nodes node01 type=gpu
After adding the label, the ML API pod moves to the ContainerCreating state, indicating that it has been successfully scheduled.
The final scenario involves the web app pod, which remains pending due to untolerated taints related to the control plane and a taint from “workload: machine-learning”. The pod description highlights this condition:
A closer look at the pod details confirms the absence of a toleration for the key “workload” with value “machine-learning”:
Describe(staging/web-app-564cb8d898-d521w)Host Port: 0/TCPEnvironment: <none>Mounts: /var/run/secrets/kubernetes.io/serviceaccount from kube-api-access-s6w5r (ro)Conditions: Type Status PodScheduled FalseVolumes: kube-api-access-s6w5r: Type: Projected (a volume that contains injected data from multiple sources) TokenExpirationSeconds: 3607 ConfigMapName: kube-root-ca.crt ConfigMapOptional: <nil> DownwardAPI: trueQoS Class: BestEffortNode-Selectors: <none>Tolerations: - node.kubernetes.io/not-ready:NoExecute op=Exists for 300s - node.kubernetes.io/unreachable:NoExecute op=Exists for 300sEvents: Type Reason Age From Message ---- ------ --- ---- ------- Warning FailedScheduling 265s (x3 over 10m) default-scheduler 0/2 nodes are available: 1 node(s) had untolerated taint {node-role.kubernetes.io/control-plane: }, 1 node(s) had untolerated taint {workload: machine-learning}. preemption: 0/2 nodes are available: 2 Preemption is not helpful for scheduling.
A taint prevents pods from being scheduled on a node unless they have an appropriate toleration. To fix this issue, modify the web app deployment to include the toleration for the taint “workload: machine-learning”. Below is the deployment YAML snippet before the change:
After applying these changes, the updated deployment allows the pod to tolerate the taint, and it is scheduled successfully. A sample of the updated deployment is shown below:
In this lesson, we reviewed three common scenarios that cause pods to remain in the pending state:
The data processor pod was pending due to insufficient CPU availability. The issue was resolved by reducing the CPU request (or by scaling the cluster).
The ML API pod was pending because it required a node that matched a specific node selector (“type: gpu”). Labeling the node correctly allowed it to schedule.
The web app pod was pending due to an untolerated taint. Adding an appropriate toleration in the deployment enabled the pod to be scheduled.
By understanding these challenges and solutions, you can ensure your pods are scheduled successfully in Kubernetes. Happy troubleshooting!